Comparative Study
. 2007 Jan;143(1):172-87.
doi: 10.1104/pp.106.087262. Epub 2006 Nov 10.

Combining expression and comparative evolutionary analysis. The COBRA gene family

Affiliations
Comparative Study

Combining expression and comparative evolutionary analysis. The COBRA gene family

Siobhan M Brady et al. Plant Physiol. 2007 Jan.

Abstract

Plant cell shape is achieved through a combination of oriented cell division and cell expansion and is defined by the cell wall. One of the genes identified to influence cell expansion in the Arabidopsis (Arabidopsis thaliana) root is the COBRA (COB) gene that belongs to a multigene family. Three members of the AtCOB gene family have been shown to play a role in specific types of cell expansion or cell wall biosynthesis. Functional orthologs of one of these genes have been identified in maize (Zea mays) and rice (Oryza sativa; Schindelman et al., 2001; Li et al., 2003; Brown et al., 2005; Persson et al., 2005; Ching et al., 2006; Jones et al., 2006). We present the maize counterpart of the COB gene family and the COB gene superfamily phylogeny. Most of the genes belong to a family with two main clades as previously identified by analysis of the Arabidopsis family alone. Within these clades, however, clear differences between monocot and eudicot family members exist, and these are analyzed in the context of Type I and Type II cell walls in eudicots and monocots. In addition to changes at the sequence level, gene regulation of this family in a eudicot, Arabidopsis, and a monocot, maize, is also characterized. Gene expression is analyzed in a multivariate approach, using data from a number of sources, including massively parallel signature sequencing libraries, transcriptional reporter fusions, and microarray data. This analysis has revealed that the expression of Arabidopsis and maize COB gene family members is highly developmentally and spatially regulated at the tissue and cell type-specific level, that gene superfamily members show overlapping and unique expression patterns, and that only a subset of gene superfamily members act in response to environmental stimuli. Regulation of expression of the Arabidopsis COB gene family members has highly diversified in comparison to that of the maize COB gene superfamily members. We also identify BRITTLE STALK 2-LIKE 3 as a putative ortholog of AtCOB.


Figures

Figure 1.
Figure 1.
ZmBk2 and ZmBk2L family proteins show characteristics of AtCOB family proteins. A, Hydropathy plot of the maize Bk2 and Bk2L family. The vertical axis represents the degree of hydrophilicity (positive values) or hydrophobicity (negative values). The horizontal axis represents the length of the protein in amino acids. All proteins contain hydrophobic ends flanked by a hydrophilic middle. B, Sequence alignment of the ZmBk2 and ZmBk2L family proteins with Arabidopsis COB and COBL7 by ClustalW. Dashes represent gaps introduced in the sequences for optimal alignment. Stars indicate identical residues while periods indicate conserved residues. The boxed area represents the CCVS Cys-rich domain that is highly conserved across the COB gene family. C, Predictors of GPI modification for the ZmBk2 and ZmBk2L family. The ω-site (most likely cleavage site) and the N-terminal signal cleavage position with P value and probability scores, respectively. The ω-site was determined using Big-PI, and the N-terminal signal peptide was predicted using SignalP 3.0.
Figure 2.
Figure 2.
The COB gene family phylogeny. Unrooted cladogram of the encoded proteins of the COB gene superfamily in Arabidopsis, rice, and maize determined by the heuristic algorithm. Bootstrap values are indicated for only those branches where they exceeded 50%. AtCOB represents the Arabidopsis COB family members. OsBC represents the rice COB family members. ZmBk2 represents the maize COB family members. The monocot-specific clade is marked with a bracket. AtCOBL4 and its probable functional orthologs ZmBk2 and OsBC1 are indicated in shading.
Figure 3.
Figure 3.
COB gene family expression is highly developmentally and spatially regulated in specific organs. A, Microarray data from the AtGenExpress organ dataset was extracted using Genevestigator and clustered using hierarchical clustering with average linkage. B, Transcript abundance in selected MPSS libraries. Root, Primary root from 2-week-old seedlings; leaves, V7 to V8; tassel, Meiosis I/II; silk, preemergent stage; ear, immature, V8; embryo, 12 DAP; endosperm, 45 DAP; pericarp, 27 DAP.
Figure 4.
Figure 4.
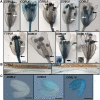
Unique expression patterns conferred by the upstream regulatory region of AtCOBL family members in the root tip (A), mature root (B), and lateral root primordia (C). All roots imaged are 5 d old. A, COBL1 is expressed in the columella and stele. COBL2 is expressed in the columella. COBL5 is expressed in zone of elongation, the columella, the quiescent center, and the lateral root cap. COBL6 is expressed in the lateral root cap. COBL8 is expressed in the quiescent center, the cortex, and the endodermis. COBL9 is primarily expressed in the lateral root cap and in epidermal cells. B, COBL4, COBL6, COBL7, and COBL9 are expressed in a localized manner throughout the mature root (GUS images). Confocal imaging shows that COBL4 is localized to the xylem, COBL6 to the epidermis and stele, and COBL9 to trichoblasts. C, COBL1, COBL7, and COBL8 are expressed in developing lateral root primordia, while COBL2 is expressed in the cells through which the lateral root primordium must emerge.
Figure 5.
Figure 5.
Maize Bk2 and Bk2L family member transcript abundance shows both overlapping and distinct developmental and spatial expression patterns. Transcript abundance in parts per million (ppm) of MPSS libraries are indicated along the y axis and tissue type along the x axis. Note the high expression of ZmBk2L3 in most tissues (horizontally striped bar in bar graphs, black triangle in line graphs).
Figure 6.
Figure 6.
Unique GUS expression patterns conferred by AtCOBL family member upstream regulatory regions in the cotyledon (A), vegetative rosette leaf (B), and cauline leaf (C). Images in A are at 16× magnification. B and C, Bar = 250 μm. A, COBL4 is expressed in localized areas of cotyledon vasculature, while COBL7 and COBL8 are expressed throughout cotyledon vasculature. COBL7 is also expressed in stomata overlying cotyledon vasculature (inset). B, COBL4 is expressed in localized areas of rosette leaf vasculature and in the petiole, while COBL7 and COBL8 are expressed throughout the leaf vasculature, although COBL8 is expressed in an acropetal manner. COBL9 is expressed at the base of trichomes overlying leaf primary vasculature. C, COBL1 is expressed in hydathodes and in a localized manner throughout the leaf vasculature. COBL4 is expressed in localized areas of the leaf vasculature. COBL5 is expressed strongly at the apex of the leaf in the vasculature. COBL7 is expressed in a basipetal manner throughout the leaf. COBL8 is expressed strongly at the base of the leaf in the vasculature.
Figure 7.
Figure 7.
Unique GUS expression patterns conferred by AtCOBL family member promoters in flowers (A), siliques at dehiscence (B), and mature embryos (C). A, COBL2 is expressed in the vasculature of sepals (black arrowhead), on the papillary surface of the stigma (black arrow), and in ovules (white arrow). COBL4 is expressed in all tissues of the flower. COBL5 is expressed in the vasculature of the pedicel and the stigma (white arrow and black arrowhead, respectively) and below the papillary surface of the receptacle. COBL6 is expressed in the anthers and in the ovules. COBL7 is expressed in the filaments of the stamen (black arrow) and in the vasculature of the sepals (white arrow). COBL8 is expressed in the pedicel (black arrow) and in the transmitting tube of the stigma (white arrow). COBL9 is expressed in the receptacle of the flower (black arrow). COBL10 is expressed in the pedicel (black arrowhead), anther filaments (white arrowhead), pollen grains (inset), and germinating pollen tubes (black arrowhead). COBL11 is expressed in pollen grains (black arrowhead). B, COBL2 is expressed in the funiculus (top) and along the outer surface of the silique pod upon dehiscence. COBL8 is expressed in the pedicel and in the replum upon dehiscence. C, COBL2 is expressed in the root tip of the mature embryo. COBL8 is expressed weakly throughout the entire embryo. COBL10 in contrast is expressed strongly throughout the embryo. Bar = 250 μm.
Figure 8.
Figure 8.
Few members of the COB gene family respond to stress or hormone treatments. A, Microarray data from the AtGenExpress stress dataset for the AtCOB family were extracted using Genevestigator and clustered using hierarchical clustering with average linkage. Expression is indicated as fold-change relative to the control. B, Microarray data relating to hormone treatments from the AtGenExpress stress dataset for the AtCOB family was extracted using Genevestigator and clustered using hierarchical clustering with average linkage. Expression is indicated as fold-change relative to the control. C, Transcript abundance of ZmBk2 family members in selected MPSS libraries representing leaves or roots undergoing various stress or hormone treatments. Control treatments are indicated by (−) and stress or hormone treatments indicated by (+). TPM = transcript abundance in parts per million.

References

    1. Appenzeller L, Doblin MS, Barreiro R, Wang H, Niu X, Kollipara K, Carrigan L, Tomes D, Chapman M, Dhugga KS (2004) Cellulose synthesis in maize: isolation and expression analysis of the cellulose synthase (CesA) gene family. Cellulose 11 287–289
    1. Benfey PN, Linstead PJ, Roberts K, Schiefelbein JW, Hauser MT, Aeschabacher RA (1993) Root development in Arabidopsis: four mutants with dramatically altered root morphogenesis. Development 119 57–70 - PubMed
    1. Blanc G, Hokamp K, Wolfe KH (2003) A recent polyploidy superimposed on older large-scale duplications in the Arabidopsis genome. Genome Res 13 137–144 - PMC - PubMed
    1. Borner GHH, Lilley KS, Stevens TJ, Dupree P (2003) Identification of glycosylphosphatidylinositol-anchored proteins in Arabidopsis. A proteomic and genomic analysis. Plant Physiol 132 568–577 - PMC - PubMed
    1. Brenner S, Johnson M, Bridgham J, Golda G, Lloyd DH, Johnson D, Luo S, McCurdy S, Foy M, Ewan M, et al (2000) Gene expression analysis by massively parallel signature sequencing (MPSS) on microbead arrays. Nat Biotechnol 18 630–634 - PubMed

Publication types

MeSH terms

LinkOut - more resources