. 2007 Apr;5(4):e94.
doi: 10.1371/journal.pbio.0050094.

Understanding the evolutionary fate of finite populations: the dynamics of mutational effects

Affiliations

Understanding the evolutionary fate of finite populations: the dynamics of mutational effects

Olin K Silander et al. PLoS Biol. 2007 Apr.

Abstract

The most consistent result in more than two decades of experimental evolution is that the fitness of populations adapting to a constant environment does not increase indefinitely, but reaches a plateau. Using experimental evolution with bacteriophage, we show here that the converse is also true. In populations small enough such that drift overwhelms selection and causes fitness to decrease, fitness declines down to a plateau. We demonstrate theoretically that both of these phenomena must be due either to changes in the ratio of beneficial to deleterious mutations, the size of mutational effects, or both. We use mutation accumulation experiments and molecular data from experimental evolution to show that the most significant change in mutational effects is a drastic increase in the rate of beneficial mutation as fitness decreases. In contrast, the size of mutational effects changes little even as organismal fitness changes over several orders of magnitude. These findings have significant implications for the dynamics of adaptation.


Conflict of interest statement

Competing interests. The authors have declared that no competing interests exist.

Figures

Figure 1
Figure 1. Changes in Mutational Distributions Due to Epistasis
The distribution of deleterious mutations appears in red, beneficial mutations in green. Arrows indicate the mean mutational effect; the width of the arrow reflects the rate of deleterious or beneficial mutations. (The total mutation rate remains constant.) Three mutational distributions are illustrated for each epistatic context: individuals of high, intermediate, and low fitness. (A) No epistasis. Mutational distributions are constant regardless of fitness. (B) Negative epistasis. The mean mutational effect increases as fitness decreases. (C) Compensatory epistasis. The mean effect of each mutational class stays constant, whereas the fraction of mutations that are beneficial increases as fitness decreases. (D) Positive epistasis. The mean mutational effect decreases as fitness decreases.
Figure 2
Figure 2. Changes in Mean Population Fitness
Dotted lines indicate the fitness of ancestral clones: the high-fitness clone (black circles), lower fitness clones (bright red triangles and dark red diamonds), and the evolved highest fitness ancestor (green squares); this ancestor was derived from the population having the highest fitness after 90 transfers (population 100c). Each point indicates the average fitness of an evolved population, with error bars indicating one standard error. Some populations are slightly displaced on the x-axis for clarity. The population bottleneck sizes were three, ten, 30, 100, and 250. Five lineages were propagated at bottleneck sizes three and ten, and three lineages were propagated for all other bottleneck sizes. The color and shape of each point indicates the ancestral clone from which that population was derived. The fitness of the high-fitness ancestor was set equal to zero on a log10 scale, and all other fitness values are relative.
Figure 3
Figure 3. Mutation Accumulation
(A) Fitness measurements of the high-fitness MA lines. The fitness values of the parents are shown in gray, the offspring in black. Note that all fitness values for each MA experiment were scaled such that the mean of the parental log10 fitness values was zero; this was done so that the error in fitness measurements was approximately normal, and so all three separate experiments in the low- and high-fitness lines could be combined on the same axis. (B) Fitness measurements of the low-fitness MA lines. Shading and scaling are the same as in (A). In both (A) and (B), a considerable shift to the left (lower fitness) can be observed after a single round of mutagenesis. In the low-fitness lines, several offspring clones with fitness greater than the parental clones can be observed. In the high-fitness lines, no such offspring clones are observed.
Figure 4
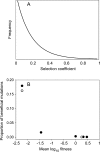
Figure 4. Mutational Parameters
(A) Shape of the joint ML gamma distribution of mutational effects for all MA datasets. The distribution is extremely leptokurtic (L-shaped), with the majority of mutations having very small selection coefficients, although a significant proportion have large selection coefficients. (B) Relationship between fitness and rate of compensatory mutation. Filled circles indicate the inferred proportion of compensatory mutations using the ML gamma distribution (illustrated in [A]) and the experimental fitness equilibria (see Materials and Methods). Open circles indicate the ML estimation from the mutation accumulation data. The close match between the two methods suggests that the estimates of B are robust. The two overlapping points have been displaced slightly for clarity. It appears that there is a nonlinear relationship between the proportion of beneficial mutation and log-fitness. This is not the relationship that would be expected under the simplest hypothesis of compensatory mutation (see text for more details).

References

    1. Crow JF, Kimura M. An introduction to population genetic theory. New York: Harper and Row; 1970. 656
    1. Bateman AJ. The viability of near-normal irradiated chromosomes. Int J Radiat Biol. 1959;1:170–180.
    1. Mukai T. The genetic structure of natural populations of Drosophila melanogaster. I. Spontaneous mutation rate of polygenes controlling viability. Genetics. 1964;50:1–19. - PMC - PubMed
    1. Chao L. Fitness of RNA virus decreased by Muller's ratchet. Nature. 1990;348:454–455. - PubMed
    1. Keightley PD. The distribution of mutation effects on viability in Drosophila-melanogaster . Genetics. 1994;138:1315–1322. - PMC - PubMed

Publication types

Associated data