

Bacterial community structure of acid-impacted lakes: what controls diversity?
- PMID: 18245245
- PMCID: PMC2268290
- DOI: 10.1128/AEM.01719-07
Bacterial community structure of acid-impacted lakes: what controls diversity?
Abstract
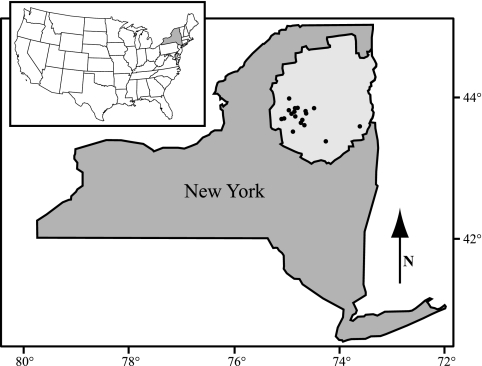
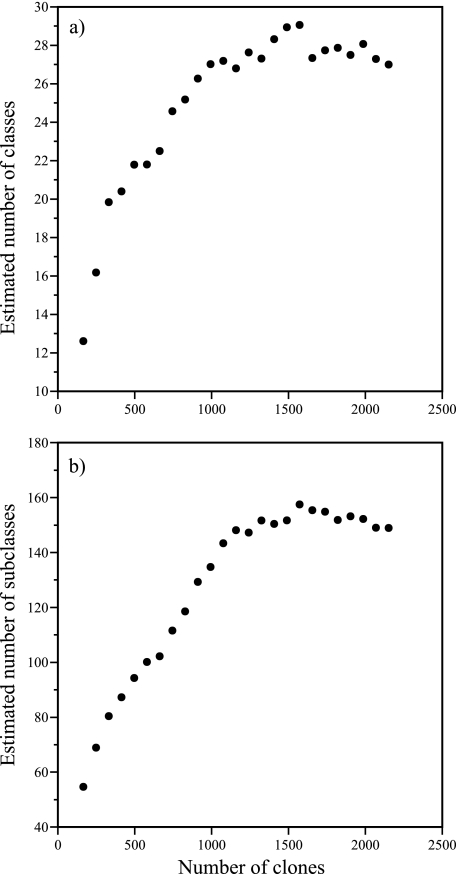
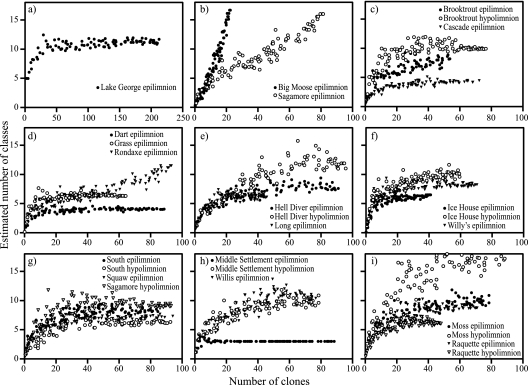
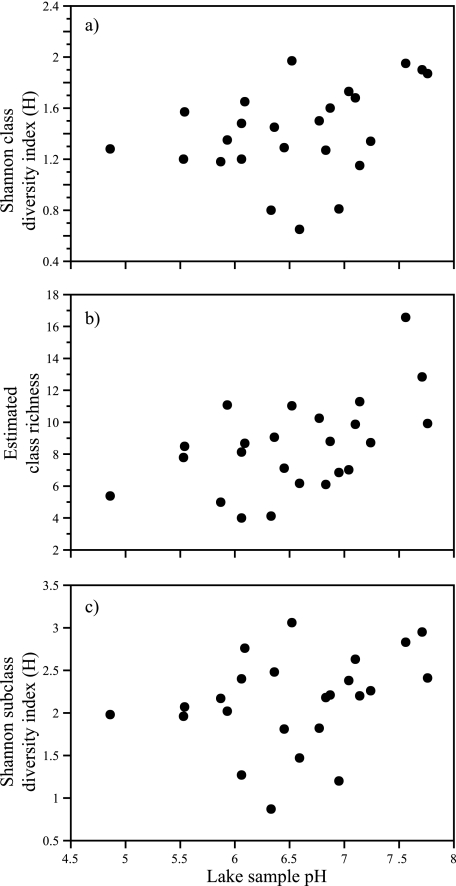
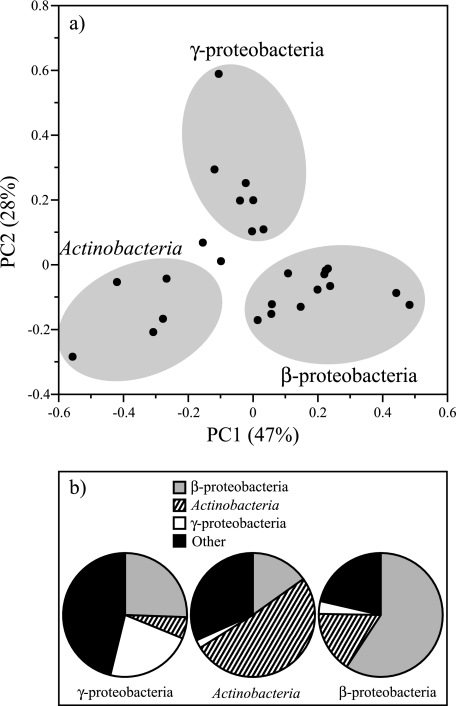
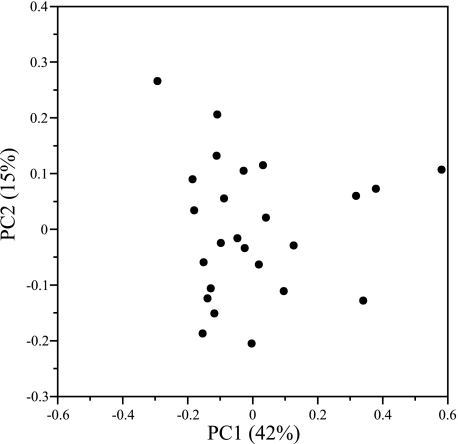
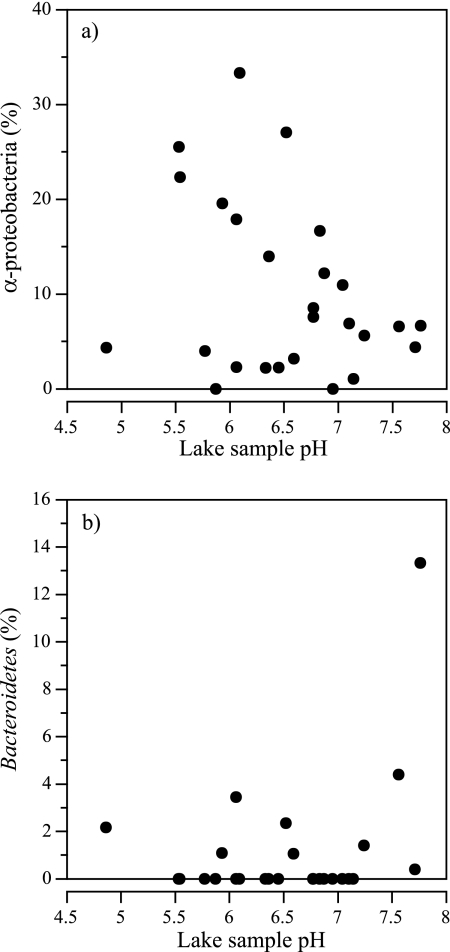
Although it is recognized that acidification of freshwater systems results in decreased overall species richness of plants and animals, little is known about the response of aquatic microbial communities to acidification. In this study we examined bacterioplankton community diversity and structure in 18 lakes located in the Adirondack Park (in the state of New York in the United States) that were affected to various degrees by acidic deposition and assessed correlations with 31 physical and chemical parameters. The pH of these lakes ranged from 4.9 to 7.8. These studies were conducted as a component of the Adirondack Effects Assessment Program supported by the U.S. Environmental Protection Agency. Thirty-one independent 16S rRNA gene libraries consisting of 2,135 clones were constructed from epilimnion and hypolimnion water samples. Bacterioplankton community composition was determined by sequencing and amplified ribosomal DNA restriction analysis of the clone libraries. Nineteen bacterial classes representing 95 subclasses were observed, but clone libraries were dominated by representatives of the Actinobacteria and Betaproteobacteria classes. Although the diversity and richness of bacterioplankton communities were positively correlated with pH, the overall community composition assessed by principal component analysis was not. The strongest correlations were observed between bacterioplankton communities and lake depth, hydraulic retention time, dissolved inorganic carbon, and nonlabile monomeric aluminum concentrations. While there was not an overall correlation between bacterioplankton community structure and pH, several bacterial classes, including the Alphaproteobacteria, were directly correlated with acidity. These results indicate that unlike more identifiable correlations between acidity and species richness for higher trophic levels, controls on bacterioplankton community structure are likely more complex, involving both direct and indirect processes.
Figures
References
-
- Balkwill, D. L., R. H. Reeves, G. R. Drake, J. Y. Reeves, F. H. Crocker, M. B. King, and D. R. Boone. 1997. Phylogenetic characterization of bacteria in the subsurface microbial culture collection. FEMS Microbiol. Rev. 20:201-216. - PubMed
-
- Carlson, R. E. 1977. A trophic state index for lakes. Limnol. Oceanogr. 22:361-369.
-
- Chao, A. 1987. Estimating the population size for capture-recapture data with unequal catchability. Biometrics 43:783-791. - PubMed
-
- Chao, A., R. L. Chazdon, R. K. Colwell, and T. J. Shen. 2005. A new statistical approach for assessing similarity of species composition with incidence and abundance data. Ecol. Lett. 8:148-159.
Publication types
MeSH terms
Substances
Associated data
- Actions
- Actions
- Actions
- Actions
- Actions
- Actions
- Actions
- Actions
- Actions
- Actions
- Actions
- Actions
- Actions
- Actions
- Actions
- Actions
- Actions
- Actions
- Actions
- Actions
- Actions
- Actions
- Actions
- Actions
- Actions
- Actions
- Actions
- Actions
- Actions
- Actions
- Actions
- Actions
- Actions
- Actions
- Actions
- Actions
- Actions
- Actions
- Actions
- Actions
- Actions
- Actions
- Actions
- Actions
- Actions
- Actions
- Actions
- Actions
- Actions
- Actions
- Actions
- Actions
- Actions
- Actions
- Actions
- Actions
- Actions
- Actions
- Actions
- Actions
- Actions
- Actions
- Actions
- Actions
- Actions
- Actions
- Actions
- Actions
- Actions
- Actions
- Actions
- Actions
- Actions
- Actions
- Actions
- Actions
- Actions
- Actions
- Actions
- Actions
- Actions
- Actions
- Actions
- Actions
- Actions
- Actions
- Actions
- Actions
- Actions
- Actions
- Actions
- Actions
- Actions
- Actions
- Actions
- Actions
- Actions
- Actions
- Actions
- Actions
- Actions
- Actions
- Actions
- Actions
- Actions
- Actions
- Actions
- Actions
- Actions
- Actions
- Actions
- Actions
- Actions
- Actions
- Actions
- Actions
- Actions
- Actions
- Actions
- Actions
- Actions
- Actions
- Actions
- Actions
- Actions
- Actions
- Actions
- Actions
- Actions
- Actions
- Actions
- Actions
- Actions
- Actions
- Actions
- Actions
- Actions
- Actions
- Actions
- Actions
- Actions
- Actions
- Actions
- Actions
- Actions
- Actions
- Actions
- Actions
- Actions
- Actions
- Actions
- Actions
- Actions
- Actions
- Actions
- Actions
- Actions
- Actions
- Actions
- Actions
- Actions
- Actions
- Actions
- Actions
- Actions
- Actions
- Actions
- Actions
- Actions
- Actions
- Actions
- Actions
- Actions
- Actions
- Actions
- Actions
- Actions
- Actions
- Actions
- Actions
- Actions
- Actions
- Actions
- Actions
- Actions
- Actions
- Actions
- Actions
- Actions
- Actions
- Actions
- Actions
- Actions
- Actions
- Actions
- Actions
- Actions
- Actions
- Actions
- Actions
- Actions
- Actions
- Actions
- Actions
- Actions
- Actions
- Actions
- Actions
- Actions
- Actions
- Actions
- Actions
- Actions
- Actions
- Actions
- Actions
- Actions
- Actions
- Actions
- Actions
- Actions
- Actions
- Actions
- Actions
- Actions
- Actions
- Actions
- Actions
- Actions
- Actions
- Actions
- Actions
- Actions
- Actions
- Actions
- Actions
- Actions
- Actions
- Actions
- Actions
- Actions
- Actions
- Actions
- Actions
- Actions
- Actions
- Actions
- Actions
- Actions
- Actions
- Actions
- Actions
- Actions
- Actions
- Actions
- Actions
- Actions
- Actions
- Actions
- Actions
- Actions
- Actions
- Actions
- Actions
- Actions
- Actions
- Actions
- Actions
- Actions
- Actions
- Actions
- Actions
- Actions
- Actions
- Actions
- Actions
- Actions
- Actions
- Actions
- Actions
- Actions
- Actions
- Actions
- Actions
- Actions
- Actions
- Actions
- Actions
- Actions
- Actions
LinkOut - more resources
Full Text Sources
Molecular Biology Databases
