. 2008 Jan;6(1):e4.
doi: 10.1371/journal.pbio.0060004.

Cryptochromes define a novel circadian clock mechanism in monarch butterflies that may underlie sun compass navigation

Affiliations

Cryptochromes define a novel circadian clock mechanism in monarch butterflies that may underlie sun compass navigation

Haisun Zhu et al. PLoS Biol. 2008 Jan.

Abstract

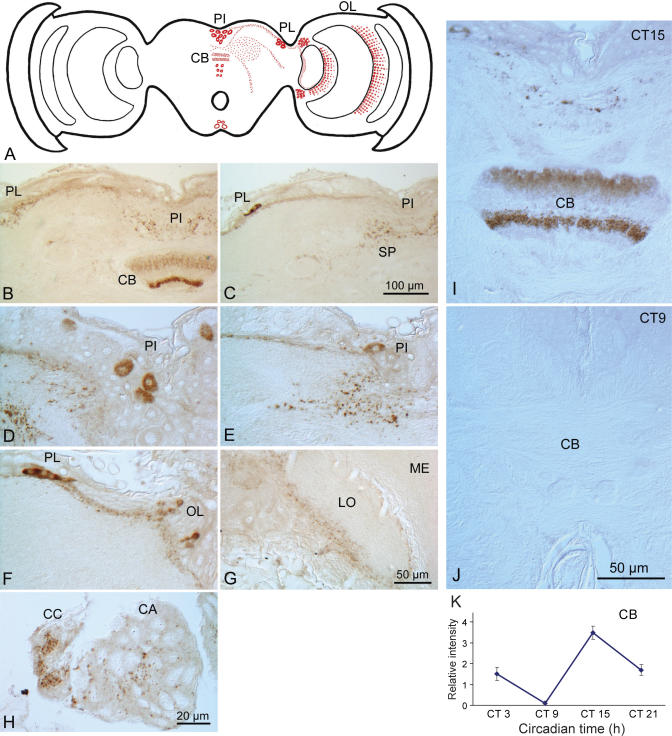
The circadian clock plays a vital role in monarch butterfly (Danaus plexippus) migration by providing the timing component of time-compensated sun compass orientation, a process that is important for successful navigation. We therefore evaluated the monarch clockwork by focusing on the functions of a Drosophila-like cryptochrome (cry), designated cry1, and a vertebrate-like cry, designated cry2, that are both expressed in the butterfly and by placing these genes in the context of other relevant clock genes in vivo. We found that similar temporal patterns of clock gene expression and protein levels occur in the heads, as occur in DpN1 cells, of a monarch cell line that contains a light-driven clock. CRY1 mediates TIMELESS degradation by light in DpN1 cells, and a light-induced TIMELESS decrease occurs in putative clock cells in the pars lateralis (PL) in the brain. Moreover, monarch cry1 transgenes partially rescue both biochemical and behavioral light-input defects in cry(b) mutant Drosophila. CRY2 is the major transcriptional repressor of CLOCK:CYCLE-mediated transcription in DpN1 cells, and endogenous CRY2 potently inhibits transcription without involvement of PERIOD. CRY2 is co-localized with clock proteins in the PL, and there it translocates to the nucleus at the appropriate time for transcriptional repression. We also discovered CRY2-positive neural projections that oscillate in the central complex. The results define a novel, CRY-centric clock mechanism in the monarch in which CRY1 likely functions as a blue-light photoreceptor for entrainment, whereas CRY2 functions within the clockwork as the transcriptional repressor of a negative transcriptional feedback loop. Our data further suggest that CRY2 may have a dual role in the monarch butterfly's brain-as a core clock element and as an output that regulates circadian activity in the central complex, the likely site of the sun compass.


Conflict of interest statement

Competing interests. The authors have declared that no competing interests exist.

Figures

Figure 1
Figure 1. Temporal Patterns of Clock Gene RNA and Protein Expression in Monarch Heads and DpN1 Cells
(A) Temporal profiles of clock gene RNA expression in heads. Heads were collected at 3-h intervals for 24 h in LD and during the first day in DD. RNA levels were quantitated by qPCR. Each value is the mean ± SEM from 6 sets of heads. Open bars, light; black bars, dark; gray bars, subjective day. p-value determined by one-way ANOVA. (B) Temporal profiles of clock proteins in heads. Heads were collected at 3-h intervals for 24 h in LD and during the first day in DD. Extracts were prepared, analyzed by Western blot and probed for PER (GP40), TIM (GP47), CRY1 (GP37), and CRY2 (GP51). Blots were imaged by chemiluminescence, and band intensity was quantified. The results were normalized against α-tubulin. Each value is the mean ± SEM from six heads. In LD: PER and TIM, p < 0.001. In DD: PER, p < 0.01; TIM, p > 0.05. (C) Temporal profiles of clock gene RNA expression in DpN1 cells. Cells were collected at 4-h intervals for two days in LD followed by two days in DD, and RNA levels were quantitated by qPCR . Each value is the mean ± SEM of three collections. (D) Temporal profiles of clock proteins in DpN1 cells. Cell homogenates were prepared, analyzed by Western blot and probed for PER (GP40), TIM (GP47), CRY1 (GP37), and CRY2 (GP51). Blots were imaged by chemiluminescence, and the band intensity was quantified. The results were normalized against α-tubulin. Each value is the mean ± SEM of three collections. In LD, PER, p < 0.05; for TIM and CRY2, p < 0.001.
Figure 2
Figure 2. CRY1 and TIM Reponses to Light in DpN1 Cells
Clock protein abundance in LD-cultured cells changes in response to light. DpN1 cells were cultured under LD, pretreated with dsRNA against GFP (black lines) or dsRNA against cry1 (red lines), and then exposed to light (at the start of the normal light period) for 540 min. Cells were collected at the designated times. Cell homogenates were analyzed by Western blot, and probed for CRY1 (GP37), TIM (GP47), PER (GP40), and CRY2 (GP51) (left-hand panels). The time courses of declines were quantified by chemiluminescence, and band intensity was normalized against α-tubulin (right-hand panels). (A) CRY1, (B) TIM, (C) PER, (D) CRY2. Time 0 is before lights on. Each point is the mean ± SEM of three experiments.
Figure 3
Figure 3. Distribution and Regulation of TIM Immunoreactivity in Monarch Brain
(A) Schematic representation of a frontal section illustrating the topology of TIM-immunoreactive cells using antibody TIM-R38. Although an identical pattern of TIM staining was obtained with TIM-GP47, TIM-R38 was used in experiments depicted in (B–J), because of stronger signal intensity. RE, retina; LA, lamina; ME, medulla; LO, lobula of optic lobe (OL); PL, pars lateralis; PI pars intercerebralis; SOG, suboesphageal ganglion. (B and C) Double-labeling immunofluorscence of TIM (B) and corazonin (COR; C) in cells in the PL. The three cells shown are co-localized with TIM and COR; the fourth cell was out of the plane of section. (D and E) TIM staining in PL at CT 15 (D) and CT 9 (E). Two cells are shown; the other two were out of the plane of section. (F and G) TIM staining in PL at ZT 15 in darkness (F) or after a 1-h light pulse (ZT 15L) (G). Two cells are shown; the other two were out of the plane of section. (H) Semiquantitative assessment of TIM staining in PI, PL, OL, and SOG at ZT 6 and ZT 15. Intensity values were corrected for relative cell number in each group so that the values could be compared across groups. Each value is mean ± SEM of four animals. *p < 0.05; ***p < 0.001. (I) Semiquantitative assessment of TIM staining in PI, PL, OL, and SOG at the two circadian times (CT 9 and CT 15). Each value is mean ± SEM of eight animals. *p < 0.05. (J) Semiquantitative assessment of TIM staining in PI, PL, OL, and SOG before and after the light pulse (ZT 15 and ZT 15L, respectively). Each value is mean ± SEM of eight animals. ***p < 0.001.
Figure 4
Figure 4. Transgene Expression of Monarch cry1 Partially Rescues cryb Defects
(A) Expression of monarch CRY1 in a cryb background partially rescues phase advances and delays after a 1-h light pulse at ZT 21 or ZT 15, respectively. Four independent UAS-cry1 lines—designated 1a, 6b, 15b, and 22b—were examined. Expression of the transgenes was driven by tim-GAL4. Phase changes: positive numbers are advances, negative numbers are delays. The ZT 21 pulse experiment was performed three times for cryb, y w, 6b, 15b, and 22b, and twice for 1a, using 16 males per genotype per experiment. The ZT 15 pulse experiment was performed four times for cryb, y w, 6b, 15b, and 22b, and three times for 1a, using 16 males per genotype per experiment. Each value is the mean ± SEM. The value for cryb at ZT 15 was 0 with SEM within the width of the horizontal line. (B) Expression of monarch CRY2 in a cryb background does not rescue phase shifts after a 1-h light pulse at either ZT 21 or ZT 15. Three independent UAS-cry2 lines, designated 19a, 18b, and 125a, were examined. The UAS-cry1 line, 15b, was included as a comparison. Expression of all the transgenes was driven by tim-GAL4. The ZT 21 and ZT 15 pulses experiments were performed three times each, using 16 males per genotype per light pulse per experiment. Each value is the mean ± SEM. (C) Expression of monarch CRY1 partially rescues Drosophila TIM cycling in LD. Flies were collected at ZT 5 and ZT 17. Whole head extracts were subjected to Western blot analysis using a Drosophila anti-TIM antibody (top half of blot) or anti-tubulin antibody (bottom half of same blot). The UAS-cry1 lines are the same as in (A). TIM levels at ZT 17 were normalized to 1.0. This experiment was performed three times. Each value is the mean ± SEM. (D) Expression of monarch CRY2 does not rescue Drosophila TIM cycling in LD. The UAS-cry2 lines are the same as in (B). The UAS-cry1 line, 15b, is included for comparison. TIM levels at ZT 17 are normalized to 1.0. This experiment was performed three times. Each value is the mean ± SEM.
Figure 5
Figure 5. CRY2 Is a Major Repressor of CLK:CYC–Mediated Transcription in DpN1 Cells
(A) Monarch CRY2 inhibits dpCLK:dpCYC–mediated transcription using luciferase reporter gene assays. The monarch butterfly per E box enhancer luciferase reporter (dpPer4Ep-Luc; 50 ng) was used in the presence (+) or absence (–) of monarch CLK/CYC expression plasmids (50 ng each). Monarch cry1 (5, 15, and 50 ng), cry2 (5, 15, and 50 ng), per (10, 30, and 100 ng), or tim (1, 30, and 100 ng) was used. Luciferase activity relative to β-galactosidase activity was computed. Each value is the mean ± SEM of three independent transfections. Western blot of FLAG-epitope–-tagged protein expression levels for each concentration of each construct is depicted below the graph. (B) De-repression assay showing that endogenous CRY2 inhibits dpCLK:dpCYC–mediated transcription. The monarch per E box luciferase reporter and monarch CLOCK and CYC were co-transfected into DpN1 cells to elevate reporter activity. The ability of endogenous PER, TIM, CRY1, or CRY2 to inhibit CLK:CYC-mediated transcriptional activity was then evaluated using dsRNA directed against each RNA to determine what effect knockdown had on the levels of all four clock proteins (Western blots using PER-GP40, TIM-GP47, CRY1-GP37, or CRY2-GP51, upper panel) and whether knockdown elevated (de-repressed) luciferase activity (lower panel). The luciferase values are the mean ± SEM of three independent experiments. (C) Monarch clock proteins form multimeric complexes in vivo. Brain or DpN1 extracts from ZT 18–19 were immunoprecipitated with antibodies against monarch PER (R33), TIM (R38), or CRY2 (R41). Immunocomplexes generated by each antibody were then analyzed by Western blot and probed for all three proteins (PER-GP40, TIM-GP47, and CRY2-GP51). (D) Knockdown of endogenous CRY2 abolishes the diurnal per RNA rhythm. dsRNA against monarch cry2 was transfected into DpN1 cells to knock down CRY2 (Figure S9A), and per RNA levels were monitored at 4-h intervals over 24 h in LD. Double-stranded RNA against GFP served as the control. Relative monarch per RNA levels are depicted. Each value is mean ± SEM of three experiments. Solid line, GFP control; dashed line, CRY2 knockdown. (E) Oscillation in nuclear CRY2 abundance in DpN1 cells. Cells were entrained to LD and then fixed at 4-h intervals over 24 h in LD. The cellular localization of CRY2 was assayed by immunocytochemistry using CRY2-GP51. The cells were counterstained with SYTOX Blue to visualize the nuclei. At each time point, the localization of CRY2 in the cells was categorized as nuclear, cytoplasmic, or both nuclear and cytoplasmic. The proportion of cells at each time point in each category was calculated as the percentage of the total number of cells counted (30 per slide). Each bar represents the mean ± SEM of three experiments. Representative photomicrographs of CRY2 staining in nucleus, and in both cytoplasm and nucleus are shown in Figure S9B.
Figure 6
Figure 6. CRY2 Protein Distribution and Nuclear Localization in Monarch Brain.
(A) Schematic representation of a frontal section illustrating the topology of CRY2-immunoreactive cells using antibody CRY2-R42. A similar pattern of CRY2 staining was found using CRY2-GP51 (see Figure S13). (B) CRY2 immunoreactivity in neurosecretory cells in the PI. (C) CRY2 immunoreactivity in cells in the PL. (D and E) Double-labeling immunofluorescence of CRY2 (D) and COR (E) in two cells in the PL. The other two co-localized cells were out of the plane of section. (F) Semiquantitative assessment of CRY2 immunostaining in the PI, PL, and dorsal and ventral OL on the first day in DD. Intensity values were corrected for relative cell number in each group so that the values could be compared across groups. Each point is mean ± SEM of 5–6 brains. For PI, p < 0.01, one-way ANOVA; PL, p < 0.05; OL, p < 0.01. (G) Nuclear localization of CRY2 using antibody to CRY2-R42. CRY2 staining in PL at ZT 0, top left; ZT 4, bottom left; CT 15, top right; and CT 3, bottom right. DAPI counterstaining was used to define the nucleus (not shown). CRY2 staining was not found in the nucleus at ZT 0 or CT 15, but it was found in the nucleus in PL at ZT 4 and CT 3 (arrows). (H) Comparison of per RNA levels in brain with temporal patterns of CRY2 nuclear staining in PL. Upper, per RNA levels for two sets of dissected brains without photoreceptors (black and blue lines) collected at 4-h intervals over 24 h in LD. Middle, nuclear CRY2 staining in PL at seven ZT times plotted as % of brains examined (n = 4–5 brains at each time point). Lower, nuclear CRY2 staining in the PL at four time points over the circadian cycle plotted as percent of brains examined (n = 4–5 brains at each time point).
Figure 7
Figure 7. CRY2 Fiber Pathways in Monarch Brain
(A) Schematic representation of frontal section illustrating the topology of CRY2 fibers at CT 15 using antibody CRY2-R42. A similar pattern of CRY2 fiber staining was found using antibody CRY2-GP51 (see Figure S13). PI, pars intercerebralis; PL, pars intercerebralis; OL, optic lobe; CB, central body. (B) CRY2 staining in central body (CB). PL, pars lateralis; PI, pars intercerebralis. (C–E) CRY2 fibers between PL and PI. SP, superior protocerebral bridge. CRY2 staining was not visible in central body on this section because the section is cut at a different plane. (F and G) CRY2 fibers between pars lateralis and optic lobe (OL); LO, lobula; ME, medulla. (H) CRY2 staining in corpora cardiaca (CC) and corpora allata (CA). (I and J) Circadian oscillation of CRY2 staining in the central complex. (I) CRY2 staining in upper and lower central body of the central complex at CT 15. (J) CRY2 staining in upper and lower central body of the central complex at CT 9. (K) Semiquantitative assessment of CRY2 staining in central body (CB) over the circadian day. Each value is mean ± SEM of five animals. Similar results were found in a replicate experiment using either CRY2-R42 or CRY2-GP51.
Figure 8
Figure 8. Proposed Monarch Butterfly Circadian Clock Mechanism and CRY-Centric Clock-Compass Models
(A) The main gear of the clock mechanism in pars lateralis is an autoregulatory transcription feedback loop in which CLK and CYC heterodimers drive the transcription of the per, tim, and cry2 genes through E box enhancer elements; in addition to per, there are CACGTG E box elements within the 1.5-kb 5′ flanking regions of the butterfly tim and cry2 genes (unpublished data). TIM (T), PER (P), and CRY2 (C2) form complexes in the cytoplasm, and CRY2 is shuttled into the nucleus where it shuts down CLK:CYC–mediated transcription. PER is progressively phosphorylated and likely helps translocate CRY2 into nucleus. CRY1 (C1) is a circadian photoreceptor, which, upon light exposure (lightning bolt), causes TIM degradation to gain access to the central clock mechanism. The thick gray arrows represent output functions for CRY1 and for CRY2. (B) Clock-compass pathways in monarch butterfly brain. A circadian clock in the PL is entrained by light acting through CRY1 expressed in clock cells (orange line). A CRY1-positive fiber pathway (orange) connects the circadian clock to axons originating from polarized UV light-sensitive photoreceptors in the dorsal rim of the compound eye [13, 45]. The circadian clock also may interact directly with the sun compass (in the central complex) through a CRY2-positive fiber pathway (green) discovered in the current study. Output from the central complex ultimately controls motor output.

Comment in

  • In monarchs, Cry2 is king of the clock.
    Robinson R. Robinson R. PLoS Biol. 2008 Jan;6(1):e12. doi: 10.1371/journal.pbio.0060012. Epub 2008 Jan 8. PLoS Biol. 2008. PMID: 20076689 Free PMC article. No abstract available.

References

    1. Saunders DS. Insect clocks. Boston: Elsevier; 2002. 560 xv,
    1. Stanewsky R. Genetic analysis of the circadian system in Drosophila melanogaster and mammals. J Neurobiol. 2003;54:111–147. - PubMed
    1. Williams JA, Sehgal A. Molecular components of the circadian system in Drosophila. Annu Rev Physiol. 2001;63:729–755. - PubMed
    1. Emery P, So WV, Kaneko M, Hall JC, Rosbash M. CRY, a Drosophila clock and light-regulated cryptochrome, is a major contributor to circadian rhythm resetting and photosensitivity. Cell. 1998;95:669–679. - PubMed
    1. Emery P, Stanewsky R, Helfrich-Forster C, Emery-Le M, Hall JC, et al. Drosophila CRY is a deep brain circadian photoreceptor. Neuron. 2000;26:493–504. - PubMed

Publication types

LinkOut - more resources