

Characterization of the archaeal community in a minerotrophic fen and terminal restriction fragment length polymorphism-directed isolation of a novel hydrogenotrophic methanogen
- PMID: 18281434
- PMCID: PMC2292581
- DOI: 10.1128/AEM.02222-07
Characterization of the archaeal community in a minerotrophic fen and terminal restriction fragment length polymorphism-directed isolation of a novel hydrogenotrophic methanogen
Abstract
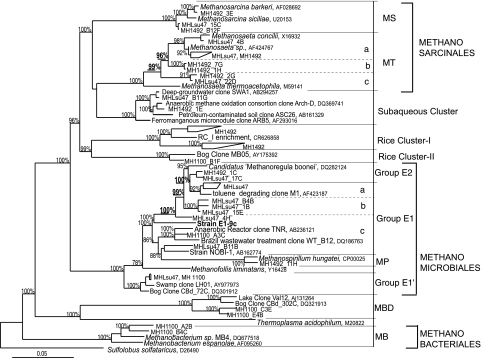
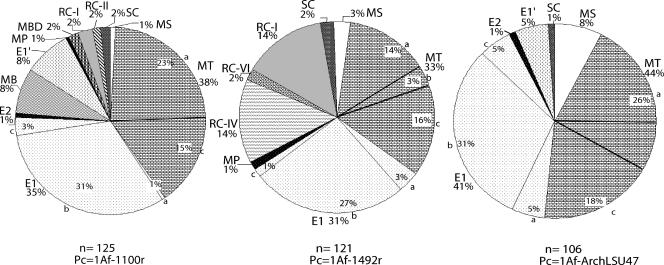
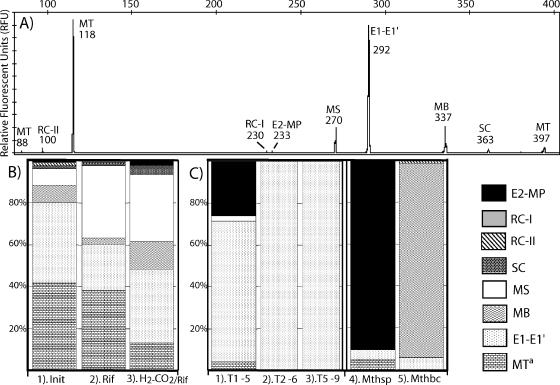
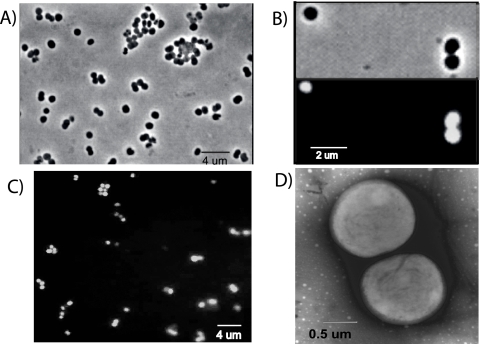
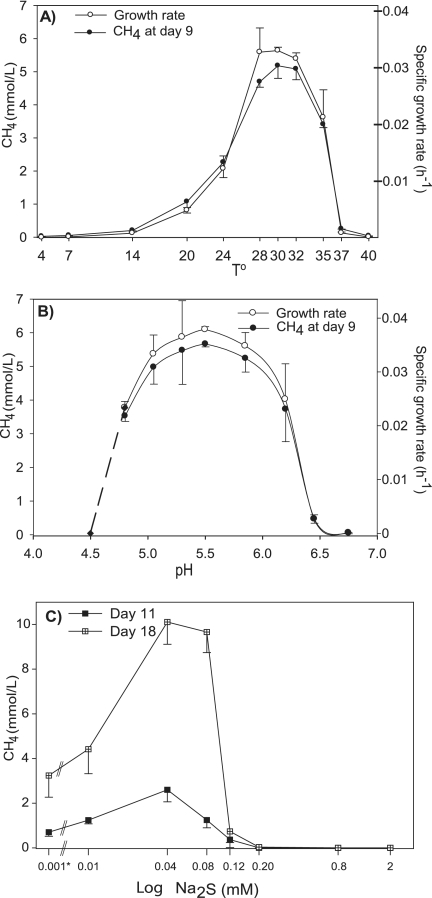
Minerotrophic fen peatlands are widely distributed in northern latitudes and, because of their rapid turnover of organic matter, are potentially larger sources of atmospheric methane than bog peatlands per unit area. However, studies of the archaeal community composition in fens are scarce particularly in minerotrophic sites. Several 16S rRNA-based primer sets were used to obtain a broad characterization of the archaeal community in a minerotrophic fen in central New York State. A wide archaeal diversity was observed in the site: 11 euryarchaeal and 2 crenarchaeal groups, most of which were uncultured. The E1 group, a novel cluster in the order Methanomicrobiales, and Methanosaetaceae were the codominant groups in all libraries and results of terminal restriction fragment length polymorphism (T-RFLP) analysis. Given its abundance and potential hydrogenotrophic methane contribution, the E1 group was targeted for culture attempts with a low-ionic-strength medium (PM1). Initial attempts yielded Methanospirillum-dominated cultures. However, by incorporating a T-RFLP analysis as a quick selection tool for treatments and replicates, we were able to select an enrichment dominated by E1. Further dilutions to 10(-9) and tracking with T-RFLP yielded a strain named E1-9c. E1-9c is a novel coccoid hydrogenotrophic, mesophilic, slightly acidophilic methanogen and is highly sensitive to Na(2)S concentrations (requires <0.12 mM for growth). We propose E1-9c as the first representative of a novel genus in the Methanomicrobiales order.
Figures
References
-
- Avery, G. B., R. D. Shannon, J. R. White, C. S. Martens, and M. J. Alperin. 1999. Effect of seasonal changes in the pathways of methanogenesis on the delta C-13 values of pore water methane in a Michigan peatland. Global Biogeochem. Cycles 13:475-484.
-
- Avery, G. B., R. D. Shannon, J. R. White, C. S. Martens, and M. J. Alperin. 2003. Controls on methane production in a tidal freshwater estuary and a peatland: methane production via acetate fermentation and CO2 reduction. Biogeochemistry 62:19-37.
-
- Basiliko, N., J. B. Yavitt, P. M. Dees, and S. Merkel. 2003. Methane biogeochemistry and methanogen communities in two Northern peatland ecosystems, New York State. Geomicrobiol. J. 20:563-577.
Publication types
MeSH terms
Substances
Associated data
- Actions
- Actions
- Actions
- Actions
- Actions
- Actions
- Actions
- Actions
- Actions
- Actions
- Actions
- Actions
- Actions
- Actions
- Actions
- Actions
- Actions
- Actions
- Actions
- Actions
- Actions
- Actions
- Actions
- Actions
- Actions
- Actions
- Actions
- Actions
- Actions
- Actions
- Actions
- Actions
- Actions
- Actions
- Actions
- Actions
- Actions
- Actions
- Actions
- Actions
- Actions
- Actions
- Actions
- Actions
- Actions
- Actions
- Actions
- Actions
- Actions
- Actions
- Actions
- Actions
- Actions
- Actions
- Actions
- Actions
- Actions
- Actions
- Actions
- Actions
- Actions
- Actions
- Actions
- Actions
- Actions
- Actions
- Actions
- Actions
- Actions
- Actions
- Actions
- Actions
- Actions
- Actions
- Actions
- Actions
- Actions
- Actions
- Actions
- Actions
- Actions
- Actions
- Actions
- Actions
- Actions
- Actions
- Actions
- Actions
- Actions
- Actions
- Actions
- Actions
- Actions
- Actions
- Actions
- Actions
- Actions
- Actions
- Actions
- Actions
- Actions
- Actions
- Actions
- Actions
- Actions
LinkOut - more resources
Full Text Sources
Molecular Biology Databases
