

Ecology, genetic diversity, and phylogeographic structure of andes virus in humans and rodents in Chile
- PMID: 19116256
- PMCID: PMC2648280
- DOI: 10.1128/JVI.01057-08
Ecology, genetic diversity, and phylogeographic structure of andes virus in humans and rodents in Chile
Abstract
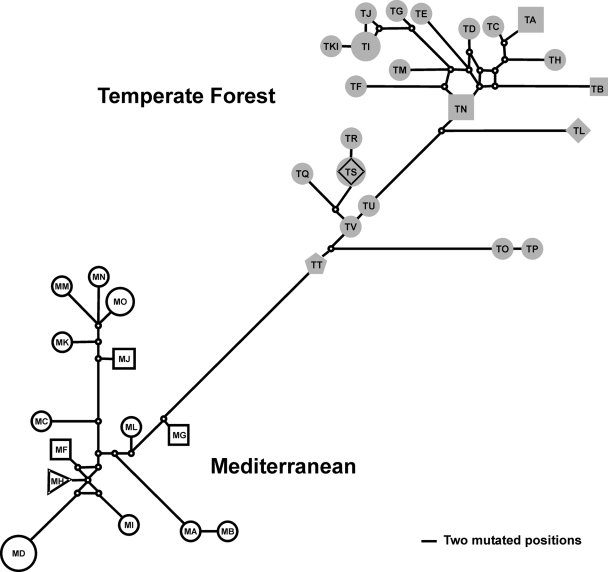
Andes virus (ANDV) is the predominant etiologic agent of hantavirus cardiopulmonary syndrome (HCPS) in southern South America. In Chile, serologically confirmed human hantavirus infections have occurred throughout a wide latitudinal distribution extending from the regions of Valparaíso (32 to 33 degrees S) to Aysén (46 degrees S) in southern Patagonia. In this study, we found seropositive rodents further north in the Coquimbo region (30 degrees S) in Chile. Rodent seroprevalence was 1.4%, with Oligoryzomys longicaudatus displaying the highest seroprevalence (5.9%), followed by Abrothrix longipilis (1.9%) and other species exhibiting </=0.6% seropositivity. We sequenced partial ANDV small (S) segment RNA from 6 HCPS patients and 32 rodents of four different species collected throughout the known range of hantavirus infection in Chile. Phylogenetic analyses showed two major ANDV South (ANDV Sout) clades, congruent with two major Chilean ecoregions, Mediterranean (Chilean matorral [shrubland]) and Valdivian temperate forest. Human and rodent samples grouped according to geographic location. Phylogenetic comparative analyses of portions of S and medium segments (encoding glycoproteins Gn and Gc) from a subset of rodent specimens exhibited similar topologies, corroborating two major ANDV Sout clades in Chile and suggesting that yet unknown factors influence viral gene flow and persistence throughout the two Chilean ecoregions. Genetic algorithms for recombination detection identified recombination events within the S segment. Molecular demographic analyses showed that the virus is undergoing purifying selection and demonstrated a recent exponential growth in the effective number of ANDV Sout infections in Chile that correlates with the increased number of human cases reported. Although we determined virus sequences from four rodent species, our results confirmed O. longicaudatus as the primary ANDV Sout reservoir in Chile. While evidence of geographic differentiation exists, a single cosmopolitan lineage of ANDV Sout remains the sole etiologic agent for HCPS in Chile.
Figures


References
-
- Abascal, F., R. Zardoya, and D. Posada. 2005. ProtTest: selection of best-fit models of protein evolution. Bioinformatics 212104-2105. - PubMed
-
- Alfaro, M. E., S. Zoller, and F. Lutzoni. 2003. Bayes or bootstrap? A simulation study comparing the performance of Bayesian Markov chain Monte Carlo sampling and bootstrapping in assessing phylogenetic confidence. Mol. Biol. Evol. 20255-266. - PubMed
-
- Amigo, J., and C. Ramirez. 1998. A bioclimatic classification of Chile: woodland communities in the temperate zone. Plant Ecol. 1369-26.
-
- Armesto, J. J., M. T. K. Arroyo, L. F. Hinojosa, T. T. Veblen, K. R. Young, and A. R. Orme. 2007. The Mediterranean environment of central Chile, p. 184-199. In T. T. Veblen, A. R. Orme, and K. R. Young (ed.), The physical geography of South America. Oxford University Press, Oxford, United Kingdom.
-
- Bandelt, H. J., P. Forster, and A. Rohl. 1999. Median-joining networks for inferring intraspecific phylogenies. Mol. Biol. Evol. 1637-48. - PubMed
Publication types
MeSH terms
Substances
Associated data
- Actions
- Actions
- Actions
- Actions
- Actions
- Actions
- Actions
- Actions
- Actions
- Actions
- Actions
- Actions
- Actions
- Actions
- Actions
- Actions
- Actions
- Actions
- Actions
- Actions
- Actions
- Actions
- Actions
- Actions
- Actions
- Actions
- Actions
- Actions
- Actions
- Actions
- Actions
- Actions
- Actions
- Actions
- Actions
- Actions
- Actions
- Actions
- Actions
- Actions
- Actions
- Actions
- Actions
- Actions
- Actions
- Actions
- Actions
- Actions
- Actions
- Actions
- Actions
- Actions
- Actions
- Actions
- Actions
- Actions
- Actions
- Actions
- Actions
- Actions
- Actions
- Actions
- Actions
- Actions
- Actions
Grants and funding
LinkOut - more resources
Full Text Sources
Other Literature Sources
Medical
Miscellaneous
