. 2020 Oct;30(10):1533-1546.
doi: 10.1101/gr.262790.120. Epub 2020 Sep 28.

Genome variation and population structure among 1142 mosquitoes of the African malaria vector species Anopheles gambiae and Anopheles coluzzii

Collaborators

Genome variation and population structure among 1142 mosquitoes of the African malaria vector species Anopheles gambiae and Anopheles coluzzii

Anopheles gambiae 1000 Genomes Consortium. Genome Res. 2020 Oct.

Abstract

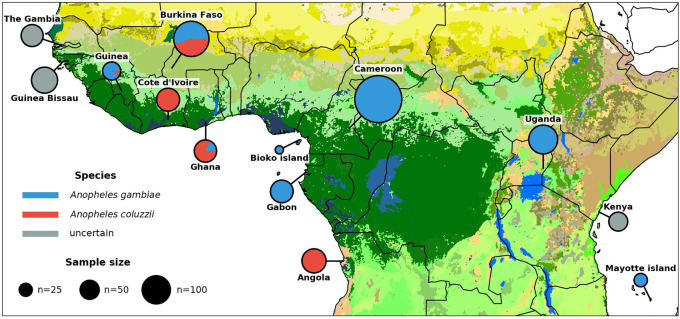
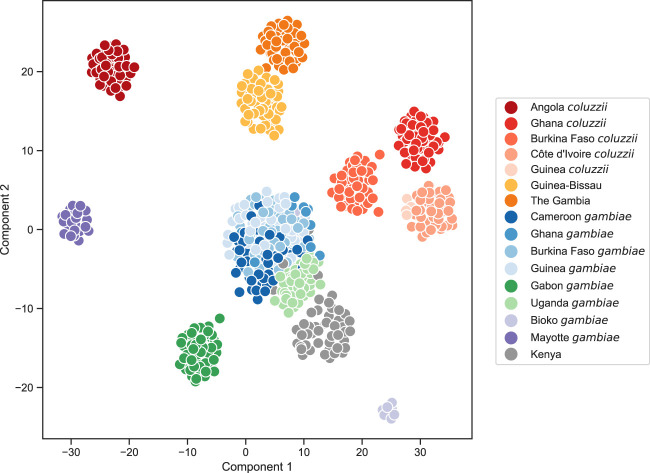
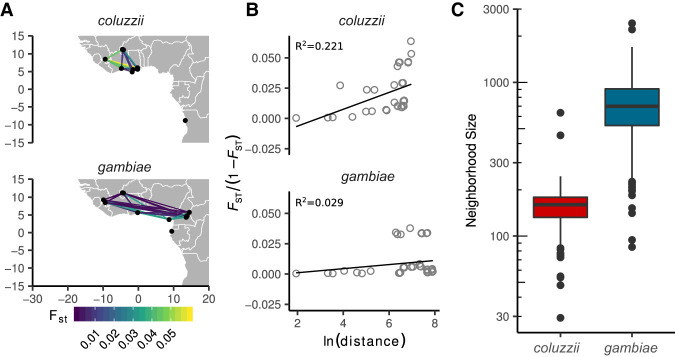
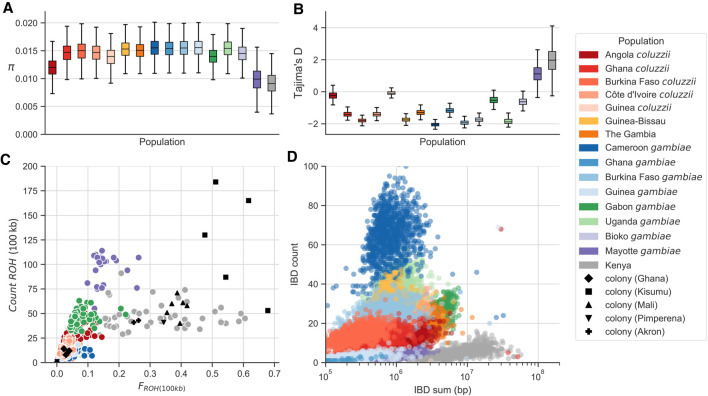
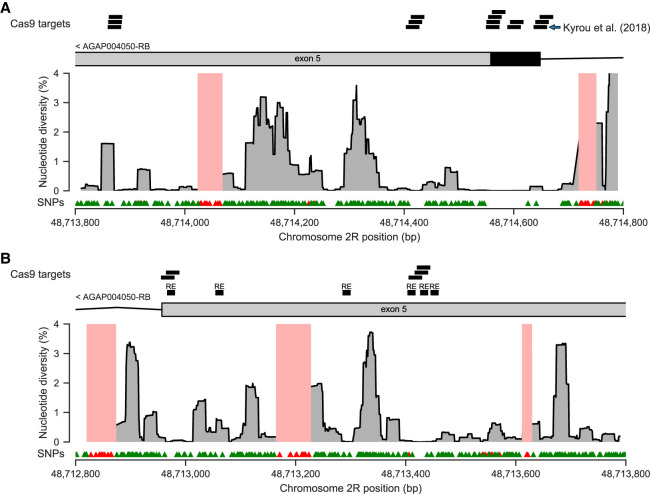
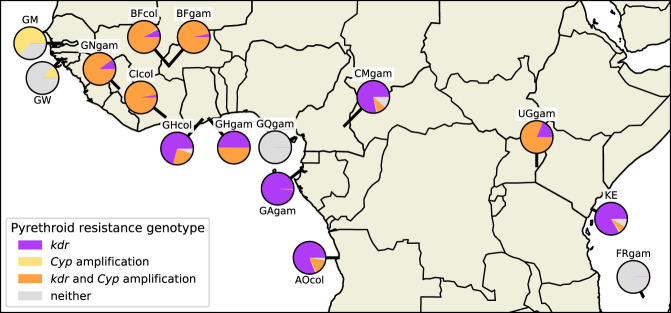
Mosquito control remains a central pillar of efforts to reduce malaria burden in sub-Saharan Africa. However, insecticide resistance is entrenched in malaria vector populations, and countries with a high malaria burden face a daunting challenge to sustain malaria control with a limited set of surveillance and intervention tools. Here we report on the second phase of a project to build an open resource of high-quality data on genome variation among natural populations of the major African malaria vector species Anopheles gambiae and Anopheles coluzzii We analyzed whole genomes of 1142 individual mosquitoes sampled from the wild in 13 African countries, as well as a further 234 individuals comprising parents and progeny of 11 laboratory crosses. The data resource includes high-confidence single-nucleotide polymorphism (SNP) calls at 57 million variable sites, genome-wide copy number variation (CNV) calls, and haplotypes phased at biallelic SNPs. We use these data to analyze genetic population structure and characterize genetic diversity within and between populations. We illustrate the utility of these data by investigating species differences in isolation by distance, genetic variation within proposed gene drive target sequences, and patterns of resistance to pyrethroid insecticides. This data resource provides a foundation for developing new operational systems for molecular surveillance and for accelerating research and development of new vector control tools. It also provides a unique resource for the study of population genomics and evolutionary biology in eukaryotic species with high levels of genetic diversity under strong anthropogenic evolutionary pressures.


Figures

Figure 1.
Figure 1.
Ag1000G phase 2 sampling locations. Color of circle denotes species, and area represents sample size. Species assignment is labeled as uncertain for samples from Guinea-Bissau, The Gambia, and Kenya because all individuals from those locations carry a mixture of A. gambiae and A. coluzzii ancestry informative markers (Supplemental Fig. S1). Map colors represent ecosystem classes; dark green designates forest ecosystems. For a compete color legend see Figure 9 in the work of Sayre (2013).
Figure 2.
Figure 2.
Population structure analysis of the wild-caught mosquitoes using UMAP (McInnes et al. 2018). Genotype data at biallelic SNPs from euchromatic regions of Chromosome 3 were projected onto two components. Each marker represents an individual mosquito. Mosquitoes from each country and species were randomly down-sampled to at most 50 individuals.
Figure 3.
Figure 3.
Comparison of isolation by distance between A. coluzzii and A. gambiae populations from locations in West and Central Africa north of the equatorial rainforest. (A) Study region and pairwise FST. (B) Regressions of average genome-wide FST against geographic distance, following the method of Rousset (1997). Neighborhood size is estimated as the inverse slope of the regression line. Goodness-of-fit is reported as R2. (C) Difference in neighborhood size estimates by species. Box plots show medians and 95% confidence intervals of the distribution of estimates calculated in 200-kbp windows across the euchromatic regions of Chromosome 3.
Figure 4.
Figure 4.
Genetic diversity within populations. (A) Nucleotide diversity (θπ) calculated in nonoverlapping 20-kbp genomic windows using SNPs from euchromatic regions of Chromosome 3. (B) Tajima's D calculated in nonoverlapping 20-kbp genomic windows using SNPs from euchromatic regions of Chromosome 3. (C) Runs of homozygosity (ROH) in individual mosquitoes. Each marker represents an individual mosquito. (D) Runs of identity by descent (IBD) between individuals. Each marker represents a pair of individuals drawn from the same population.
Figure 5.
Figure 5.
Nucleotide diversity within the female-specific exon 5 of the doublesex gene (dsx; AGAP004050), a key component of the sex determination pathway and a gene targeted for Cas9-based homing endonuclease gene drive (Kyrou et al. 2018). In both plots, the location of exon 5 within the female-specific isoform (AGAP004050-RB; AgamP4.12 gene set) is shown above (black indicates coding sequence; gray, untranslated region), with additional annotations above to show the location of Cas9 target sequences containing at most one SNP, and the putative exon splice enhancing sequences (“RE”) reported by Scali et al. (2005). The main region of the plot shows nucleotide diversity averaged across all Ag1000G phase 2 populations, computed in 23-bp moving windows. Regions shaded pale red indicate regions not accessible to SNP calling. Triangle markers below show the locations of SNPs discovered in Ag1000G phase 2 (green indicates passed variant filters; red, failed variant filters). (A) exon5/intron4 boundary. (B) exon5/intron6 boundary.
Figure 6.
Figure 6.
Pyrethroid-resistance genotype frequencies. The geographical distribution of pyrethroid insecticide–resistance genotypes are shown by population. Pie chart colors represent resistance genotype frequencies: purple, these individuals were either homozygous or heterozygous for one of the two kdr pyrethroid target site resistance alleles Vgsc-L995F/S; yellow, these individuals carried a copy number amplification within any of the Cyp6p/aa, Cyp6m, Cyp6z, or Cyp9k gene clusters but no kdr alleles; orange, these individuals carried at least one kdr allele and one Cyp gene amplification; and gray, these individuals carried no known pyrethroid-resistance alleles (no kdr alleles or Cyp amplifications). The Guinea A. coluzzii population is omitted owing to small sample size.

References

    1. The 1000 Genomes Project Consortium. 2015. A global reference for human genetic variation. Nature 526: 68–74. 10.1038/nature15393 - DOI - PMC - PubMed
    1. Adolfi A, Poulton B, Anthousi A, Macilwee S, Ranson H, Lycett GJ. 2019. Functional genetic validation of key genes conferring insecticide resistance in the major African malaria vector, Anopheles gambiae. Proc Natl Acad Sci. 116: 25764–25772. 10.1073/pnas.1914633116 - DOI - PMC - PubMed
    1. Al-Asadi H, Petkova D, Stephens M, Novembre J. 2019. Estimating recent migration and population-size surfaces. PLoS Genet 15: e1007908 10.1371/journal.pgen.1007908 - DOI - PMC - PubMed
    1. The Anopheles gambiae 1000 Genomes Consortium. 2017. Genetic diversity of the African malaria vector Anopheles gambiae. Nature 552: 96–100. 10.1038/nature24995 - DOI - PMC - PubMed
    1. Bergey CM, Lukindu M, Wiltshire RM, Fontaine MC, Kayondo JK, Besansky NJ. 2020. Assessing connectivity despite high diversity in island populations of a malaria mosquito. Evol Appl 13: 417–431. 10.1111/eva.12878 - DOI - PMC - PubMed

Publication types

LinkOut - more resources