

Starch as a major integrator in the regulation of plant growth
- PMID: 19506259
- PMCID: PMC2693182
- DOI: 10.1073/pnas.0903478106
Starch as a major integrator in the regulation of plant growth
Abstract
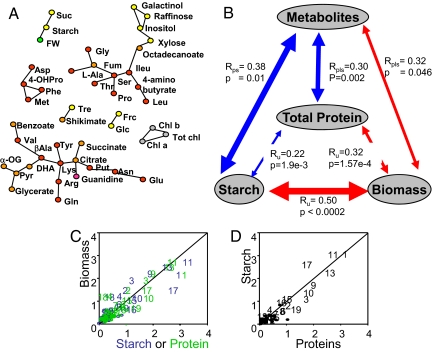
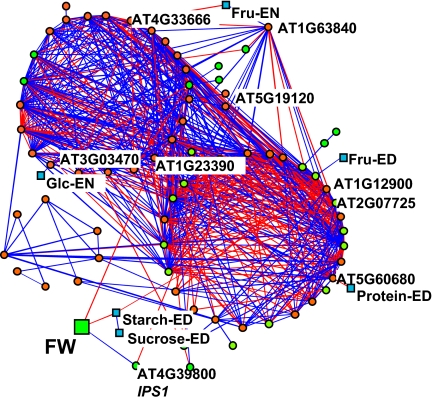
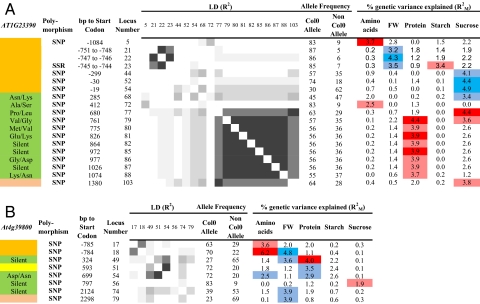
Rising demand for food and bioenergy makes it imperative to breed for increased crop yield. Vegetative plant growth could be driven by resource acquisition or developmental programs. Metabolite profiling in 94 Arabidopsis accessions revealed that biomass correlates negatively with many metabolites, especially starch. Starch accumulates in the light and is degraded at night to provide a sustained supply of carbon for growth. Multivariate analysis revealed that starch is an integrator of the overall metabolic response. We hypothesized that this reflects variation in a regulatory network that balances growth with the carbon supply. Transcript profiling in 21 accessions revealed coordinated changes of transcripts of more than 70 carbon-regulated genes and identified 2 genes (myo-inositol-1-phosphate synthase, a Kelch-domain protein) whose transcripts correlate with biomass. The impact of allelic variation at these 2 loci was shown by association mapping, identifying them as candidate lead genes with the potential to increase biomass production.
Conflict of interest statement
The authors declare no conflict of interest.
Figures
References
-
- Rogers A, Ainsworth EA. In: Managed Ecosystems and CO2, Case studies, Processes and Perspectives. Nösberger J, editor. Berlin: Springer Verlag; 2006.
-
- Schauer N, et al. Comprehensive metabolic profiling and phenotyping of interspecific introgression lines for tomato improvement. Nat Biotechnol. 2006;24:447–454. - PubMed
-
- Schurr U, Walter A, Rascher U. Functional dynamics of plant growth and photosynthesis — from steady-state to dynamics — from homogeneity to heterogeneity. Plant Cell Environ. 2006;29:340–352. - PubMed
Publication types
MeSH terms
Substances
Associated data
- Actions
- Actions
- Actions
- Actions
- Actions
- Actions
- Actions
- Actions
- Actions
- Actions
- Actions
- Actions
- Actions
- Actions
- Actions
- Actions
- Actions
- Actions
- Actions
- Actions
- Actions
- Actions
- Actions
- Actions
- Actions
- Actions
- Actions
- Actions
- Actions
- Actions
- Actions
- Actions
- Actions
- Actions
- Actions
- Actions
- Actions
- Actions
- Actions
- Actions
- Actions
- Actions
- Actions
- Actions
- Actions
- Actions
- Actions
- Actions
- Actions
- Actions
- Actions
- Actions
- Actions
- Actions
- Actions
- Actions
- Actions
- Actions
- Actions
- Actions
- Actions
- Actions
- Actions
- Actions
- Actions
- Actions
- Actions
- Actions
- Actions
- Actions
- Actions
- Actions
- Actions
- Actions
- Actions
- Actions
- Actions
- Actions
- Actions
- Actions
- Actions
- Actions
- Actions
- Actions
- Actions
- Actions
- Actions
- Actions
- Actions
- Actions
- Actions
- Actions
- Actions
- Actions
- Actions
- Actions
- Actions
- Actions
- Actions
- Actions
- Actions
- Actions
- Actions
- Actions
- Actions
- Actions
- Actions
- Actions
- Actions
- Actions
- Actions
- Actions
- Actions
- Actions
- Actions
- Actions
- Actions
- Actions
- Actions
- Actions
- Actions
- Actions
- Actions
- Actions
- Actions
- Actions
- Actions
- Actions
- Actions
- Actions
- Actions
- Actions
- Actions
- Actions
- Actions
- Actions
- Actions
- Actions
- Actions
- Actions
- Actions
- Actions
- Actions
- Actions
- Actions
- Actions
- Actions
- Actions
- Actions
- Actions
- Actions
- Actions
- Actions
- Actions
- Actions
- Actions
- Actions
- Actions
- Actions
- Actions
- Actions
- Actions
- Actions
- Actions
- Actions
- Actions
- Actions
- Actions
- Actions
- Actions
- Actions
- Actions
- Actions
- Actions
- Actions
- Actions
- Actions
- Actions
- Actions
- Actions
- Actions
- Actions
- Actions
- Actions
LinkOut - more resources
Full Text Sources
Other Literature Sources
