

doi: 10.1128/AEM.00261-12.
Epub 2012 Jun 29.
Methane-cycling microbial communities and methane emission in natural and restored peatlands
Affiliations
- PMID: 22752167
- PMCID: PMC3416597
- DOI: 10.1128/AEM.00261-12
Item in Clipboard
Methane-cycling microbial communities and methane emission in natural and restored peatlands
Appl Environ Microbiol.
2012 Sep.
Abstract
We addressed how restoration of forestry-drained peatlands affects CH(4)-cycling microbes. Despite similar community compositions, the abundance of methanogens and methanotrophs was lower in restored than in natural sites and correlated with CH(4) emission. Poor establishment of methanogens may thus explain low CH(4) emissions on restored peatlands even 10 to 12 years after restoration.
Figures
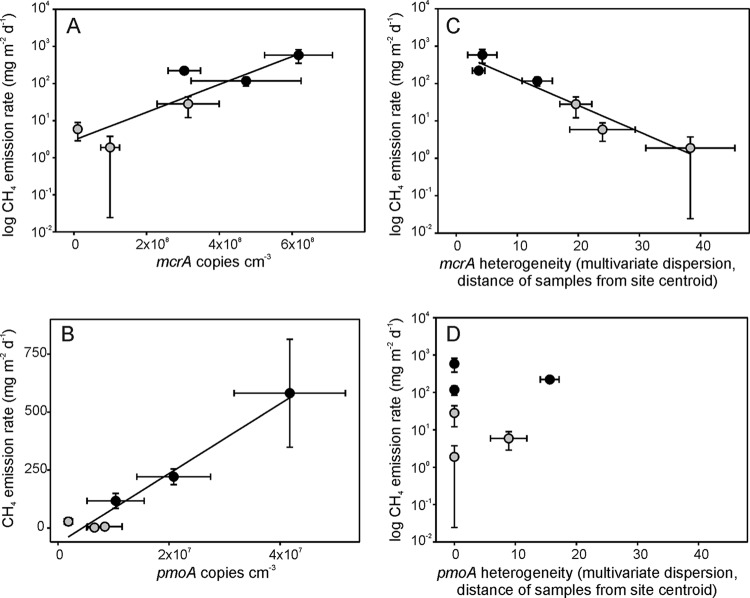
Abundance (A and B) and within-site community heterogeneity (C and D) of methanogens (mcrA) and methanotrophs (pmoA) in six peatlands in relation to CH4 emission rate at the time of sampling. Black symbols represent natural sites, and gray symbols represent restored sites. Each data point represents the average of 7 or 8 field replicates ± standard error (SE). Microbial abundance was measured by quantitative PCR (gene copies cm−3 peat). Community heterogeneity was determined as multivariate dispersion based on T-RFLP or DGGE fingerprints. Note the logarithmic scale on the y axis in panels A, C, and D. The regression line is shown for data sets with significant relationships.
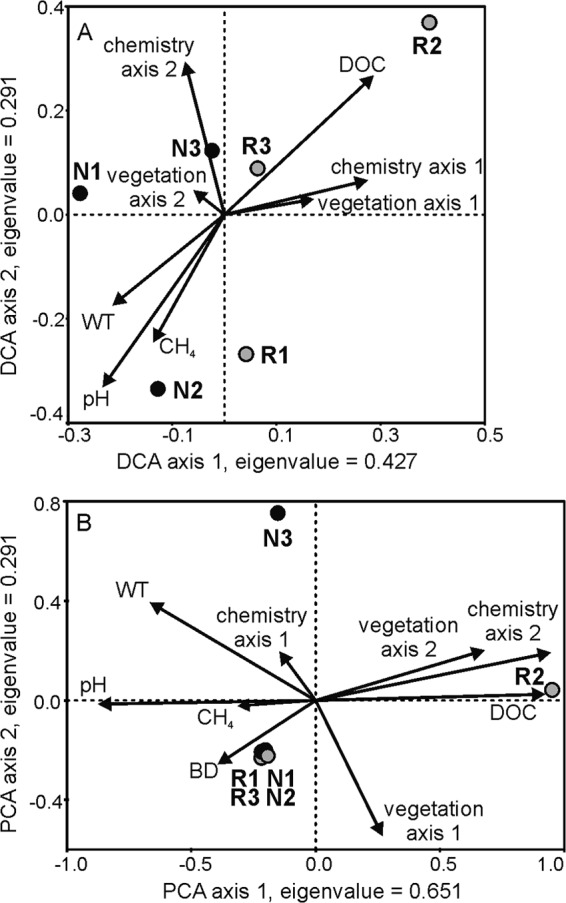
(A) Detrended correspondence analysis (DCA) of methanogen communities and (B) principal component analysis (PCA) of methanotroph communities in natural (N1 to N3) and restored (R1 to R3) peatlands (n = 7 to 8; only the site centroid is shown). The first two axes accounted for 42% (methanogens) and 87% (methanotrophs) of community variation. Communities were analyzed by mcrA T-RFLP and pmoA DGGE of peat samples. Arrows represent environmental variables. WT, water table level; DOC, dissolved organic carbon; CH4, mean emission rate for the growing season. Vegetation axis 1 refers to DCA axis 1 (wet-dry gradient) and vegetation axis 2 to DCA axis 2 (variation between restored sites related to plant species benefitting from disturbance) in Fig. S1 in the supplemental material. Chemistry axes 1 and 2 refer to PCA axes in Fig. S1C for methanogens and Fig. S1B for methanotrophs.
References
-
- Andersen R, Francez AJ, Rochefort L. 2006. The physicochemical and microbiological status of a restored bog in Québec: identification of relevant criteria to monitor success. Soil Biol. Biochem. 38: 1375–1387
-
- Andersen R, Grasset L, Thormann MN, Rochefort L, Francez A. 2010. Changes in microbial community structure and function following Sphagnum peatland restoration. Soil Biol. Biochem. 42: 291–301
-
- Anderson MJ. 2006. Distance-based tests for homogeneity of multivariate dispersions. Biometrics 62: 245–253 - PubMed
-
- Basiliko N, Blodau C, Roehm C, Bengtson P, Moore TR. 2007. Regulation of decomposition and methane dynamics across natural, commercially mined, and restored northern peatlands. Ecosystems 10: 1148–1165
-
- Chen Y, et al. 2008. Diversity of the active methanotrophic community in acidic peatlands as assessed by mRNA and SIP-PLFA analyses. Environ. Microbiol. 10: 446–459 - PubMed
Publication types
MeSH terms
Substances
Associated data
- Actions
- Actions
- Actions
- Actions
- Actions
- Actions
- Actions
- Actions
- Actions
- Actions
- Actions
- Actions
- Actions
- Actions
- Actions
- Actions
- Actions
- Actions
- Actions
- Actions
- Actions
- Actions
- Actions
- Actions
- Actions
- Actions
- Actions
- Actions
- Actions
- Actions
- Actions
- Actions
- Actions
- Actions
- Actions
- Actions
- Actions
- Actions
- Actions
- Actions
- Actions
- Actions
- Actions
- Actions
- Actions
- Actions
- Actions
- Actions
- Actions
- Actions
- Actions
- Actions
- Actions
- Actions
- Actions
- Actions
- Actions
- Actions
LinkOut - more resources
Full Text Sources
