

Analysis of structure and composition of bacterial core communities in mature drinking water biofilms and bulk water of a citywide network in Germany
- PMID: 22389373
- PMCID: PMC3346358
- DOI: 10.1128/AEM.06373-11
Analysis of structure and composition of bacterial core communities in mature drinking water biofilms and bulk water of a citywide network in Germany
Abstract
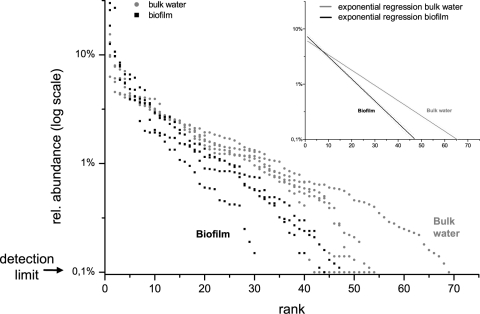
The bacterial core communities of bulk water and corresponding biofilms of a more than 20-year-old drinking water network were compared using 16S rRNA single-strand confirmation polymorphism (SSCP) fingerprints based on extracted DNA and RNA. The structure and composition of the bacterial core community in the bulk water was highly similar (>70%) across the city of Braunschweig, Germany, whereas all biofilm samples contained a unique community with no overlapping phylotypes from bulk water. Biofilm samples consisted mainly of Alphaproteobacteria (26% of all phylotypes), Gammaproteobacteria (11%), candidate division TM6 (11%), Chlamydiales (9%), and Betaproteobacteria (9%). The bulk water community consisted primarily of Bacteroidetes (25%), Betaproteobacteria (20%), Actinobacteria (16%), and Alphaproteobacteria (11%). All biofilm communities showed higher relative abundances of single phylotypes and a reduced richness compared to bulk water. Only biofilm communities sampled at nearby sampling points showed similar communities irrespective of support materials. In all of our bulk water studies, the community composition determined from 16S rRNA was completely different from the 16S rRNA gene-based community composition, whereas in biofilms both molecular fractions resulted in community compositions that were similar to each other. We hypothesize that a higher fraction of active bacterial phylotypes and a better protection from oxidative stress in drinking water biofilms are responsible for this higher similarity.
Figures


References
-
- Altschul SF, Gish W, Miller W, Myers EW, Lipman DJ. 1990. Basic local alignment search tool. J. Mol. Biol. 215:403–410 - PubMed
-
- Bassam BJ, Caetano-Anollés G, Gresshoff PM. 1991. Fast and sensitive silver staining of DNA in polyacrylamide gels. Anal. Biochem. 196:80–83 - PubMed
-
- Batté M, et al. 2003. Biofilms in drinking water distribution systems. Rev. Environ. Sci. Biotechnol. 2:147–168
-
- Berry D, Xi C, Raskin L. 2006. Microbial ecology of drinking water distribution systems. Curr. Opin. Biotechnol. 17:297–302 - PubMed
Publication types
MeSH terms
Substances
Associated data
- Actions
- Actions
- Actions
- Actions
- Actions
- Actions
- Actions
- Actions
- Actions
- Actions
- Actions
- Actions
- Actions
- Actions
- Actions
- Actions
- Actions
- Actions
- Actions
- Actions
- Actions
- Actions
- Actions
- Actions
- Actions
- Actions
- Actions
- Actions
- Actions
- Actions
- Actions
- Actions
- Actions
- Actions
- Actions
- Actions
- Actions
- Actions
- Actions
- Actions
- Actions
- Actions
- Actions
- Actions
- Actions
- Actions
- Actions
- Actions
- Actions
- Actions
- Actions
- Actions
- Actions
- Actions
- Actions
- Actions
- Actions
- Actions
- Actions
- Actions
- Actions
- Actions
- Actions
- Actions
- Actions
- Actions
- Actions
- Actions
- Actions
- Actions
- Actions
- Actions
- Actions
- Actions
- Actions
- Actions
- Actions
- Actions
- Actions
- Actions
- Actions
- Actions
- Actions
- Actions
- Actions
- Actions
- Actions
- Actions
- Actions
- Actions
- Actions
- Actions
- Actions
- Actions
- Actions
- Actions
- Actions
- Actions
- Actions
- Actions
- Actions
- Actions
- Actions
- Actions
- Actions
- Actions
- Actions
- Actions
- Actions
- Actions
- Actions
- Actions
- Actions
- Actions
- Actions
- Actions
- Actions
- Actions
- Actions
- Actions
- Actions
- Actions
- Actions
- Actions
- Actions
- Actions
- Actions
- Actions
- Actions
- Actions
- Actions
- Actions
- Actions
- Actions
- Actions
- Actions
- Actions
- Actions
- Actions
- Actions
- Actions
- Actions
- Actions
- Actions
- Actions
- Actions
- Actions
- Actions
- Actions
- Actions
- Actions
- Actions
- Actions
- Actions
- Actions
- Actions
LinkOut - more resources
Full Text Sources
Medical
Molecular Biology Databases
