. 2018 Jan 19:8:2002.
doi: 10.3389/fimmu.2017.02002. eCollection 2017.

B and T Cell Phenotypic Profiles of African HIV-Infected and HIV-Exposed Uninfected Infants: Associations with Antibody Responses to the Pentavalent Rotavirus Vaccine

Collaborators, Affiliations

B and T Cell Phenotypic Profiles of African HIV-Infected and HIV-Exposed Uninfected Infants: Associations with Antibody Responses to the Pentavalent Rotavirus Vaccine

Adriana Weinberg et al. Front Immunol. .

Abstract

We examined associations between B and T cell phenotypic profiles and antibody responses to the pentavalent rotavirus vaccine (RV5) in perinatally HIV-infected (PHIV) infants on antiretroviral therapy and in HIV-exposed uninfected (PHEU) infants enrolled in International Maternal Pediatric Adolescent AIDS Clinical Trials P1072 study (NCT00880698). Of 17 B and T cell subsets analyzed, PHIV and PHEU differed only in the number of CD4+ T cells and frequency of naive B cells, which were higher in PHEU than in PHIV. In contrast, the B and T cell phenotypic profiles of PHIV and PHEU markedly differed from those of geographically matched contemporary HIV-unexposed infants. The frequency of regulatory T and B cells (Treg, Breg) of PHIV and PHEU displayed two patterns of associations: FOXP3+ CD25+ Treg positively correlated with CD4+ T cell numbers; while TGFβ+ Treg and IL10+ Treg and Breg positively correlated with the frequencies of inflammatory and activated T cells. Moreover, the frequencies of activated and inflammatory T cells of PHIV and PHEU positively correlated with the frequency of immature B cells. Correlations were not affected by HIV status and persisted over time. PHIV and PHEU antibody responses to RV5 positively correlated with CD4+ T cell counts and negatively with the proportion of immature B cells, similarly to what has been previously described in chronic HIV infection. Unique to PHIV and PHEU, anti-RV5 antibodies positively correlated with CD4+/CD8+FOXP3+CD25+% and negatively with CD4+IL10+% Tregs. In conclusion, PHEU shared with PHIV abnormal B and T cell phenotypic profiles. PHIV and PHEU antibody responses to RV5 were modulated by typical HIV-associated immune response modifiers except for the association between CD4+/CD8+FOXP3+CD25+Treg and increased antibody production.

Keywords: AIDS; B cells; T cells; antibodies; human; vaccination.


Figures
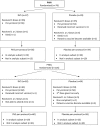
Figure 1
Figure 1
Consort diagram of the parent study.
Figure 2
Figure 2
Correlations of B and T cell phenotypic profiles with select demographic and HIV disease characteristics. Data derived from 47 perinatally HIV-infected infants and 42 perinatally HIV-exposed uninfected infants are displayed as a heatmap based on Spearman correlations. Lymphocyte phenotypes are indicated on the y axis and demographic and HIV disease characteristics on the x axis. Heatmap color legend corresponding to the correlation coefficients is presented on the right side of the graph. The numbers inside the squares indicate coefficients of correlation (p-values). Numbers are shown only for correlations with p < 0.10.
Figure 3
Figure 3
Correlations of B and T cell subsets in perinatally HIV-infected (PHIV) and perinatally HIV-exposed uninfected (PHEU) infants. Data derived from 47 PHIV and 42 PHEU are displayed as a heatmap based on Spearman correlations. Lymphocyte phenotypes are indicated on the x and y axes. Heatmap color legend corresponding to the correlation coefficients is presented on the right side of the graph. The numbers inside the squares indicate coefficients of correlation. Numbers are shown only for correlations with p < 0.10. Panel (A) shows data at study entry and panel (B) shows data over the entire study period represented by the area under the concentration time curve.
Figure 3
Figure 3
Correlations of B and T cell subsets in perinatally HIV-infected (PHIV) and perinatally HIV-exposed uninfected (PHEU) infants. Data derived from 47 PHIV and 42 PHEU are displayed as a heatmap based on Spearman correlations. Lymphocyte phenotypes are indicated on the x and y axes. Heatmap color legend corresponding to the correlation coefficients is presented on the right side of the graph. The numbers inside the squares indicate coefficients of correlation. Numbers are shown only for correlations with p < 0.10. Panel (A) shows data at study entry and panel (B) shows data over the entire study period represented by the area under the concentration time curve.
Figure 4
Figure 4
Comparative kinetics of CD4+ IL10+ % in perinatally HIV-infected (PHIV) and perinatally HIV-exposed uninfected (PHEU) who did or did not receive pentavalent rotavirus vaccine (RV5). Data were derived from 19 PHEU who received RV5, 23 PHEU who received placebo, 23 PHIV who received RV5, and 24 PHIV who received placebo. Median CD4+ IL10+ % at each time point indicated on the x axis are connected by lines. The bars indicate the lower and upper quartiles. In contrast to all other groups, PHIV vaccinees had an increase of CD4+ IL10+ % Treg after each dose of vaccine (p = 0.01 using mixed models analysis).
Figure 5
Figure 5
Correlations of antibody responses to rotavirus vaccine (RV5) in perinatally HIV-infected (PHIV) and perinatally HIV-exposed uninfected (PHEU) with T and B cell subsets measured over the duration of the study by AUC. Data derived from 23 PHIV and 19 PHEU who received RV5 are displayed as a heatmap based on Spearman correlations. Lymphocyte phenotypes are indicated on the y axis and antibodies to RV5 on the x axis. Heatmap color legend corresponding to the correlation coefficients is presented on the right side of the graph. The numbers inside the squares indicate coefficients of correlation (p-values). Numbers are shown only for correlations with p < 0.10.

References

    1. Lederman MM, Funderburg NT, Sekaly RP, Klatt NR, Hunt PW. Residual immune dysregulation syndrome in treated HIV infection. Adv Immunol (2013) 119:51–83.10.1016/B978-0-12-407707-2.00002-3 - DOI - PMC - PubMed
    1. Valdez H, Connick E, Smith KY, Lederman MM, Bosch RJ, Kim RS, et al. Limited immune restoration after 3 years’ suppression of HIV-1 replication in patients with moderately advanced disease. AIDS (2002) 16(14):1859–66.10.1097/00002030-200209270-00002 - DOI - PubMed
    1. Gandhi RT, Spritzler J, Chan E, Asmuth DM, Rodriguez B, Merigan TC, et al. Effect of baseline- and treatment-related factors on immunologic recovery after initiation of antiretroviral therapy in HIV-1-positive subjects: results from ACTG 384. J Acquir Immune Defic Syndr (2006) 42(4):426–34.10.1097/01.qai.0000226789.51992.3f - DOI - PubMed
    1. Malaspina A, Moir S, Ho J, Wang W, Howell ML, O’Shea MA, et al. Appearance of immature/transitional B cells in HIV-infected individuals with advanced disease: correlation with increased IL-7. Proc Natl Acad Sci U S A (2006) 103(7):2262–7.10.1073/pnas.0511094103 - DOI - PMC - PubMed
    1. Moir S, Fauci AS. B cells in HIV infection and disease. Nat Rev Immunol (2009) 9(4):235–45.10.1038/nri2524 - DOI - PMC - PubMed