

Pulmonary and functional hallmarks after SARS-CoV-2 infection across three WHO severity level-groups: an observational study
- PMID: 40259977
- PMCID: PMC12010923
- DOI: 10.3389/fmed.2025.1561387
Pulmonary and functional hallmarks after SARS-CoV-2 infection across three WHO severity level-groups: an observational study
Abstract
Background: The manifestations of severe acute respiratory syndrome coronavirus 2 (SARS-CoV-2) infection range from flu-like symptoms to severe lung disease. The consequences of this inflammatory process impact overall function, which can be detected through both short- to long-term assessments. This study aimed to assess the pulmonary functional and structural characteristics of post-SARS-CoV-2 infection in patients with mild/moderate, severe, and critical clinical presentations.
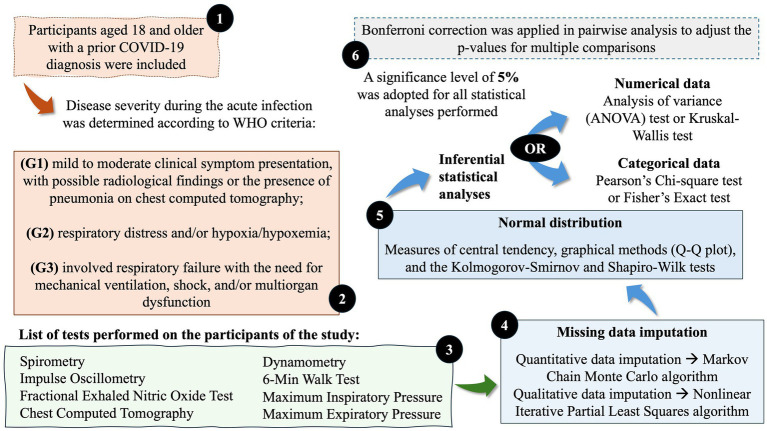
Methods: An observational, analytical, and cross-sectional study was conducted between 2020 and 2022, including participants with a confirmed diagnosis of coronavirus disease (COVID)-19, with mild/moderate (G1), severe (G2), and critical (G3) clinical presentations, all evaluated at least 3 months after acute infection. Spirometry, impulse oscillometry, fractional exhaled nitric oxide (FeNO), chest computed tomography, the 6-min walk test (6MWT), hand grip strength, maximum inspiratory pressure, and maximum expiratory pressure were assessed.
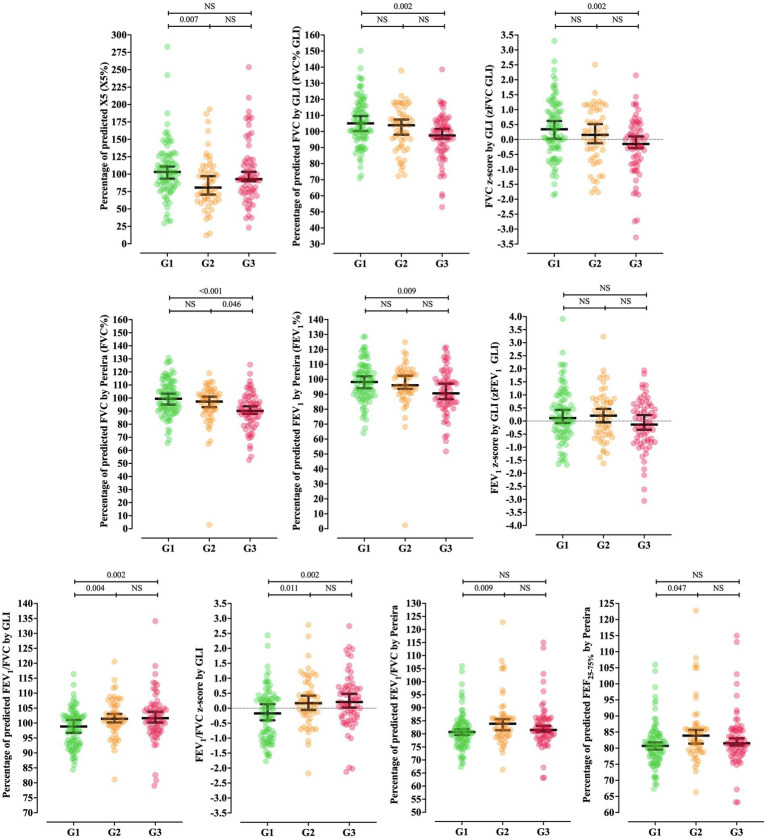
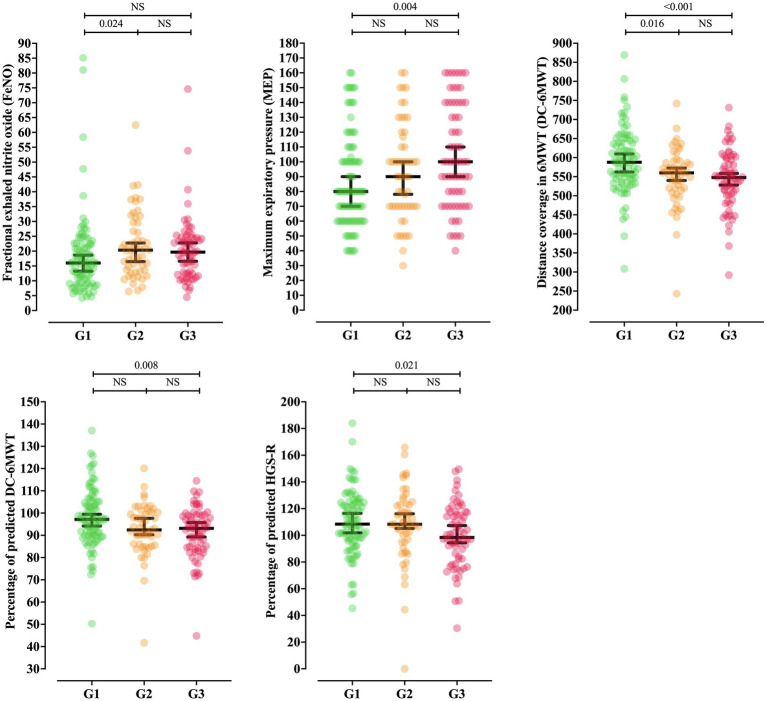
Results: We enrolled 210 participants aged 18-70 years, 32.6% of whom were male, with older age observed in G3. The participants were grouped as follows: G1 (42.3%), G2 (25.7%), and G3 (31.9%). Percentage of predicted X5 differed between G1 and G2, being higher in G1. The percentage of predicted forced vital capacity (FVC) according to the Global Lung Function Initiative and its z-score were higher in G1. The FVC by Pereira was lower in G3 compared to G1. The percentage of predicted forced expiratory volume in 1 s (FEV1) by Pereira was also lower in G3. The Tiffeneau (FEV1/FVC) index was different among groups, increasing with disease severity. The percentage of predicted forced expiratory flow rate at 25-75% (FEF25-75%) of the FVC and FeNO were both higher in G2 than G1. Chest computed tomography revealed the presence of interstitial abnormalities, associated with disease severity. The respiratory muscle strength evaluation showed an association between higher maximum expiratory pressure values in G3 compared to G1, but no association with maximum inspiratory pressure was observed. The 6MWT distance covered decreased with increasing severity, with a lower percentage of predicted values in G3 compared to G1. The right-hand grip strength was also lower in G3 compared to G1.
Conclusion: Alterations in pulmonary and functional markers were observed in post-COVID-19 evaluations, increasing with disease severity, as seen in G2 and G3. These findings highlight the complexity of post-COVID-19 functional assessments, given the long-term pulmonary sequelae and the consequent impairment of functional capacity.
Keywords: 6-min walk test; chest computed tomography; fractional exhaled nitric oxide; hand grip strength; impulse oscillometry; lung function; maximum expiratory pressure; maximum inspiratory pressure.
Copyright © 2025 Conti, Ribeiro, Gomez, Souza, Borgli, Sakano, Pascoa, Severino, Castilho, Marson, Ribeiro and UNICOVID Study Group.
Conflict of interest statement
The authors declare that the research was conducted in the absence of any commercial or financial relationships that could be construed as a potential conflict of interest.
Figures
Similar articles
-
[Standard technical specifications for methacholine chloride (Methacholine) bronchial challenge test (2023)].Zhonghua Jie He He Hu Xi Za Zhi. 2024 Feb 12;47(2):101-119. doi: 10.3760/cma.j.cn112147-20231019-00247. Zhonghua Jie He He Hu Xi Za Zhi. 2024. PMID: 38309959 Chinese.
-
Fractional exhaled nitric oxide in idiopathic pulmonary arterial hypertension and mixed connective tissue disease complicating pulmonary hypertension.BMC Pulm Med. 2024 Apr 23;24(1):199. doi: 10.1186/s12890-024-03004-x. BMC Pulm Med. 2024. PMID: 38654208 Free PMC article.
-
The long-term impact of COVID-19 pneumonia on pulmonary function and exercise capacity.J Thorac Dis. 2023 Sep 28;15(9):4725-4735. doi: 10.21037/jtd-23-514. Epub 2023 Aug 29. J Thorac Dis. 2023. PMID: 37868845 Free PMC article.
-
Severity of respiratory failure and computed chest tomography in acute COVID-19 correlates with pulmonary function and respiratory symptoms after infection with SARS-CoV-2: An observational longitudinal study over 12 months.Respir Med. 2022 Jan;191:106709. doi: 10.1016/j.rmed.2021.106709. Epub 2021 Dec 1. Respir Med. 2022. PMID: 34871947 Free PMC article.
-
Relationship between Fractional Exhaled Nitric Oxide Level and Efficacy of Inhaled Corticosteroid in Asthma-COPD Overlap Syndrome Patients with Different Disease Severity.J Korean Med Sci. 2017 Mar;32(3):439-447. doi: 10.3346/jkms.2017.32.3.439. J Korean Med Sci. 2017. PMID: 28145647 Free PMC article.
References
LinkOut - more resources
Full Text Sources
Miscellaneous