. 2008 May;5(5):409-15.
doi: 10.1038/nmeth.1199. Epub 2008 Apr 6.

BAC TransgeneOmics: a high-throughput method for exploration of protein function in mammals

Affiliations

BAC TransgeneOmics: a high-throughput method for exploration of protein function in mammals

Ina Poser et al. Nat Methods. 2008 May.

Erratum in

  • Nat Methods. 2008 Aug;5(8):748

Abstract

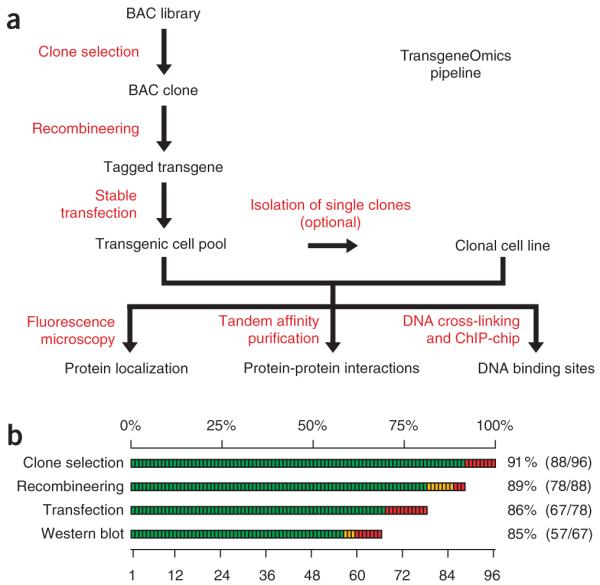
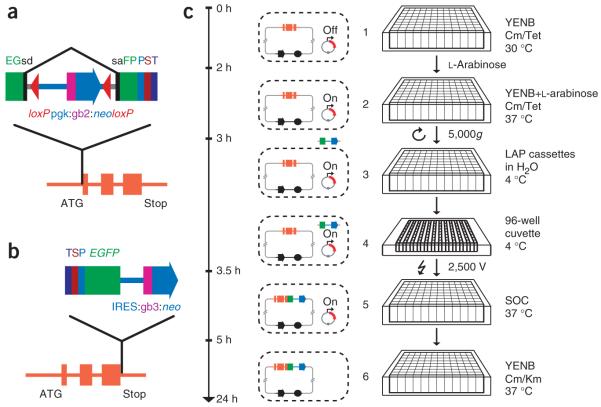
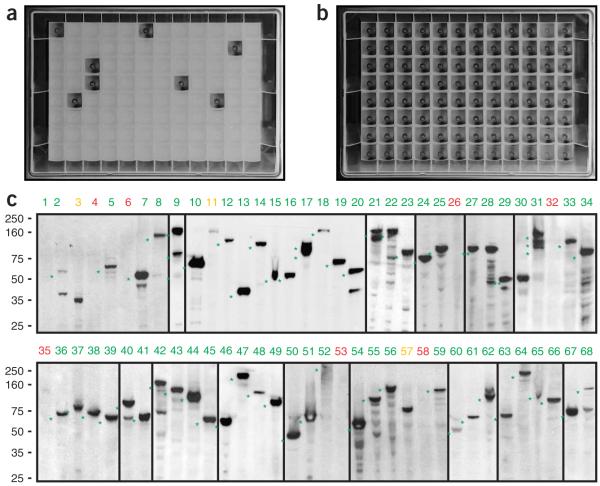
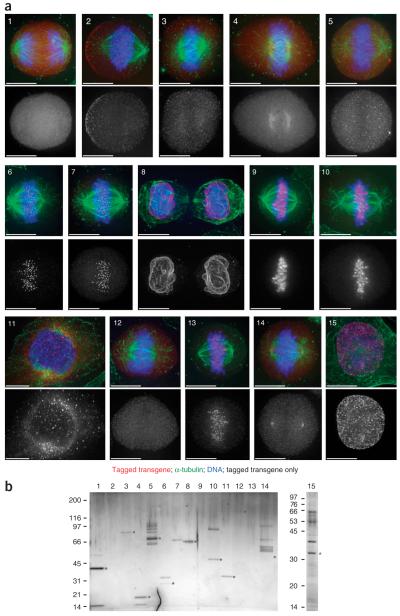
The interpretation of genome sequences requires reliable and standardized methods to assess protein function at high throughput. Here we describe a fast and reliable pipeline to study protein function in mammalian cells based on protein tagging in bacterial artificial chromosomes (BACs). The large size of the BAC transgenes ensures the presence of most, if not all, regulatory elements and results in expression that closely matches that of the endogenous gene. We show that BAC transgenes can be rapidly and reliably generated using 96-well-format recombineering. After stable transfection of these transgenes into human tissue culture cells or mouse embryonic stem cells, the localization, protein-protein and/or protein-DNA interactions of the tagged protein are studied using generic, tag-based assays. The same high-throughput approach will be generally applicable to other model systems.


Figures

Figure 1
Figure 1
BAC TransgeneOmics pipeline. (a) Flow chart of the pipeline. (b) Efficiency of the BAC TransgeneOmics pipeline, with a summary of the efficiency of each experimental step. Green bars represent successful steps, yellow partially verified steps, red failure.
Figure 2
Figure 2
Tagging cassettes and 96-well recombineering pipeline. (a,b) Tagging cassettes for C- and N-terminal end tagging. Schematic representation of a genomic region that contains the gene of interest (orange) and the cassettes for tagging at the N or C end. (a) In the N-terminal cassette, the neomycin-kanamycin resistance gene (neo) is placed inside an artificial intron flanked by loxP sites. (b) The C-terminal tag is inserted as a cassette with a neomycin resistance gene downstream of an internal ribosome entry site (IRES:neo). EGFP, enhanced green fluorescent protein; gb2, gb3, bacterial promoters; P, PreScission cleavage site; pgk, phosphoglycerate kinase (PGK) promoter; S, S-peptide; sa, splice acceptor; sd, splice donor; T, TEV cleavage site. (c) 96-well-format BAC recombineering, with actual time required for each experimental step shown. The cartoons at right represent the events that occur at the level of the individual bacterial cell along with the actual experimental manipulations. Bacterial cultures each containing a specific BAC clone and the pSC101gbaA plasmid are grown to early log phase at 30 °C (1). The temperature is shifted to 37 °C and expression of the proteins required for recombination is induced with l-arabinose (2). Cells are washed to remove the medium and the desalted tagging cassettes are electroporated (3,4). After recovery for 1 h (5), cells containing successfully recombined BACs are selected by overnight growth in the presence of kanamycin (6). Incubation at 37 °C also removes the recombination plasmid, which has the temperature-sensitive pSC101 origin of replication. Cm, chloramphenicol; SOC, rich medium for recovery after transformation; Tet, tetracyline; YENB, non-salt medium for electroporation.
Figure 3
Figure 3
Pipeline fidelity and efficiency. (a,b) Fidelity of 96-well recombineering. Typical results of a 96-well-format recombineering experiment are shown (a). In the control experiment (b), the plate was inverted so that the BAC and the targeting cassettes did not match, resulting in virtually no background growth and thereby indicating that growth in selective medium is only a result of the intended recombination event and does not occur from random cassette integration. (c) Western blot analysis of 67 transgenic cell pools using an antibody to GFP. Lane 1 represents a wild-type HeLa cell control. For 57 cell pools (marked in green), a band of the expected size was detected (marked with *). For three genes, the band pattern did not represent the expected size (marked in yellow: lanes 3, 11, 57). For seven of the pools, no western blot band was observed (marked in red). In lane 9 (mUBE1), three bands matching the size of the human splice forms were detected. Numbers at left indicate molecular masses in kDa. More information on the tagged genes can be found in Supplementary Table 1 online.
Figure 4
Figure 4
Localization and purification of tagged proteins. The evaluation of tag performance for protein localization and complex purification analyses is illustrated. The same 15 well-characterized genes were used for both assays (1, CDC2; 2, DYNC1H1; 3, DYNC1I1; 4, DYNLL1; 5, CDC23; 6, MIS12; 7, human MIS12; 8, TOR1AIP1; 9, INCENP; 10, AURKB; 11, Rab5C; 12, STAG2; 13, SGOL1; 14, TUBG1; 15, PCNA; all from mouse except as indicated). All genes were tagged at the C terminus; only Rab5C (11) was tagged at the N terminus. For further details, refer to Supplementary Table 2. (a) Localization. Localization of the tagged transgene with antibody to GFP is shown in red, that of antibody to α-tubulin in green and that of DNA in blue, localized with Hoechst 33342. Scale bars are 15 μm. Grayscale images show the GFP signal alone. (b) Purification. Silver-stained gel of the same 15 tagged proteins and their associated protein complexes is shown. Baits are marked with asterisks. Although some baits are barely visible, all of them were successfully identified by mass spectrometry (see Supplementary Table 2). Numbers at left indicate molecular masses in kDa.
Figure 5
Figure 5
Identification of DNA-binding sites by chromatin immunopurification. (a) VDR-LAP binding is enriched in the promoter regions of putative VDR target genes. The binding profiles around the genes TPX2, RG9MTD2 and CLCN3 are shown as examples. (b) Distribution of VDR binding sites proximal to transcription start sites (TSSs). Frequencies of VDR binding sites residing within the downstream 10-kb or upstream 10-kb genomic regions were plotted to their relative positions to annotated TSSs. (c,d) Direct comparison of binding profiles for ChIP-chip assays using specific antibodies against the endogenous transcription factors (FOXA1 or XBP1) and the LAP tag across 800-kb genomic regions in MCF7 cells. The y axes in a, c and d denote minus log P values for enrichment of ChIP relative to input. Negative and positive values on the x axis in b indicate VDR binding regions located 5′ or 3′ of neighboring TSSs, respectively.
Figure 6
Figure 6
Generation of BAC-transgenic mice using mouse ES cells stably expressing mouse PCNA-LAP. (a) Immunolocalization of PCNA-LAP in fixed mouse ES cells (E14TG2a). (b) Overlay of the GFP staining (red) with α-tubulin (green) and DNA (blue) staining. (c) GFP fluorescence in isolated embryo (13.5 d.p.c.) derived from mouse PCNA transgenic ES cells. (d,e) Mouse embryonic fibroblasts (MEFs), isolated from inner organs of GFP-positive embryos, showed strong punctuated nuclear staining in S phase (arrowheads). Shown are differential interference contrast (DIC; d) and merged GFP signal (e) of living MEFs.

Comment in

References

    1. Kittler R, et al. Genome-scale RNAi profiling of cell division in human tissue culture cells. Nat. Cell Biol. 2007;9:1401–1412. - PubMed
    1. Paddison PJ, et al. A resource for large-scale RNA-interference-based screens in mammals. Nature. 2004;428:427–431. - PubMed
    1. Kittler R, et al. An endoribonuclease-prepared siRNA screen in human cells identifies genes essential for cell division. Nature. 2004;432:1036–1040. - PubMed
    1. Gavin AC, et al. Proteome survey reveals modularity of the yeast cell machinery. Nature. 2006;440:631–636. - PubMed
    1. Gavin AC, et al. Functional organization of the yeast proteome by systematic analysis of protein complexes. Nature. 2002;415:141–147. - PubMed

Publication types

Associated data