. 2024 Oct 11;15(1):8805.
doi: 10.1038/s41467-024-53089-5.

Best practices for differential accessibility analysis in single-cell epigenomics

Affiliations

Best practices for differential accessibility analysis in single-cell epigenomics

Alan Yue Yang Teo et al. Nat Commun. .

Abstract

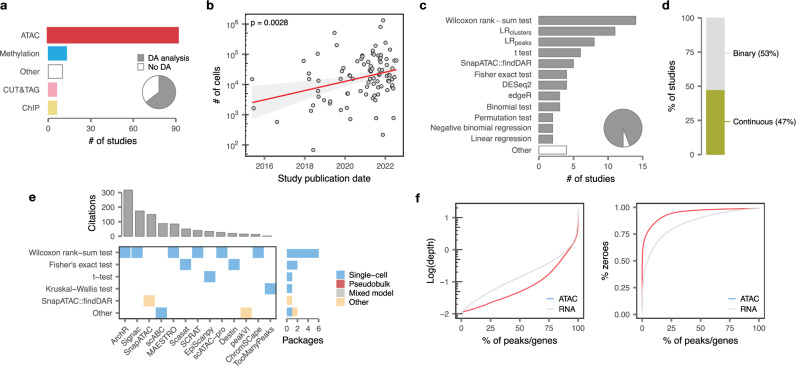
Differential accessibility (DA) analysis of single-cell epigenomics data enables the discovery of regulatory programs that establish cell type identity and steer responses to physiological and pathophysiological perturbations. While many statistical methods to identify DA regions have been developed, the principles that determine the performance of these methods remain unclear. As a result, there is no consensus on the most appropriate statistical methods for DA analysis of single-cell epigenomics data. Here, we present a systematic evaluation of statistical methods that have been applied to identify DA regions in single-cell ATAC-seq (scATAC-seq) data. We leverage a compendium of scATAC-seq experiments with matching bulk ATAC-seq or scRNA-seq in order to assess the accuracy, bias, robustness, and scalability of each statistical method. The structure of our experiments also provides the opportunity to define best practices for the analysis of scATAC-seq data beyond DA itself. We leverage this understanding to develop an R package implementing these best practices.


Conflict of interest statement

The authors declare no competing interests.

Figures

Fig. 1
Fig. 1. Landscape of DA analysis for single-cell epigenomics.
a Experimental techniques used in 118 primary publications that reported single-cell epigenomic datasets. Inset pie chart shows the proportion of studies (64%) that reported a DA analysis. b Number of single cells profiled by scATAC-seq in 91 primary studies, shown as a function of publication date to highlight exponential scaling of scATAC-seq over time. Trend line and inset p-value, linear regression; shaded area, 95% confidence interval. c Statistical methods for DA analysis employed in 118 single-cell epigenomics papers. DA methods shown in grey will be considered in our analysis. “Other” includes four additional methods used in just a single study. Inset pie chart shows the total proportion of single-cell epigenomics papers (94%) that employed a DA analysis method considered in this Registered Report. d Proportions of single-cell epigenomics studies that have treated the data as binary or continuous, respectively, during DA analysis. e Default statistical methods for DA analysis implemented in 13 single-cell analysis packages. Top, number of citations per package. Right, total number of analysis packages in which each DA analysis method is implemented as the default. f Cumulative distribution functions showing statistical properties of RNA-seq and ATAC-seq data from matching single cells. ATAC-seq features (peaks) are characterized by a lower average sequencing depth and a higher proportion of zeroes. Data is from a 10x multiome dataset from the mouse spinal cord (Methods). Source data are provided as a Source Data file (Source Data 1).
Fig. 2
Fig. 2. Evaluating single-cell DA methods with matched bulk data and single-cell multi-omics.
a Design of Experiment 1. DA analysis was performed between cell types or conditions for single-cell datasets with matching bulk ATAC-seq as a reference. Peaks were called either in the bulk ATAC-seq data (primary analysis) or in pseudobulk single-cell data (sensitivity) analysis). b Area under the concordance curve (AUCC) for single-cell DA methods in Experiment 1, using matching bulk ATAC-seq as a reference (n = 16 comparisons). Inset text shows the median AUCC. Methods that aggregate counts within replicates to form ‘pseudobulks’ are shown in shades of red; one method that aggregates counts across replicates is shown in green; and methods that do not aggregate information across cells are shown in blue. c Design of Experiment 2. DA analysis was performed between cell types using matched scRNA-seq data from the same cell as a reference, comparing DA of genomic intervals around the TSS to gene-level differential expression (n = 306 comparisons). d Area under the concordance curve (AUCC) for single-cell DA methods in Experiment 2, using matching snRNA-seq as a reference. Inset text shows the median AUCC. e As in d but showing concordance at the level of GO terms enriched among DA peaks. Source data are provided as a Source Data file (Source Data 2).
Fig. 3
Fig. 3. False discoveries in single-cell DA analysis.
a Schematic overview of Experiment 3.1. Bone marrow mononuclear cells from healthy donors were profiled by Luecken et al. in 13 independent replicates. For each cell type, half of these replicates were assigned to an artificial ‘control’ group, and the other half to an artificial ‘treatment’ group. DA analysis was then performed between cells from randomly assigned replicates. b Number of DA peaks detected between randomly assigned replicates at 5% FDR within each cell type in random comparisons of published scATAC-seq data (n = 21 comparisons). Inset text shows the median number of DA peaks per method. c As in b but showing the number of DA peaks detected at 5% FDR in DA analysis of downsampled bulk ATAC-seq libraries without biological differences between experimental conditions. d As in b but showing the number of DA peaks detected at 5% FDR in model-based simulations of scATAC-seq data without biological differences between experimental conditions. e As in b but showing the number of DA peaks detected at 5% FDR in model-based simulations of scATAC-seq data without biological differences between experimental conditions, with variation in sequencing depth between libraries. Source data are provided as a Source Data file (Source Data 3).
Fig. 4
Fig. 4. Biases in single-cell DA analysis.
a Mean read depth of the top-1000 DA peaks identified by each single-cell DA method in published scATAC-seq datasets (n = 16 comparisons). Inset text shows the median across comparisons. b As in a but showing the proportion of cells in which these peaks are open. c As in a but showing the width of each peak.
Fig. 5
Fig. 5. Impact of log-fold change filtering on single-cell DA analysis.
a Effect size (Cohen’s d) of increasingly stringent log-fold change filtering on the AUCC between single-cell and bulk ATAC-seq DA, relative to the removal of an equivalent number of peaks selected at random (n = 16 comparisons). Inset text shows the median Cohen’s d. b As in a but for the AUCC between the ATAC and RNA modalities of single-cell multi-omics data (n = 306 comparisons). c As in a but for the number of false discoveries in null comparisons of published scATAC-seq data (n = 21 comparisons).
Fig. 6
Fig. 6. Best practices for scATAC-seq analysis.
a Area under the concordance curve (AUCC) for single-cell DA methods using matching bulk ATAC-seq as a reference, before and after binarization (n = 16 comparisons). Inset text shows the median AUCC. b Number of DA peaks detected between randomly assigned replicates at 5% FDR in random comparisons of published scATAC-seq data, before and after binarization (n = 21 comparisons). Inset text shows the median number of DA peaks. c As in b but in downsampled bulk ATAC-seq libraries. d As in b but in model-based simulations of scATAC-seq data. e Mean read depth of the top-1000 DA peaks identified by each single-cell DA method in published scATAC-seq datasets, before and after binarization. Inset text shows the median. f As in e but showing the proportion of cells in which these peaks are open. g As in e but showing the width of each peak. h Effect size (Cohen’s d) of alternative approaches to normalization of scATAC-seq data on the AUCC between single-cell and bulk ATAC-seq DA, relative to log-TP10K normalization (n = 16 comparisons). i As in h but showing the number of DA peaks detected between randomly assigned replicates at 5% FDR in randomized comparisons of published scATAC-seq data (n = 21 comparisons). j As in i but in downsampled bulk ATAC-seq libraries. k As in i but in model-based simulations of scATAC-seq data. l As in h but showing the mean read depth of the top-1000 DA peaks identified by each single-cell DA method in published scATAC-seq datasets. m As in l but showing the proportion of cells in which these peaks are open. n As in l but showing the width of each peak. o Number of cells considered per comparison, before and after controlling for technical covariates using the ArchR background-matching procedure (n = 322 comparisons). Inset text shows the median. p Area under the concordance curve (AUCC) for single-cell DA methods using matching bulk ATAC-seq as a reference, before and after controlling for technical covariates using the ArchR background-matching procedure (n = 16 comparisons). q Effect size (Cohen’s d) of the ArchR background-matching procedure on the AUCC between single-cell and bulk ATAC-seq.
Fig. 7
Fig. 7. Data requirements for single-cell DA analysis.
a Effect size (Cohen’s d) of downsampling plate-based scATAC-seq data to a mean of 500, 1000, 2000, 5000 counts per cell on the AUCC for single-cell DA methods using matching bulk ATAC-seq as a reference, relative to DA analysis of the same datasets with a mean of 10,000 counts per cell (n = 16 comparisons). Inset text shows the median Cohen’s d. b Effect size (Cohen’s d) of downsampling single-cell multi-omics data to 20, 50, 100, 200, or 500 cells per condition on the AUCC between the ATAC and RNA modalities, relative to DA analysis of the same datasets with 1000 cells per condition (n = 306 comparisons). Inset text shows the median Cohen’s d.
Fig. 8
Fig. 8. Scalability of single-cell DA methods.
a Wall clock time required by each DA method to execute each comparison in Experiment 1 (n = 16 comparisons). Inset text shows the median runtime in minutes. b Peak memory usage of each DA method while executing each comparison in Experiment 1 (n = 16 comparisons). Inset text shows the median peak memory usage in GB. c As in a but for each comparison in Experiment 2 (n = 306 comparisons). d As in b but for each comparison in Experiment 2 (n = 306 comparisons). e Wall clock time required by alternative implementations of three DA methods (t-test, Wilcoxon rank-sum test, and negative binomial regression). Inset text shows the median runtime in minutes. ***p < 10–15, two-sided paired t-test. f As in e but showing peak memory usage by each alternative implementation. Inset text shows the median peak memory usage in GB. ***p < 10–15, two-sided paired t-test.
Fig. 9
Fig. 9. Summary of DA method performance across major evaluation criteria.
Methods were grouped into terciles of high, low, or intermediate performance on the basis of their quantitative performance on each task, as described in the Methods, and ranked by their average performance across all criteria.

References

    1. Carter, B. & Zhao, K. The epigenetic basis of cellular heterogeneity. Nat. Rev. Genet.22, 235–250 (2021). - PMC - PubMed
    1. Klemm, S. L., Shipony, Z. & Greenleaf, W. J. Chromatin accessibility and the regulatory epigenome. Nat. Rev. Genet.20, 207–220 (2019). - PubMed
    1. Hesselberth, J. R. et al. Global mapping of protein-DNA interactions in vivo by digital genomic footprinting. Nat. Methods6, 283–289 (2009). - PMC - PubMed
    1. Buenrostro, J. D., Giresi, P. G., Zaba, L. C., Chang, H. Y. & Greenleaf, W. J. Transposition of native chromatin for fast and sensitive epigenomic profiling of open chromatin, DNA-binding proteins and nucleosome position. Nat. Methods10, 1213–1218 (2013). - PMC - PubMed
    1. Graybuck, L. T. et al. Enhancer viruses for combinatorial cell-subclass-specific labeling. Neuron109, 1449–1464.e13 (2021). - PMC - PubMed

Publication types

MeSH terms

LinkOut - more resources