. 2008 Dec 9;14(6):435-46.
doi: 10.1016/j.ccr.2008.10.016.

HIF-alpha effects on c-Myc distinguish two subtypes of sporadic VHL-deficient clear cell renal carcinoma

Affiliations

HIF-alpha effects on c-Myc distinguish two subtypes of sporadic VHL-deficient clear cell renal carcinoma

John D Gordan et al. Cancer Cell. .

Abstract

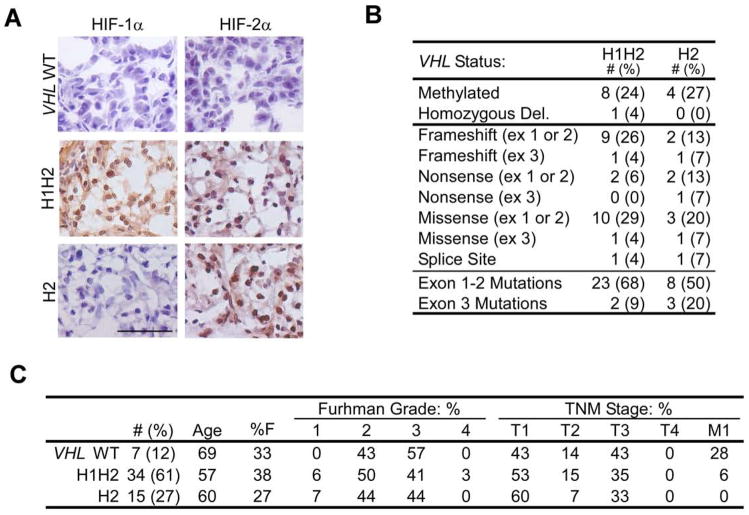
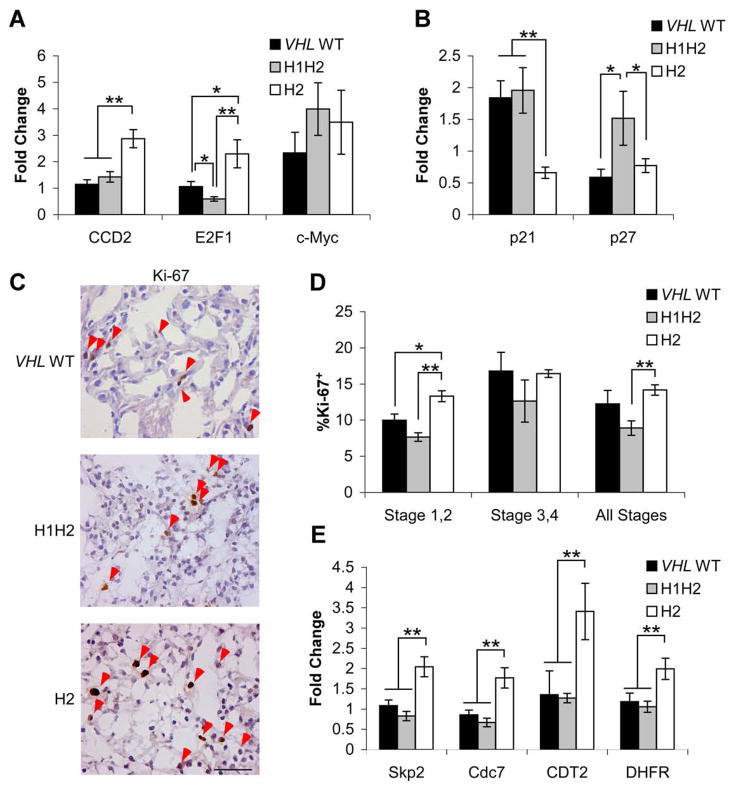
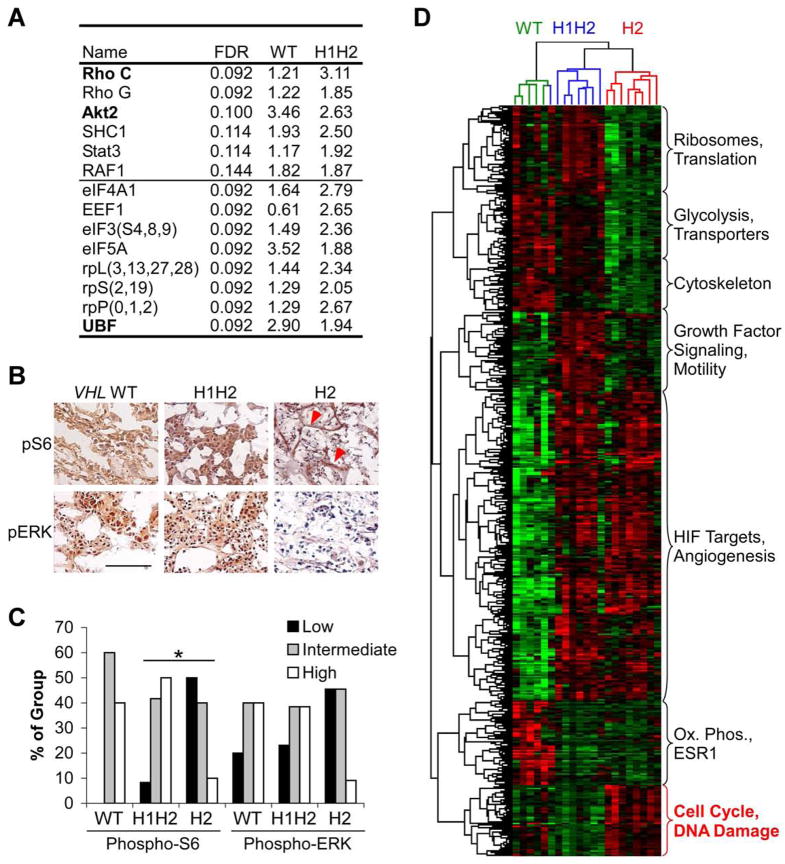
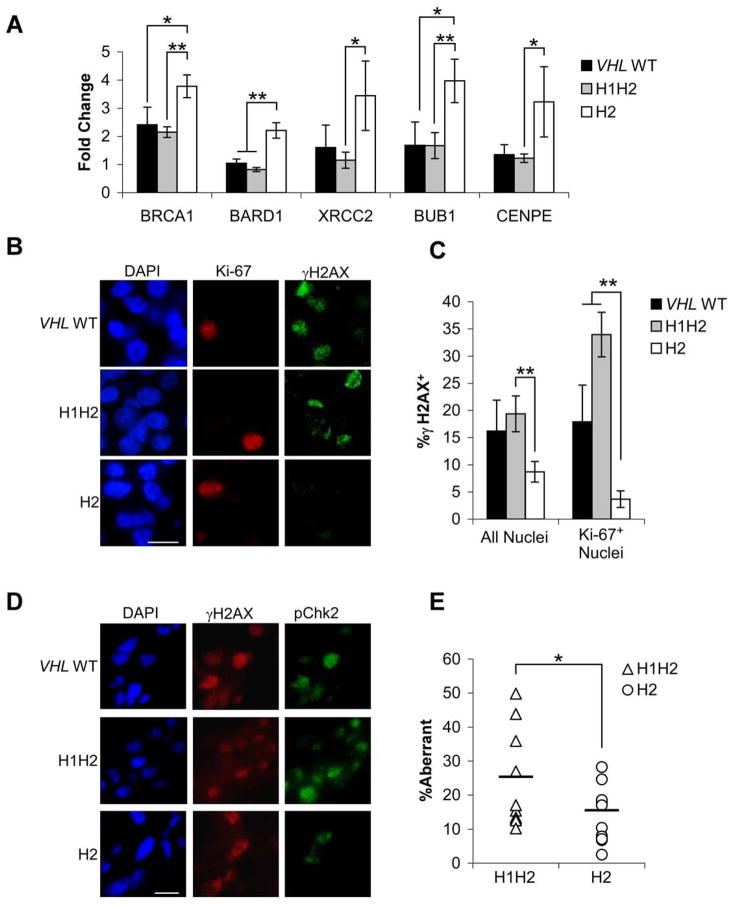
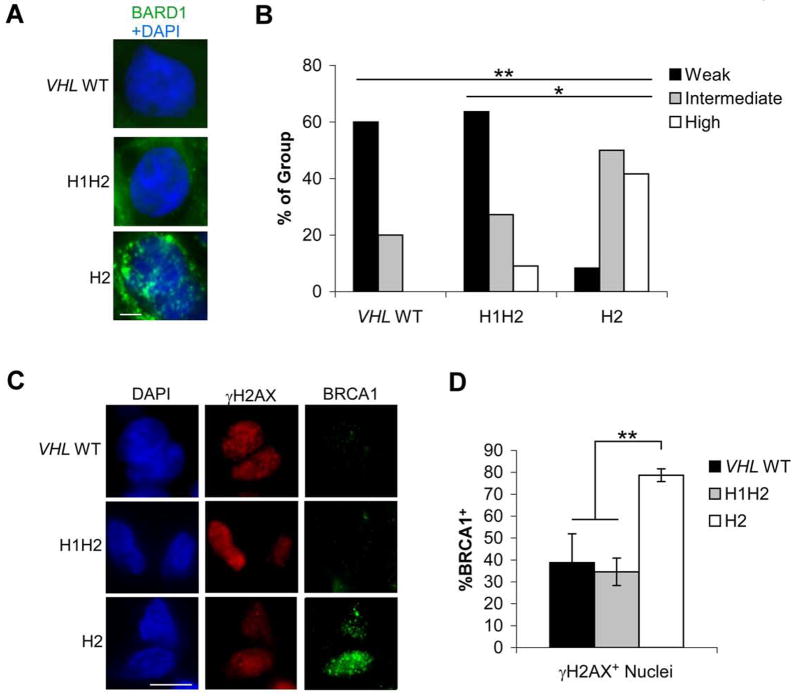
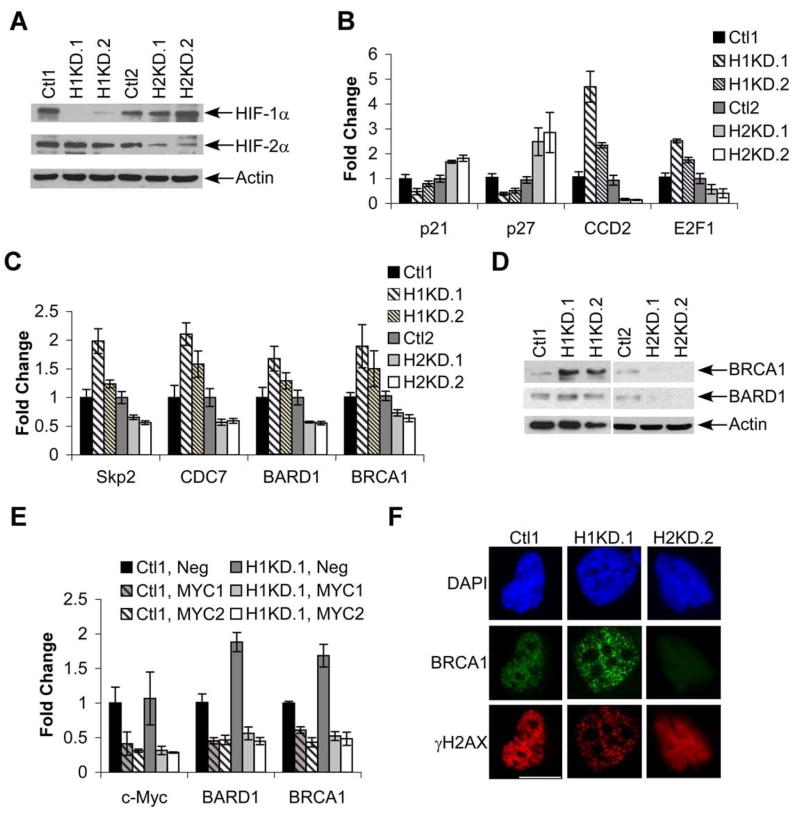
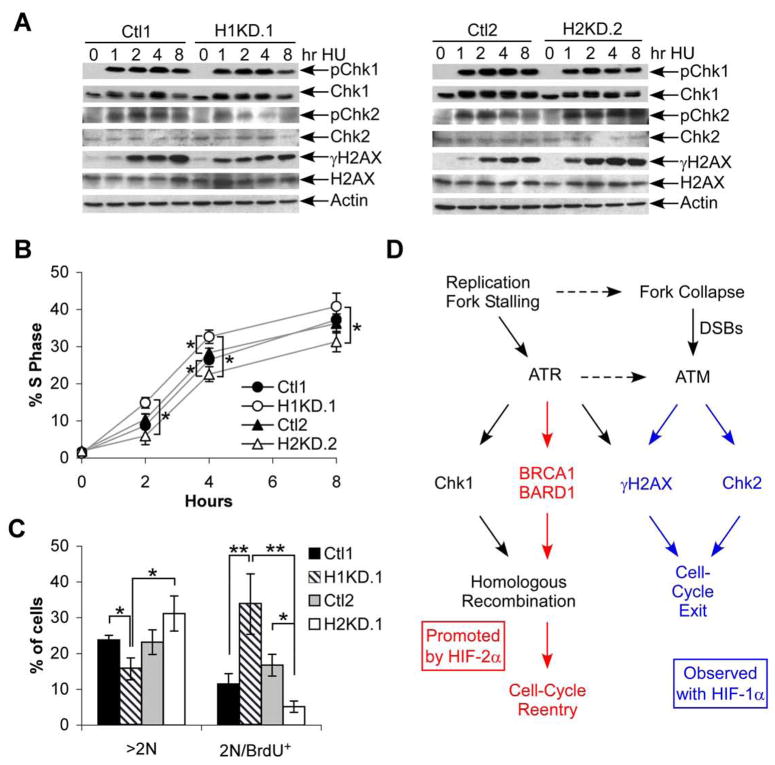
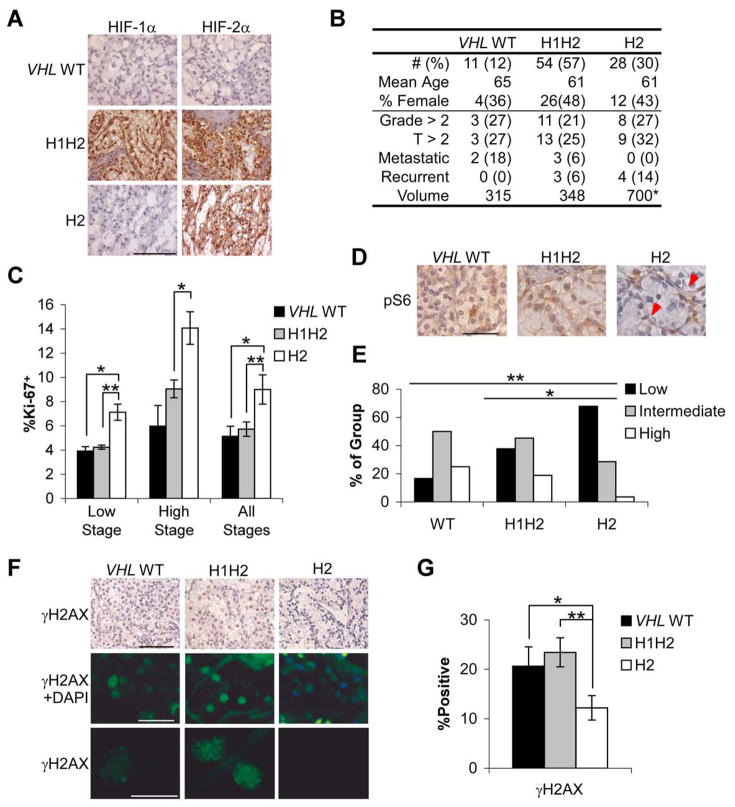
von Hippel-Lindau (VHL) tumor suppressor loss results in hypoxia-inducible factor alpha (HIF-alpha) stabilization and occurs in 70% of sporadic clear cell renal carcinomas (ccRCCs). To determine whether opposing influences of HIF-1alpha and HIF-2alpha on c-Myc activity regulate human ccRCC progression, we analyzed VHL genotype and HIF-alpha expression in 160 primary tumors, which segregated into three groups with distinct molecular characteristics. Interestingly, ccRCCs with intact VHL, as well as pVHL-deficient HIF-1alpha/HIF-2alpha-expressing ccRCCs, exhibited enhanced Akt/mTOR and ERK/MAPK signaling. In contrast, pVHL-deficient ccRCCs expressing only HIF-2alpha displayed elevated c-Myc activity, resulting in enhanced proliferation and resistance to replication stress. These reproducible distinctions in ccRCC behavior delineate HIF-alpha effects on c-Myc in vivo and suggest molecular criteria for selecting targeted therapies.


Figures

Figure 1
Figure 1. Categorization of ccRCCs by HIF-α expression and VHL status
A. Representative HIF-1α and HIF-2α staining of fresh frozen tumors categorized as VHL WT, H1H2 and H2. Scale bar is 1 μM. B. Summary of VHL disruption in H1H2 and H2 tumors. Mutations are separated into those occuring in the first two exons or the last. C. Summary of clinical parameters for each tumor group. In addition to summarized patient characteristics, histological grade by Fuhrman score and clinical stage by the American Joint Committee on Cancer Tumor Node Metastasis (TNM) system are shown. Tumors scored as T1 or T2 (confined to the kidney) were considered low stage, while T3, T4, and M1 (invasive or metastatic tumors) were considered advanced.
Figure 2
Figure 2. Upregulation of c-Myc cell cycle targets and proliferation in H2 tumors
A. Expression of c-Myc and c-Myc activated targets measured by QRT-PCR. Cyclin D2, E2F1 and c-Myc in VHL WT (n=5), H1H2 (n=8) and H2 (n=8) tumors. Data are shown as a fold change relative to pooled normal renal epithelium, ±1 SEM. * p<.05, **p<.01. c-Myc expression was tested with two independent primer sets, as it showed a trend towards upregulation (FDR =.2) in VHL-deficient vs. VHL WT tumors by microarray analysis. c-Myc expression was highly variable within tumor groups, and not found significant by QRT-PCR (p>.25). B. Expression of c-Myc repressed targets p21 and p27, shown as in part A. C. Representative Ki-67 staining in fresh frozen tumors, with positive nuclei indicated with red arrows. Scale bar is 0.5 μM. D. Summary of Ki-67 staining from Stage 1,2 (n= 4 VHL WT, 9 H1H2 and 8 H2) Stage 3,4 (n= 2 VHL WT, 3 H1H2 and 3 H2) or both combined. Data are shown as mean percentage Ki-67 positive ±1 SEM. *p<.05, **p<.01. E. Expression of c-Myc activated targets and G1-S transition mediators Skp2, CDC7, CDT2 and DHFR, analyzed as above.
Figure 3
Figure 3. Microarray analysis defines separable phenotypes in VHL WT, H1H2 and H2 tumors
A. Genes associated with growth factor signaling and protein translation significantly upregulated in VHL WT and H1H2 tumors relative to H2 tumors. Statistical significance was measured by false discovery rate (FDR), and fold differences relative to H2 are shown. Gene names shown in bold have been confirmed by QRT-PCR in VHL WT (n=5), H1H2 (n=8) and H2 (n=8) tumors. Results for eIF3, and ribosomal protein S, L and P subunits are the average of genes shown. B. Representative IHC on fresh frozen VHL WT, H1H2 and H2 tumors for phospho-ERK and phospho-S6. Scale bar is 5 μM. C. Summary of phospho-ERK and phospho-S6 levels in VHL WT, H1H2 and H2 tumors, scored as weak, intermediate or strong based on intensity of staining. n=5, 12, and 11 respectively, p<.05. D. Two-way complete linkage clustering of significantly altered genes between each subgroup identifies both tumors and genes that show similar patterns of expression. Tumors are identified by color, with VHL WT highlighted in green, H1H2 in blue, and H2 in red. Red indicates higher levels of expression. The gene set involved in cell cycle and DNA damage responses are highlighted as this group was selected for further study.
Figure 4
Figure 4. H2 tumors exhibit decreased accumulation of γH2AX and genomic aberrancy
A. Enhanced expression of genes associated with HR and the spindle assembly checkpoint in H2 tumors. Data from VHL WT (n=5), H1H2 (n=8) and H2 (n=8) tumors are shown as a fold change relative to pooled normal renal epithelium, ±1 SEM. * p<.05, **p<.01. B. Representative γH2AX/Ki-67 co-staining in fresh frozen VHL WT, H1H2 and H2 only tumors. DAPI was used to identify nuclei; scale bar is 0.2 μM. C. Quantification of γH2AX staining in all cells or Ki-67+ cells from VHL WT, H1H2 and H2 tumors (n= 6, 12, and 11 respectively), ±1 SEM. * p<.05, **p<.01. Significant differences also were observed for H1H2 and H2 between all nuclei and Ki-67+ nuclei (p<0.05). D. Characteristic phospho-Chk2/γH2AX co-staining in a VHL WT, H1H2 and H2 tumor; scale bar is 0.2 μM. E. Measurement of copy number by Illumina SNP arrays in H1H2 and H2 tumors shows a significantly lower percentage of the genome is aberrant in H2 tumors (p<.04).
Figure 5
Figure 5. H2 tumors show enhanced signs of HR-mediated repair
A. Representative BARD1 staining with DAPI to indicate nuclei in VHL WT, H1H2 and H2 tumors. Scale bar is 0.1 μM B. Quantification of BARD1 nuclear staining in 4, 11, and 12 VHL WT, H1H2 and H2 tumors. Weak staining was scored as 0–15, intermediate as 15–30 and strong as >30 foci/nucleus. C. Representative BRCA1/γH2AX co-staining in VHL WT, H1H2 and H2 tumors; scale bar is 0.1 μM. D. Quantification of BRCA1 foci in γH2AX+ nuclei from VHL WT, H1H2 and H2 tumors, ±1 SEM. * p<.05, **p<.01.
Figure 6
Figure 6. HIF-2α/c-Myc effects drive enhanced HR effector expression
A. HIF-1α and HIF-2α expression in control and knockdown cell lines. “H1KD.1” and “H1KD.2” exhibit HIF-1α knockdown and “H2KD.1” and “H2KD.2” exhibit HIF-2α knockdown. Actin is shown as a loading control. See Supplemental Fig. 1A for changes in HIF-1α and HIF-2α mRNA levels in control and knockdown cells. B. Differential expression of c-Myc activated (Cyclin D2, E2F1) and repressed (p21, p27) targets in control and knockdown cell lines. Averages are shown from 4 experiments ±1 SEM. C. Expression of G1-S phase cell cycle targets and HR genes in knockdown cell lines, analyzed as in part B. D. Western blot analysis of BRCA1 and BARD1 in control and knockdown cell lines; actin is shown as a loading control. E. QRT-PCR for expression of c-Myc, BRCA1 and BARD1 in control and HIF-1α knockdown RCC4 clones transfected with control siRNA or two different siRNAs against c-Myc. Average values from 3 experiments, ±1 SEM. F. Representative images of BRCA1/γH2AX co-staining in control and HIF-α knockdown cell lines after 3 hr. treatment with 1.5 mM HU. Results from one control line are shown as both were equivalent results. Scale bar is 0.2 mM.
Figure 7
Figure 7. HIF-2α/c-Myc effects correlate with resistance to replication stress
A. Western blot analysis of Chk1, Chk2 and γH2AX phosphorylation following 1.5 mM HU treatment of control and HIF-α knockdown cell lines synchronized in S-phase by timed release from serum withdrawal and confluency. Total Chk1, Chk2, H2AX and actin are shown as controls. B. Return to DNA replication following 1 hr. treatment of S-phase synchronized cells with 1.5 mM HU, measured by BRDU incorporation. Average percent BRDU+ are shown from 3 experiments ±1 SEM. Statistically significant differences between Ctl1 and H1.1, Ctl2 and H2.2, and H1.1and H2.2 were assessed, * p <.05. C. BRDU incorporation in cells grown for 20 hr. in the presence of 1 μg/ml Aphidicolin. Percentage of cells >2N DNA content is shown, as is the 2N/BRDU+ percentage. Data from one representative experiment, ±1 SD, * p<.05, **p<.01. D. Simplified model outlining responses to replication stress. Various stress inducers have been shown to activate ATR leading to Chk1 phosphorylation and DNA repair, with replication fork collapse activating ATM, enhancing γH2AX accumulation and promoting cell cycle exit. These data are consistent with a model where HIF-2α promotes the former pathway (highlighted in red) and HIF-1α expressing cells tend to exhibit the latter (highlighted in blue).
Figure 8
Figure 8. TMA analysis of biological parameters and patient outcome
A. Representative HIF-1α and HIF-2α staining from paraffin-embedded TMA cores. Scale bar is 2 μM B. Summary of patient information and clinical outcomes across IHC determined groups. Volume was measured in CM3, * p<.05, **p<.01. C. Summary of Ki-67 staining from low and high stage tumors, or both combined. Data are shown as mean percentage Ki-67 positive ±1 SEM. * p<.05, **p<.01. D. Representative phospho-S6 staining. VHL WT and H1H2 sections shown were scored as intermediate, and the H2 section as negative, though endothelial cell phospho-S6 can be noted (red arrows). Scale bar is 0.5 μM E. Summary of phospho-S6 staining in VHL WT, H1H2 and H2 tumors, * p<.05, **p<.01. F. Representative γH2AX shown with DAB and fluorescent staining. Middle row also shows DAPI, so that negative nuclei can be appreciated, whereas lower row shows only γH2AX. Scale bars are 2, 0.5 and 0.2 mM G. Quantification of fluorescent γH2AX staining in all tumors, ±1 SEM. * p<.05, **p<.01.

Comment in

References

    1. Banks RE, Tirukonda P, Taylor C, Hornigold N, Astuti D, Cohen D, Maher ER, Stanley AJ, Harnden P, Joyce A, et al. Genetic and epigenetic analysis of von Hippel-Lindau (VHL) gene alterations and relationship with clinical variables in sporadic renal cancer. Cancer Res. 2006;66:2000–2011. - PubMed
    1. Bartkova J, Horejsi Z, Koed K, Kramer A, Tort F, Zieger K, Guldberg P, Sehested M, Nesland JM, Lukas C, et al. DNA damage response as a candidate anti-cancer barrier in early human tumorigenesis. Nature. 2005;434:864–870. - PubMed
    1. Bartkova J, Horejsi Z, Sehested M, Nesland JM, Rajpert-De Meyts E, Skakkebaek NE, Stucki M, Jackson S, Lukas J, Bartek J. DNA damage response mediators MDC1 and 53BP1: constitutive activation and aberrant loss in breast and lung cancer, but not in testicular germ cell tumours. Oncogene. 2007;26:7414–7422. - PubMed
    1. Bartkova J, Rezaei N, Liontos M, Karakaidos P, Kletsas D, Issaeva N, Vassiliou LV, Kolettas E, Niforou K, Zoumpourlis VC, et al. Oncogene-induced senescence is part of the tumorigenesis barrier imposed by DNA damage checkpoints. Nature. 2006;444:633–637. - PubMed
    1. Bindra RS, Gibson SL, Meng A, Westermark U, Jasin M, Pierce AJ, Bristow RG, Classon MK, Glazer PM. Hypoxia-induced down-regulation of BRCA1 expression by E2Fs. Cancer Res. 2005;65:11597–11604. - PubMed

Publication types

MeSH terms

Substances

Associated data