. 2021 Nov 10:10:e70992.
doi: 10.7554/eLife.70992.

Wnt signaling mediates acquisition of blood-brain barrier properties in naïve endothelium derived from human pluripotent stem cells

Affiliations

Wnt signaling mediates acquisition of blood-brain barrier properties in naïve endothelium derived from human pluripotent stem cells

Benjamin D Gastfriend et al. Elife. .

Abstract

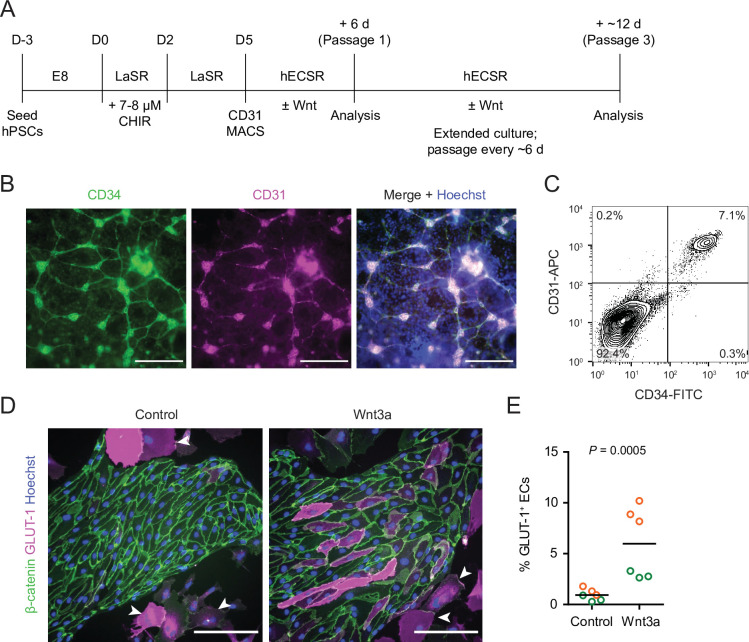
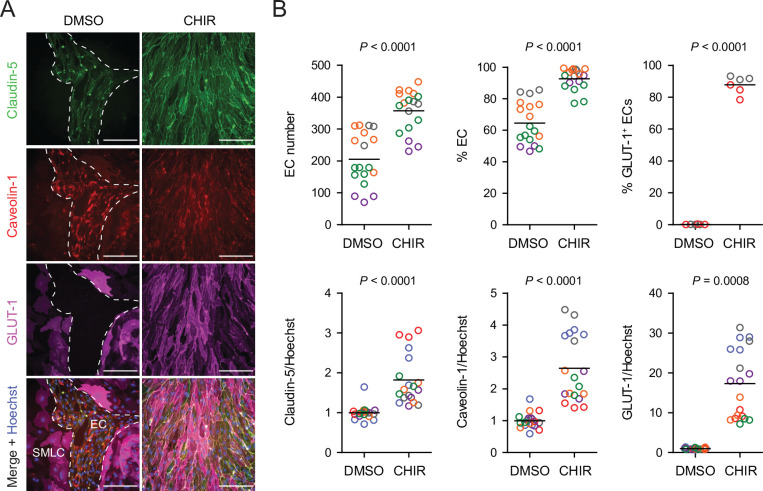
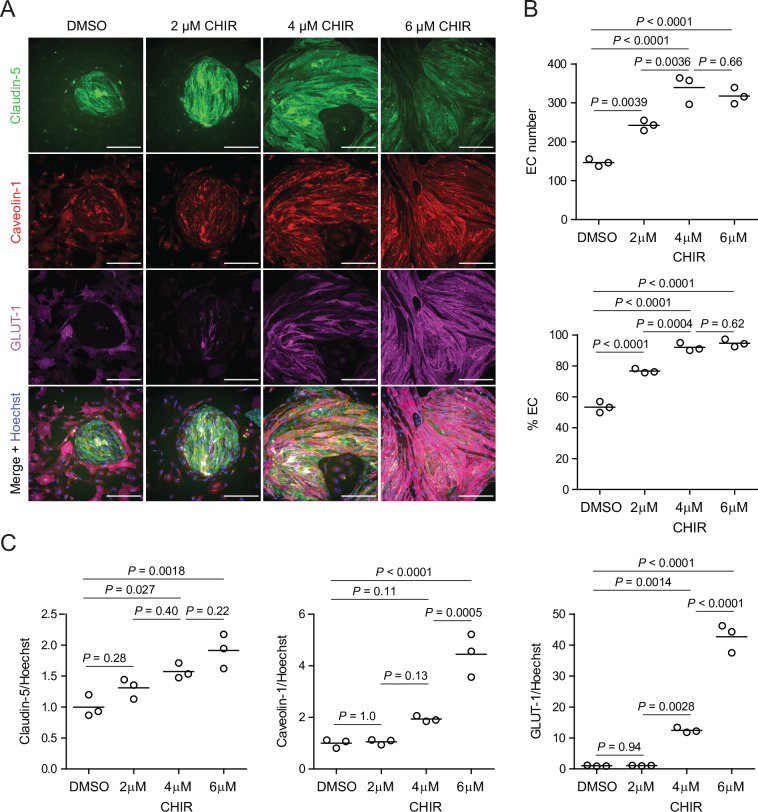
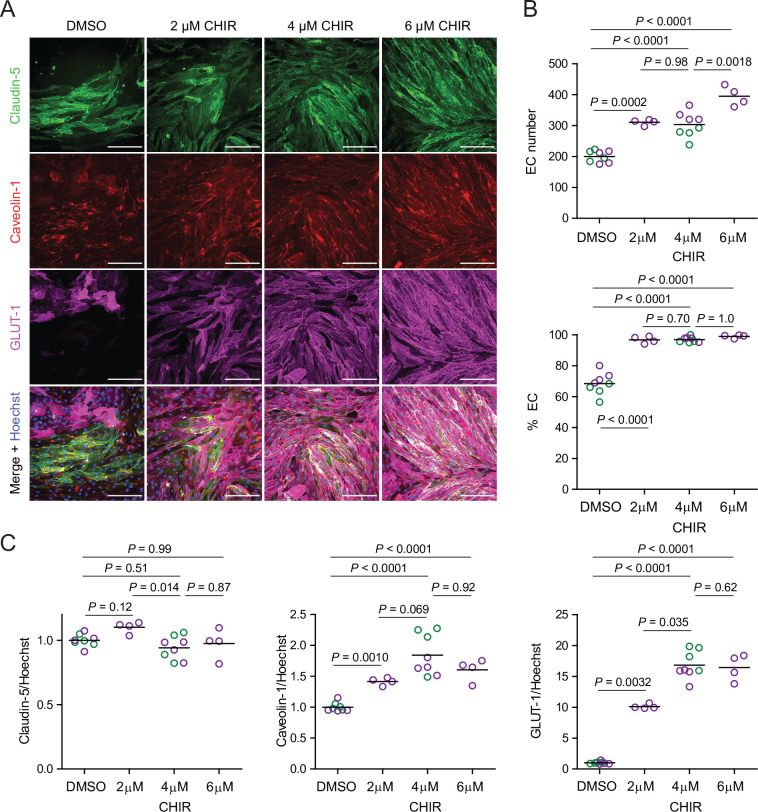
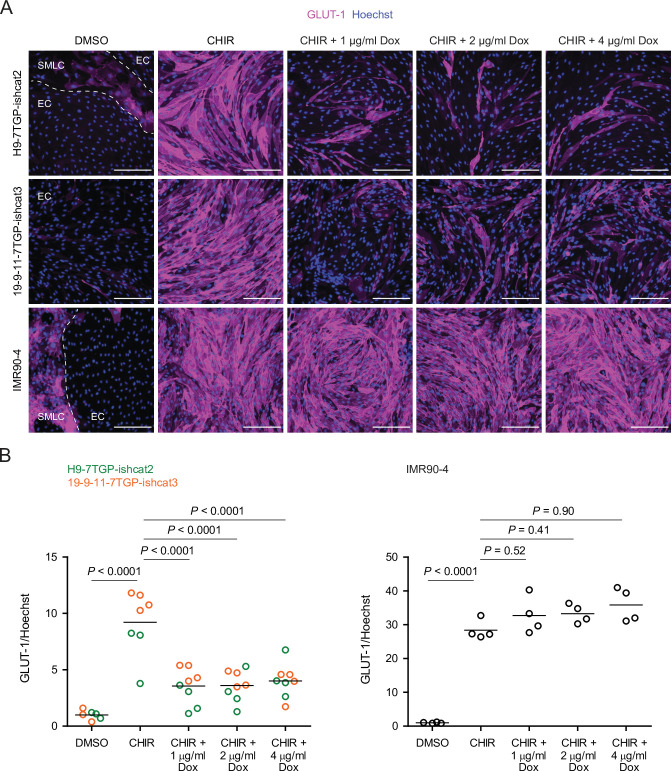
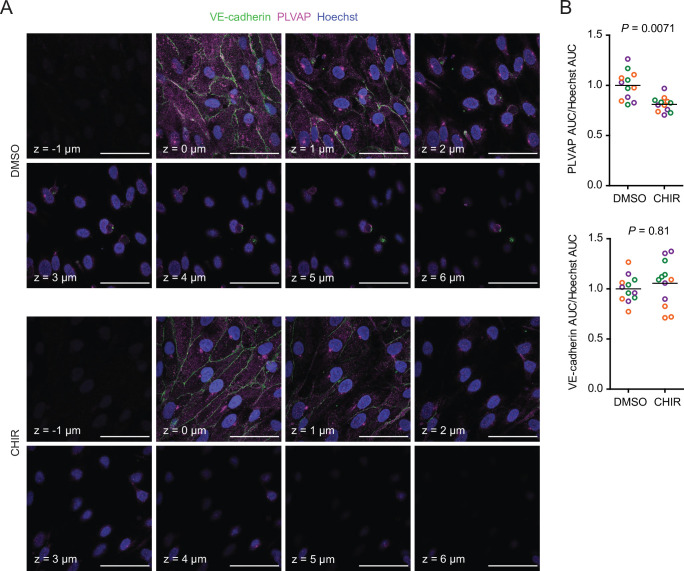
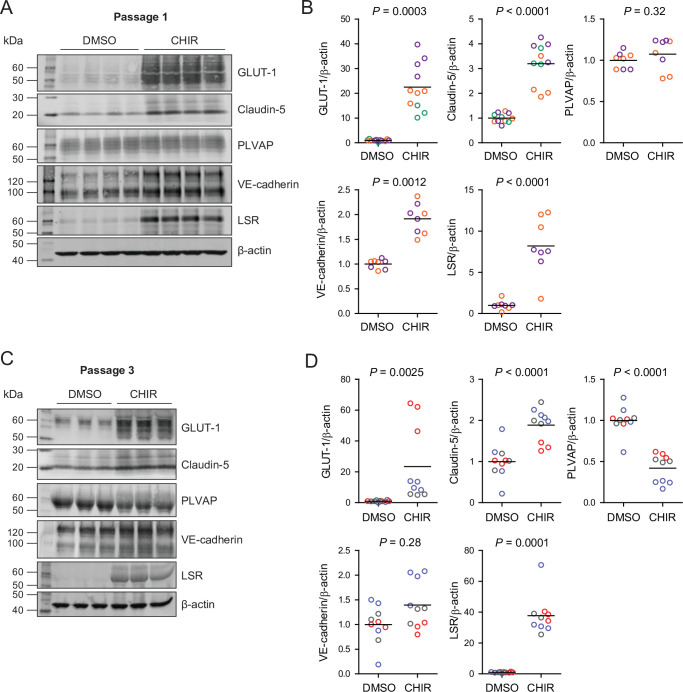
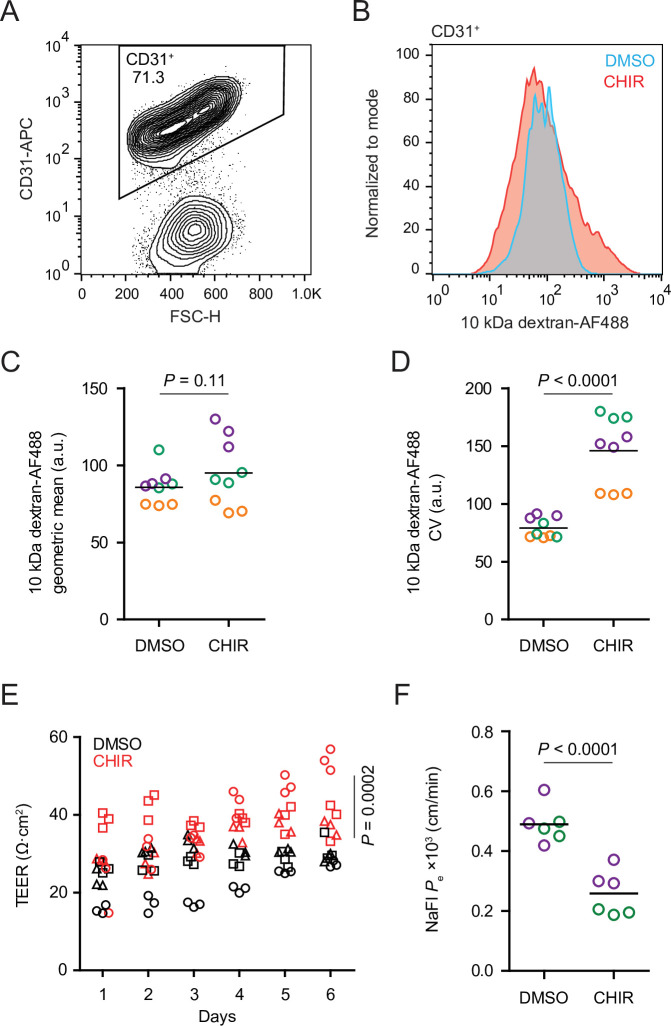
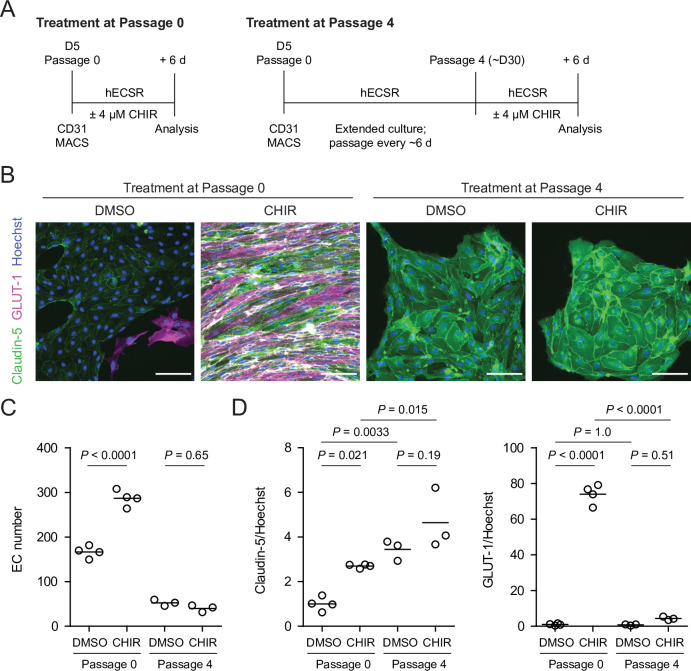
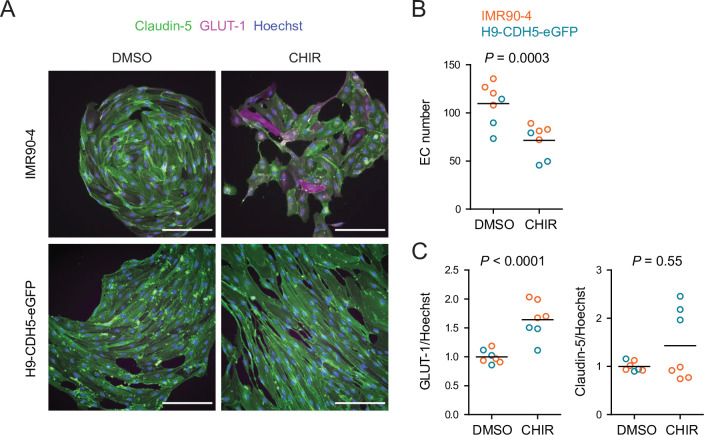
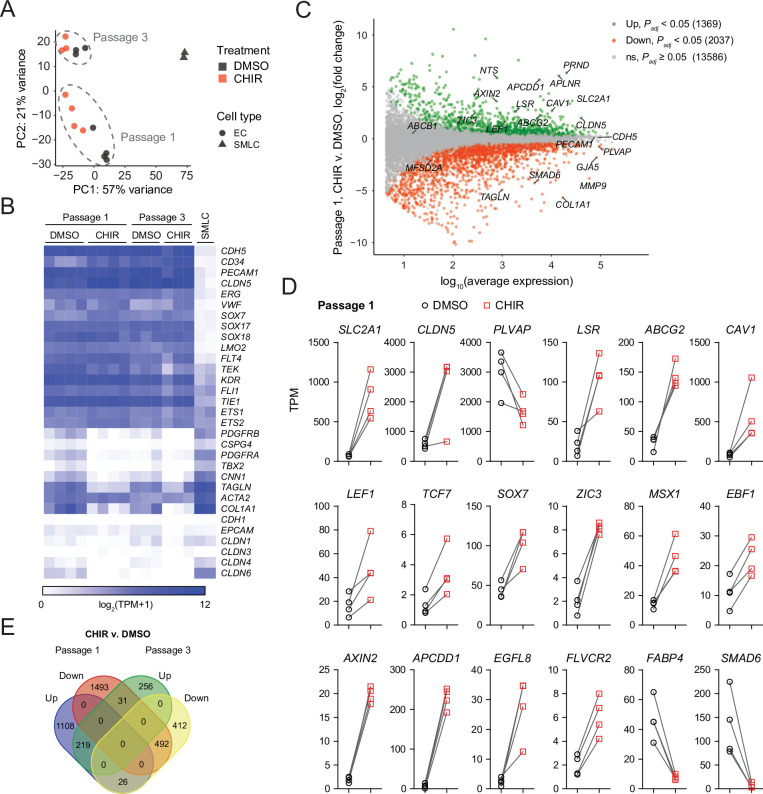
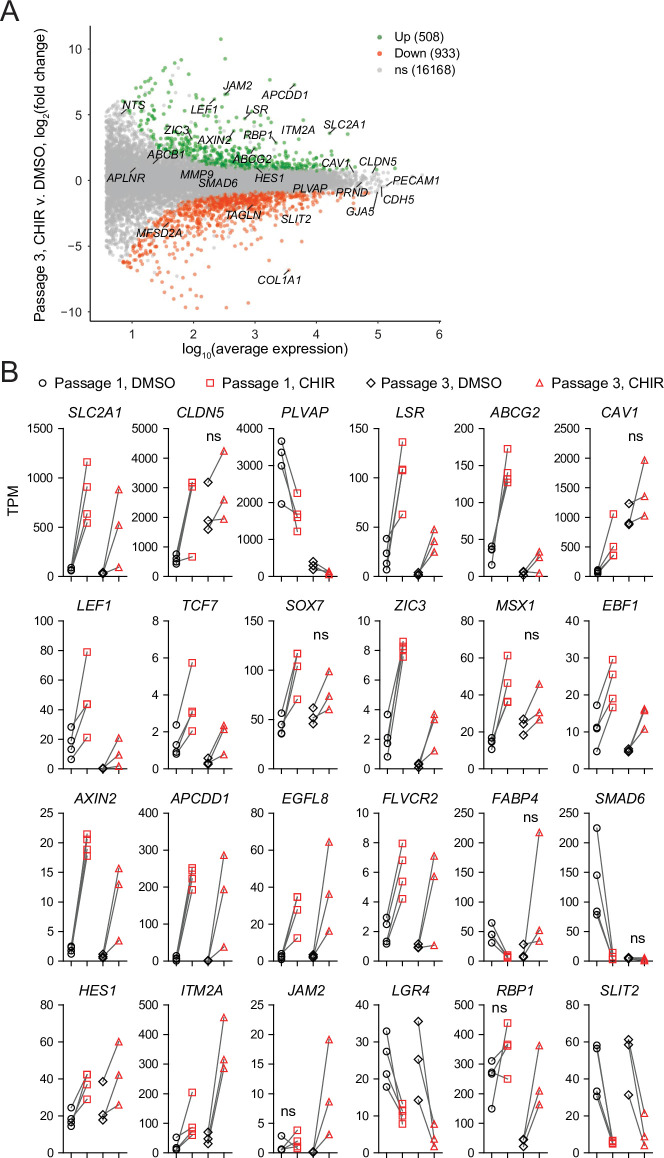
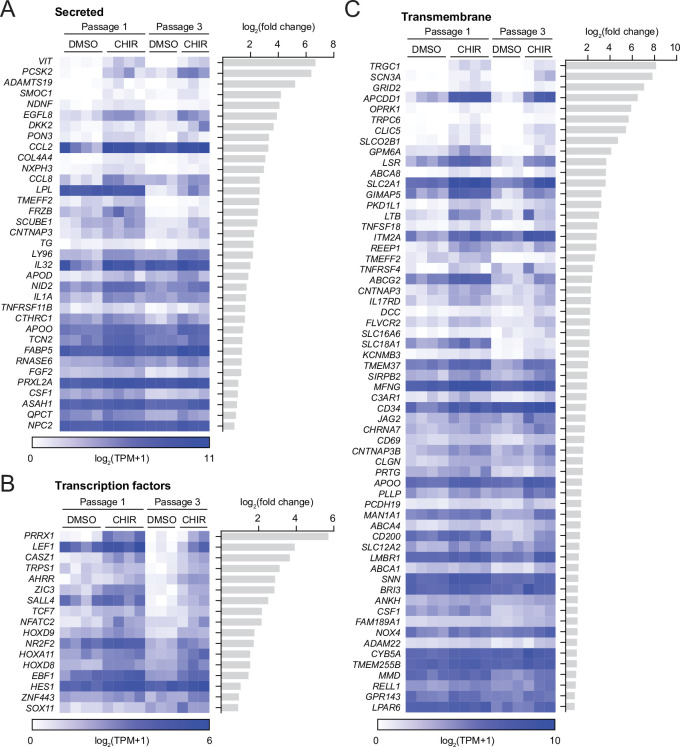
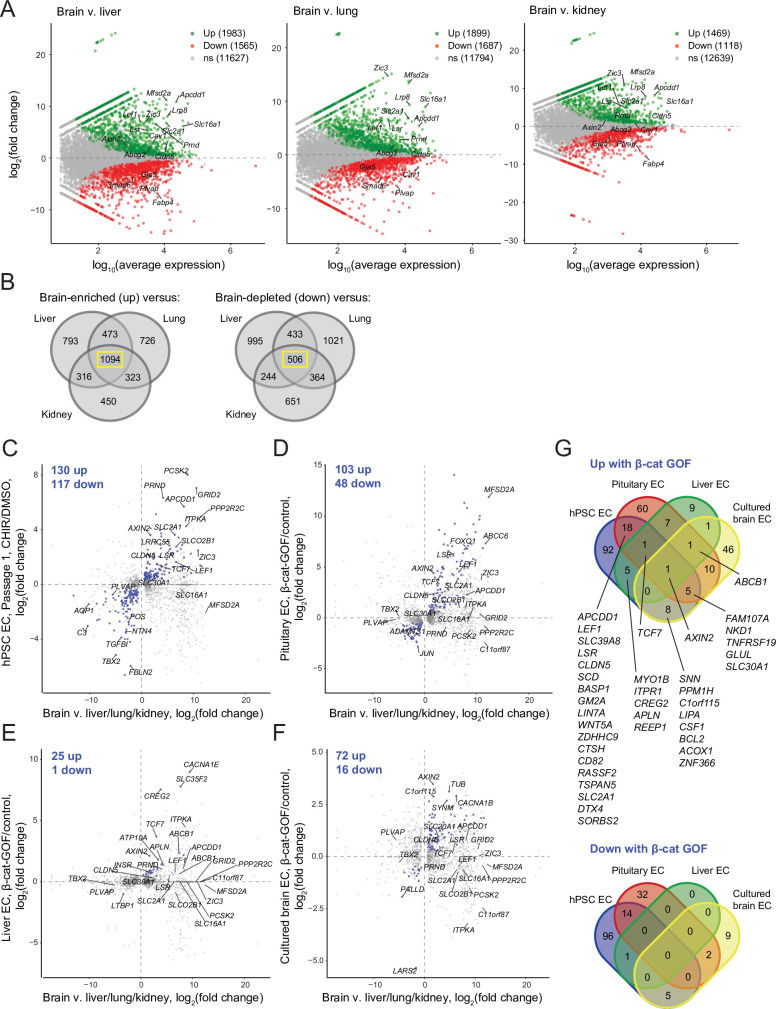
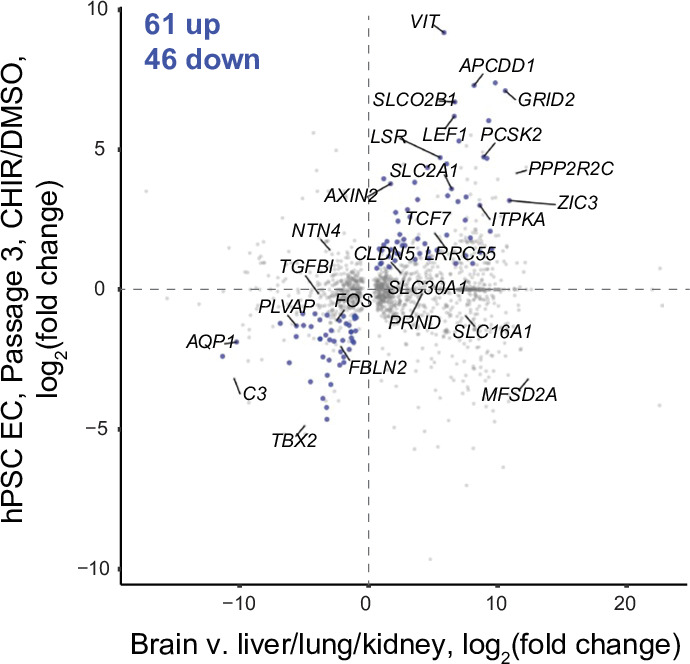
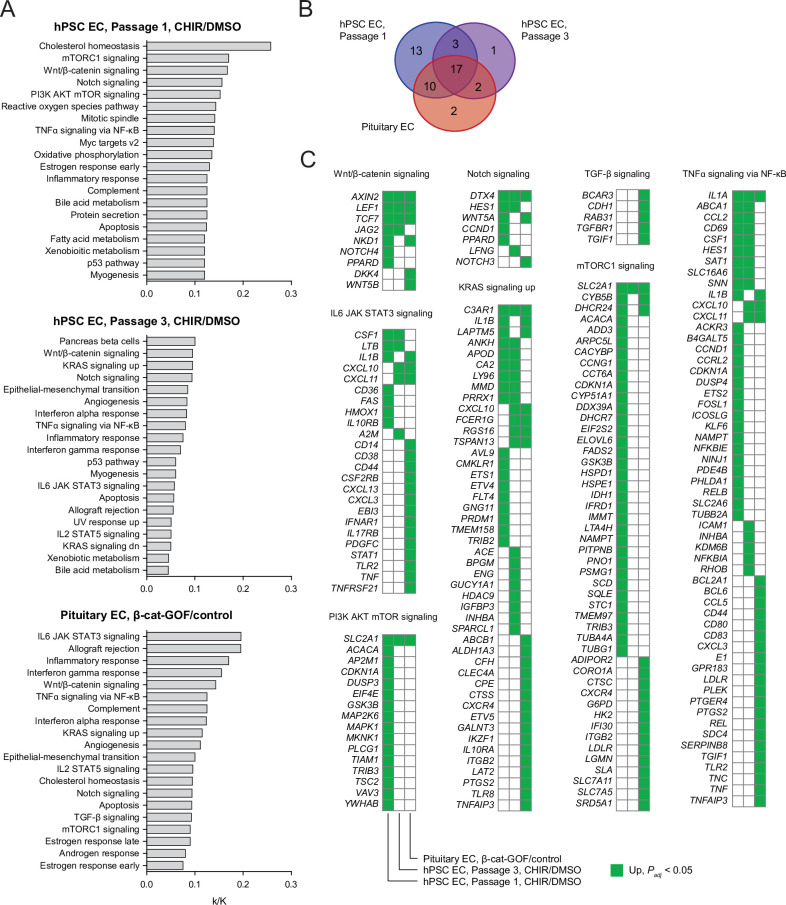
Endothelial cells (ECs) in the central nervous system (CNS) acquire their specialized blood-brain barrier (BBB) properties in response to extrinsic signals, with Wnt/β-catenin signaling coordinating multiple aspects of this process. Our knowledge of CNS EC development has been advanced largely by animal models, and human pluripotent stem cells (hPSCs) offer the opportunity to examine BBB development in an in vitro human system. Here, we show that activation of Wnt signaling in hPSC-derived naïve endothelial progenitors, but not in matured ECs, leads to robust acquisition of canonical BBB phenotypes including expression of GLUT-1, increased claudin-5, decreased PLVAP, and decreased permeability. RNA-seq revealed a transcriptome profile resembling ECs with CNS-like characteristics, including Wnt-upregulated expression of LEF1, APCDD1, and ZIC3. Together, our work defines effects of Wnt activation in naïve ECs and establishes an improved hPSC-based model for interrogation of CNS barriergenesis.

Keywords: Wnt signaling; barriergenesis; blood–brain barrier; developmental biology; endothelial cells; human; human pluripotent stem cells; neuroscience.

Plain language summary

The cells that line the inside of blood vessels are called endothelial cells. In the blood vessels of the brain, these cells form a structure called the ‘blood-brain barrier’, which allows nutrients to pass from the blood into the brain, while at the same time preventing harmful substances like toxins from crossing. Faults in the blood-brain barrier can contribute to neurological diseases, but the blood-brain barrier can also restrict drugs from accessing the brain, making it difficult to treat certain conditions. Understanding how the endothelial cells that form the blood-brain barrier develop may offer insight into new treatments for neurological diseases. During the development of the embryo, endothelial cells develop from stem cells. They can also be generated in the laboratory from human pluripotent stem cells or ‘hPSCs’, which are cells that can produce more cells like themselves, or differentiate into any cell type in the body. Scientists can treat hPSCs with specific molecules to make them differentiate into endothelial cells, or to modify their properties. This allows researchers to monitor how different types of endothelial cells form. Endothelial cells at the blood-brain barrier are one of these types. During their development, these cells gain distinct features, including the production of proteins called GLUT-1, claudin-5 and LSR. GLUT-1 transports glucose across endothelial cells’ membranes, while claudin-5 and LSR tightly join adjacent cells together, preventing molecules from leaking into the brain through the space between cells. In mouse endothelial cells, a signaling protein called Wnt is responsible for turning on the genes that code for these proteins. But how does Wnt signaling impact human endothelial cells? Gastfriend et al. probed the effects of Wnt signaling on human endothelial cells grown in the lab as they differentiate from hPSCs. They found that human endothelial cells developed distinct blood-brain barrier features when Wnt signaling was activated, producing GLUT-1, claudin-5 and LSR. Gastfriend et al. also found that human endothelial cells were more responsive to Wnt signaling earlier in their development. Additionally, they identified the genes that became activated in human endothelial cells when Wnt signaling was triggered. These findings provide insight into the development and features of the endothelial cells that form the human blood-brain barrier. The results are a first step towards a better understanding of how this structure works in humans. This information may also allow researchers to develop new ways to deliver drugs into the brain.


Conflict of interest statement

BG, HN, BE, SP, ES Inventor on a provisional US patent application (63/185815) related to this work, SC, KF No competing interests declared

Figures

Figure 1.
Figure 1.. Human pluripotent stem cell (hPSC)-derived endothelial progenitors as a model for studying Wnt-mediated barriergenesis.
(A) Overview of the endothelial differentiation and Wnt treatment protocol. (B) Immunocytochemistry analysis of CD34 and CD31 expression in D5 endothelial progenitor cells (EPCs) prior to magnetic-activated cell sorting (MACS). Hoechst nuclear counterstain is overlaid in the merged image. Scale bars: 200 μm. (C) Flow cytometry analysis of CD34 and CD31 expression in D5 EPCs prior to MACS. (D) Immunocytochemistry analysis of β-catenin and GLUT-1 expression in Passage 1 ECs treated with Wnt3a or control. Hoechst nuclear counterstain is overlaid. Arrowheads indicate smooth muscle-like cells (SMLCs). Scale bars: 200 μm. (E) Quantification of the percentage of GLUT-1+ ECs in control- and Wnt3a-treated conditions. Points represent replicate wells from two independent differentiations of the IMR90-4 line, each differentiation indicated with a different color. Bars indicate mean values. p-value: two-way ANOVA.
Figure 1—figure supplement 1.
Figure 1—figure supplement 1.. Smooth muscle-like cells (SMLCs).
Immunocytochemistry analysis of calponin and smooth muscle protein 22-⍺ (SM22⍺) in Passage 1 cultures containing endothelial cells (ECs) and SMLCs. Hoechst nuclear counterstain is overlaid in the merged image. Dashed area indicates an EC colony. Scale bars: 200 μm.
Figure 2.
Figure 2.. Effect of CHIR on endothelial properties.
(A) Immunocytochemistry analysis of claudin-5, caveolin-1, and GLUT-1 expression in Passage 1 endothelial cells (ECs) treated with DMSO or 4 µM CHIR. Hoechst nuclear counterstain is overlaid in the merged images. Dashed lines indicate the border between an EC colony and smooth muscle-like cells (SMLCs) in the DMSO condition. Scale bars: 200 μm. (B) Quantification of images from the conditions described in (A) for number of ECs per 20× field, percentage of ECs (claudin-5+ cells relative to total nuclei), percentage of GLUT-1+ ECs (relative to total claudin-5+ ECs), and mean fluorescence intensity of claudin-5, caveolin-1, and GLUT-1 normalized to Hoechst mean fluorescence intensity within the area of claudin-5+ ECs only. Points represent replicate wells from 2 to 6 independent differentiations of the IMR90-4 line, each differentiation indicated with a different color. Bars indicate mean values. For the fluorescence intensity plots, values were normalized within each differentiation such that the mean of the DMSO condition equals 1. p-values: two-way ANOVA on unnormalized data.
Figure 2—figure supplement 1.
Figure 2—figure supplement 1.. Dose-dependent effects of CHIR on endothelial properties.
(A) Immunocytochemistry analysis of claudin-5, caveolin-1, and GLUT-1 expression in Passage 1 endothelial cells (ECs) treated with 2 μM, 4 μM, or 6 μM CHIR, or DMSO vehicle control. Hoechst nuclear counterstain is overlaid in the merged images. Scale bars: 200 μm. (B) Quantification of images from the conditions described in (A) for number of ECs per 20× field and percentage of ECs (claudin-5+ cells relative to total nuclei). Points represent replicate wells from one differentiation of the IMR90-4 line, and bars indicate mean values. p-values: ANOVA followed by Tukey’s honest significant difference (HSD) test. (C) Quantification of claudin-5, caveolin-1, and GLUT-1 mean fluorescence intensity normalized to Hoechst mean fluorescence intensity within the area of claudin-5+ ECs only. Points represent replicate wells from one differentiation of the IMR90-4 line. Bars indicate mean values, with values normalized such that the mean of the DMSO condition equals 1. p-values: ANOVA followed by Tukey’s HSD test.
Figure 2—figure supplement 2.
Figure 2—figure supplement 2.. CHIR-mediated effects in an additional human pluripotent stem cell (hPSC) line.
(A) Immunocytochemistry analysis of claudin-5, caveolin-1, and GLUT-1 expression in Passage 1 endothelial cells (ECs) differentiated from the WTC11 iPSC line treated with 2 μM, 4 μM, or 6 μM CHIR, or DMSO vehicle control. Hoechst nuclear counterstain is overlaid in the merged images. Scale bars: 200 μm. (B) Quantification of images from the conditions described in (A) for number of ECs per 20× field and percentage of ECs (claudin-5+ cells relative to total nuclei). Points represent replicate wells from 1 to 2 differentiations of the WTC11 line, each differentiation indicated with a different color. Bars indicate mean values. p-values: two-way ANOVA followed by Tukey’s honest significant difference (HSD) test. (C) Quantification of claudin-5, caveolin-1, and GLUT-1 mean fluorescence intensity normalized to Hoechst mean fluorescence intensity within the area of claudin-5+ ECs only. Points represent replicate wells from 1 to 2 differentiations of the WTC11 line, each differentiation indicated with a different color. Bars indicate mean values, with values normalized within each differentiation such that the mean of the DMSO condition equals 1. p-values: two-way ANOVA followed by Tukey’s HSD test on unnormalized data.
Figure 2—figure supplement 3.
Figure 2—figure supplement 3.. β-catenin-dependence of CHIR-mediated GLUT-1 induction.
(A) Immunocytochemistry analysis of GLUT-1 expression in Passage 1 endothelial cells (ECs) treated with DMSO, CHIR, or CHIR+ doxycycline (Dox) at 1, 2, or 4 μg/mL. Images from the H9-7TGP-ishcat2, 19-9-11-7TGP-ishcat3, and IMR90-4 lines are shown. Hoechst nuclear counterstain is overlaid. Dashed lines indicate borders between EC colonies and smooth muscle-like cells (SMLCs) in the DMSO condition. Scale bars: 200 μm. (B) Quantification of images from the conditions described in (A) for GLUT-1 mean fluorescence intensity normalized to Hoechst mean fluorescence intensity within the area of ECs only. At left, points represent replicate wells from one differentiation of the H9-7TGP-ishcat line (green) and one differentiation of the 19-9-11-7TGP-ishcat3 line (orange). Bars indicate mean values, with values normalized within each differentiation such that the mean of the DMSO condition equals 1. p-values: two-way ANOVA followed by Tukey’s honest significant difference (HSD) test on unnormalized data. At right, points represent replicate wells from one differentiation of the IMR90-4 line. Bars indicate mean values, with values normalized such that the mean of the DMSO condition equals 1. p-values: ANOVA followed by Tukey’s HSD test.
Figure 2—figure supplement 4.
Figure 2—figure supplement 4.. Effect of CHIR on endothelial cell proliferation.
(A) Immunocytochemistry analysis of CD31 and Ki67 expression in Passage 1 endothelial cells (ECs) treated with DMSO or CHIR. Hoechst nuclear counterstain is overlaid. Dashed lines indicate borders between the EC colony and smooth muscle-like cells (SMLCs) in the DMSO condition. Arrowheads indicate examples of Ki67+ ECs. Scale bars: 200 μm. (B) Quantification of the percentage of Ki67+ ECs in DMSO- and CHIR-treated conditions. Points represent replicate wells from one differentiation of the WTC11 line, and bars indicate mean values. p-value: Student’s t test. (C) Flow cytometry-based cell cycle analysis. Representative plots of Vybrant DyeCycle Green Stain abundance in CD31+ cells from Passage 1 cultures treated with DMSO or CHIR. (D) Quantification of the percentage of S/G2/M phase ECs. Points represent replicate wells from one differentiation of the WTC11 line, and bars indicate mean values. p-value: Student’s t test.
Figure 3.
Figure 3.. Effect of CHIR on endothelial PLVAP expression.
(A) Confocal immunocytochemistry analysis of VE-cadherin and PLVAP expression in Passage 1 endothelial cells (ECs) treated with DMSO or CHIR. Hoechst nuclear counterstain is overlaid. Eight serial confocal Z-slices with 1 μm spacing are shown. Scale bars: 50 μm. (B) Quantification of PLVAP and VE-cadherin area under the curve (AUC) of mean fluorescence intensity versus Z-position normalized to Hoechst AUC. Points represent replicate wells from three independent differentiations of the IMR90-4 line, each differentiation indicated with a different color. Bars indicate mean values, with values normalized within each differentiation such that the mean of the DMSO condition equals 1. p-values: two-way ANOVA on unnormalized data.
Figure 4.
Figure 4.. Effect of CHIR on protein expression in Passage 1 and Passage 3 endothelial cells (ECs).
(A) Western blots of Passage 1 ECs treated with DMSO or CHIR probed for GLUT-1, claudin-5, PLVAP, VE-cadherin, LSR, and β-actin. (B) Quantification of western blots of Passage 1 ECs. GLUT-1, claudin-5, PLVAP, VE-cadherin, and LSR band intensities was normalized to β-actin band intensity. Points represent replicate wells from 2 to 3 independent differentiations of the IMR90-4 line, each differentiation indicated with a different color. Bars indicate mean values, with values normalized within each differentiation such that the mean of the DMSO condition equals 1. p-values: two-way ANOVA on unnormalized data. (C) Western blots of Passage 3 ECs treated with DMSO or CHIR probed for GLUT-1, claudin-5, PLVAP, VE-cadherin, LSR, and β-actin. (D) Quantification of western blots of Passage 3 ECs. GLUT-1, claudin-5, PLVAP, VE-cadherin, and LSR band intensities was normalized to β-actin band intensity. Points represent replicate wells from three independent differentiations of the IMR90-4 line, each differentiation indicated with a different color. Bars indicate mean values, with values normalized within each differentiation such that the mean of the DMSO condition equals 1. p-values: two-way ANOVA on unnormalized data.
Figure 5.
Figure 5.. Functional properties of CHIR- and DMSO-treated endothelial cells (ECs).
(A) Flow cytometry analysis of CD31 expression in Passage 1 ECs following the dextran internalization assay. CD31+ cells were gated for further analysis. (B) Flow cytometry analysis of 10 kDa dextran-Alexa Fluor 488 (AF488) abundance in CD31+ cells. Cells were treated with DMSO or CHIR for 6 days prior to the assay. Representative plots from cells incubated with dextran for 2 hr at 37°C are shown. (C) Quantification of 10 kDa dextran-AF488 geometric mean fluorescence intensity in CD31+ cells. Treatment and assay conditions were as described in (B). Points represent replicate wells from three independent differentiations of the IMR90-4 line, each differentiation indicated with a different color. Bars indicate mean values. p-value: two-way ANOVA. (D) Quantification of the coefficient of variation (CV) of 10 kDa dextran-AF488 fluorescence intensity in CD31+ cells. Points represent replicate wells from three independent differentiations of the IMR90-4 line, each differentiation indicated with a different color. Bars indicate mean values. p-value: two-way ANOVA. (E) Transendothelial electrical resistance (TEER) of Passage 3 ECs. The x-axis indicates the number of days after seeding cells on Transwell inserts. Points represent replicate wells from three independent differentiations of the IMR90-4 line, each differentiation indicated with a different shape. p-value: two-way ANOVA. (F) Permeability of Passage 3 ECs to sodium fluorescein. Points represent replicate wells from two independent differentiations of the IMR90-4 line, each differentiation indicated with a different color. Bars indicate mean values. p-value: two-way ANOVA.
Figure 5—figure supplement 1.
Figure 5—figure supplement 1.. Endocytosis dependence of dextran uptake.
(A, B) Flow cytometry analysis of 10 kDa dextran-Alexa Fluor 488 (AF488) abundance in DMSO-treated CD31+ cells. Representative plots from cells incubated with dextran for 2 hr at 37°C (same plot shown in Figure 5B) or 4°C (A) or cells incubated with dextran and indicated inhibitors (B) are shown. (C) Quantification of 10 kDa dextran-AF488 geometric mean fluorescence intensity in CD31+ cells. Treatment and assay conditions were as described in (B). Points represent replicate wells from two independent differentiations of the IMR90-4 line, each differentiation indicated with a different color. Bars indicate mean values. p-values: two-way ANOVA followed by Dunnett’s test. CPZ: chlorpromazine. (D) Confocal immunocytochemistry analysis of caveolin-1 expression and 10 kDa dextran internalization in Passage 1 DMSO-treated endothelial cells (ECs). Hoechst nuclear counterstain is overlaid. Single confocal Z-slices from two representative fields are shown. XZ and YZ projections derived from serial Z-slices with 0.25 μm spacing are shown at right and below. Arrowheads indicate dextran+ caveolin-1+ puncta. Scale bars: 10 μm.
Figure 6.
Figure 6.. Effect of CHIR treatment in endothelial progenitor cells (EPCs) and matured endothelium.
(A) Overview of the endothelial differentiation, extended culture, and CHIR treatment protocols. (B) Immunocytochemistry analysis of claudin-5 and GLUT-1 expression in endothelial cells (ECs) treated with DMSO or CHIR as outlined in (A). Images from the IMR90-4 line are shown. Hoechst nuclear counterstain is overlaid. Scale bars: 100 μm. (C) Quantification of images from the conditions described in (B) for number of ECs per 30× field. Points represent replicate wells from one differentiation of the IMR90-4 line. Bars indicate mean values. p-values: ANOVA followed by Tukey’s honest significant difference (HSD) test. (D) Quantification of images from the conditions described in (B) for GLUT-1 and claudin-5 mean fluorescence intensity normalized to Hoechst mean fluorescence intensity within the area of claudin-5+ ECs only. Points represent replicate wells from one differentiation of the IMR90-4 line. Bars indicate mean values, with values normalized such that the mean of the DMSO condition equals 1. p-values: ANOVA followed by Tukey’s HSD test.
Figure 6—figure supplement 1.
Figure 6—figure supplement 1.. Effect of CHIR treatment in matured endothelium.
(A) Immunocytochemistry analysis of claudin-5 and GLUT-1 expression in endothelial cells (ECs) treated with DMSO or CHIR at Passage 4 (as outlined in Figure 6A). Images from the IMR90-4 and H9-CDH5-eGFP lines are shown. Hoechst nuclear counterstain is overlaid. Scale bars: 100 μm. (B) Quantification of images from the conditions described in (A) for number of ECs per 20× field. Points represent replicate wells from one differentiation of the IMR90-4 line (orange) and one differentiation of the H9-CDH5-eGFP line (blue). Bars indicate mean values. p-value: two-way ANOVA. (C) Quantification of images from the conditions described in (A) for GLUT-1 and claudin-5 mean fluorescence intensity normalized to Hoechst mean fluorescence intensity within the area of claudin-5+ ECs only. Points represent replicate wells from one differentiation of the IMR90-4 line (orange) and one differentiation of the H9-CDH5-eGFP line (blue). Bars indicate mean values, with values normalized within each differentiation such that the mean of the DMSO condition equals 1. p-values: two-way ANOVA on unnormalized data.
Figure 7.
Figure 7.. RNA-seq of DMSO- and CHIR-treated endothelial cells (ECs).
(A) Principal component (PC) analysis of EC and smooth muscle-like cell (SMLC) whole-transcriptome data subject to variance stabilizing transformation by DESeq2. Points from Passage 1 ECs represent cells from four independent differentiations of the IMR90-4 line, points from Passage 3 ECs represent cells from three independent differentiations of the IMR90-4 line, and points from SMLCs represent two independent differentiations of the IMR90-4 line. Points are colored based on treatment: DMSO (black), CHIR (red). Data are plotted in the space of the first two PCs, with the percentage of variance explained by PC1 and PC2 shown in axis labels. Dashed lines indicate points from Passage 1 and Passage 3 ECs, and are not confidence ellipses. (B) Heatmap of transcript abundance [log2(TPM + 1)] for endothelial, mesenchymal, and epithelial genes across all samples. Abundance data for all transcripts are provided in Supplementary file 1. (C) Differential expression analysis of Passage 1 CHIR-treated ECs compared to Passage 1 DMSO-treated ECs. Differentially expressed genes (adjusted p-values<0.05, DESeq2 Wald test with Benjamini–Hochberg correction) are highlighted in green (upregulated) and red (downregulated). The number of upregulated, downregulated, and nonsignificant (ns) genes is shown in the legend. Complete results of differential expression analysis are provided in Supplementary file 2. (D) Transcript abundance (TPM) of Wnt-regulated, barrier-related genes in Passage 1 DMSO- and CHIR-treated ECs. Points represent cells from four independent differentiations of the IMR90-4 line and lines connect points from matched differentiations. All genes shown were differentially expressed (adjusted p-values<0.05, DESeq2 Wald test with Benjamini–Hochberg correction). p-values are provided in Supplementary file 2. (E) Venn diagram illustrating the number of genes identified as upregulated or downregulated (adjusted p-values<0.05, DESeq2 Wald test with Benjamini–Hochberg correction) in ECs treated with CHIR versus DMSO at Passage 1 compared to Passage 3. Gene lists are provided in Supplementary file 2, and selected genes are shown in Figure 7—figure supplement 1 and Figure 7—figure supplement 2.
Figure 7—figure supplement 1.
Figure 7—figure supplement 1.. Differential expression analysis of Passage 3 endothelial cells (ECs) treated with CHIR versus DMSO.
(A) Differential expression analysis of Passage 3 CHIR-treated ECs compared to Passage 3 DMSO-treated ECs. Differentially expressed genes (adjusted p-values<0.05, DESeq2 Wald test with Benjamini–Hochberg correction) are highlighted in green (upregulated) and red (downregulated). The number of upregulated, downregulated, and nonsignificant (ns) genes is shown in the legend. Complete results of differential expression analyses are provided in Supplementary file 2. (B) Transcript abundance (TPM) of selected genes in Passage 1 and Passage 3 DMSO- and CHIR-treated ECs. Points represent cells from 3 to 4 independent differentiations of the IMR90-4 line. Lines connect points from matched differentiations between the DMSO and CHIR conditions; for clarity, lines connecting points between Passage 1 and Passage 3 are omitted. Genes shown were differentially expressed (CHIR vs. DMSO, adjusted p-values<0.05, DESeq2 Wald test with Benjamini–Hochberg correction), except where indicated as ns. p-values are provided in Supplementary file 2.
Figure 7—figure supplement 2.
Figure 7—figure supplement 2.. Genes upregulated by CHIR at both Passage 1 and Passage 3.
(A–C) Heatmaps of transcript abundance [log2(TPM + 1)] for genes encoding secreted factors (A), transcription factors (B), and transmembrane proteins (C) that are CHIR-upregulated (adjusted p-values<0.05, DESeq2 Wald test with Benjamini–Hochberg correction) in both Passage 1 and Passage 3 endothelial cells (ECs). p-values are provided in Supplementary file 2. The log2(fold change) (CHIR vs. DMSO, average of Passage 1 and Passage 3 values) for each gene is shown at left.
Figure 7—figure supplement 3.
Figure 7—figure supplement 3.. Gene correlation network analysis.
(A) Heatmap representation of the weighted gene correlation network analysis (WGCNA) topological overlap matrix (TOM). Red indicates high topological overlap. Dendrogram from hierarchical clustering of genes based on dissimilarity (1 – TOM) is shown above. Module assignments (colors) are shown above and at left. (B) Correlation between module eigengenes and experimental variables (Passage number and CHIR treatment). Each box shows the Pearson correlation coefficient r and the p-value (P). (C) Network representation of the 30 genes in the green module with the highest intramodular connectivity. Edge color represents topological overlap. Edges with topological overlap less than 0.08 are not shown. For reference, maximum topological overlap (excluding the diagonal) within the entire network is 0.38, and topological overlap between AXIN2 (green module) and ACTB (turquoise module) is 3.8 × 10⁻⁴.
Figure 7—figure supplement 4.
Figure 7—figure supplement 4.. Differential expression analysis of Passage 1 versus Passage 3 endothelial cells (ECs).
(A) Differential expression analysis of Passage 3 DMSO-treated ECs compared to Passage 1 DMSO-treated ECs. Differentially expressed genes (adjusted p-values<0.05, DESeq2 Wald test with Benjamini–Hochberg correction) are highlighted in green (upregulated) and red (downregulated). The number of upregulated, downregulated, and nonsignificant (ns) genes is shown in the legend. Complete results of differential expression analyses are provided in Supplementary file 2. (B) Transcript abundance (TPM) of selected genes. Genes shown were differentially expressed (adjusted p-values<0.05, DESeq2 Wald test with Benjamini–Hochberg correction) except those indicated as ns. p-Values are provided in Supplementary file 2. (C) Flow cytometry analysis of CD34 and CD31 expression in D5 endothelial progenitor cells (EPCs) (prior to magnetic-activated cell sorting [MACS]) and in Passage 2 ECs.
Figure 7—figure supplement 5.
Figure 7—figure supplement 5.. Blood–brain barrier transcriptional profile.
Heatmap of transcript abundance [log2(TPM + 1)] for blood–brain barrier (BBB) genes encompassing tight junctions, vesicle trafficking components, solute carriers, and efflux transporters. Solute carrier and efflux transporter genes that were expressed in human brain endothelial cells (ECs) at an average of >100 transcripts per million (TPM) in a meta-analysis of scRNA-seq datasets (Gastfriend et al., 2021) are included. Abundance data for all transcripts are provided in Supplementary file 1. At right, arrows indicate directionality of change for differentially expressed genes (adjusted p-values<0.05, DESeq2 Wald test with Benjamini–Hochberg correction) for the three comparisons shown above. Changes with expected directionality for gain of central nervous system (CNS) EC character have arrows highlighted in green.
Figure 7—figure supplement 6.
Figure 7—figure supplement 6.. Expression of Wnt pathway components in naïve endothelial cells (ECs).
Abundance of transcripts (in transcripts per million [TPM]) encoding Wnt receptors, co-receptors, and other pathway components in Passage 1 DMSO-treated ECs. Points represent cells from four independent differentiations of the IMR90-4 line. Bars indicate mean values. ADGRA2 is also known as GPR124.
Figure 8.
Figure 8.. Identification of concordantly Wnt-regulated central nervous system (CNS) endothelial cell (EC)-associated genes in RNA-seq data.
(A) Differential expression analysis of P7 murine brain ECs compared to liver, lung, or kidney ECs (Sabbagh et al., 2018). Differentially expressed genes (adjusted p-values<0.05, DESeq2 Wald test with Benjamini–Hochberg correction) are highlighted in green (up, brain-enriched) and red (down, brain-depleted). The number of up, down, and nonsignificant (ns) genes is shown in the legends. (B) Venn diagrams illustrating the number of genes identified as brain EC-enriched (left) or brain EC-depleted (right) versus liver, lung, or kidney ECs (adjusted p-values<0.05, DESeq2 Wald test with Benjamini–Hochberg correction). The 1094 genes enriched in brain ECs compared to each other organ, and the 506 genes depleted in brain ECs compared to each other organ, were used for subsequent analysis of the effects of Wnt activation in the various experimental contexts. (C–F) In each plot, the x-axis indicates average log2(fold change) of gene expression in brain ECs compared to liver, lung, and kidney ECs for the 1094 brain EC-enriched genes and 506 brain EC-depleted genes described in (B) with known mouse-human homology. Homologous human gene names are shown. The y-axes indicate differential expression [log2(fold change)] in Passage 1 CHIR-treated ECs compared to Passage 1 DMSO-treated ECs (C), in adult mouse pituitary ECs with stabilized β-catenin (gain-of-function, GOF) compared to controls (Wang et al., 2019) (D), in adult mouse liver ECs with stabilized β-catenin compared to controls (Munji et al., 2019) (E), or in cultured adult mouse brain ECs with stabilized β-catenin compared to controls (Sabbagh and Nathans, 2020) (F). Points are highlighted in blue if concordantly regulated (upregulated in both comparisons or downregulated in both comparisons). The number of concordantly upregulated and concordantly downregulated genes is shown. Genes were identified as upregulated or downregulated based on adjusted p-values<0.05, DESeq2 Wald test with Benjamini–Hochberg correction. (G) Venn diagrams illustrating the number of brain EC-enriched genes concordantly upregulated with β-catenin GOF (top) and the number of brain EC-depleted genes concordantly downregulated with β-catenin GOF (bottom) for the four comparisons shown in (C–F). Complete results of this analysis are provided in Supplementary file 4.
Figure 8—figure supplement 1.
Figure 8—figure supplement 1.. Concordantly Wnt-regulated central nervous system (CNS) endothelial cell (EC)-associated genes in RNA-seq data of Passage 3 ECs.
The x-axis indicates average log2(fold change) of gene expression in brain ECs compared to liver, lung, and kidney ECs for the 1094 brain EC-enriched genes and 506 brain EC-depleted genes described in Figure 8B with known mouse-human homology. Homologous human gene names are shown. The y-axis indicates differential expression [log2(fold change)] in Passage 3 CHIR-treated ECs compared to Passage 3 DMSO-treated ECs. Points are highlighted in blue if concordantly regulated (upregulated in both comparisons or downregulated in both comparisons). The number of concordantly upregulated and concordantly downregulated genes is shown. Genes were identified as upregulated or downregulated based on adjusted p-values<0.05, DESeq2 Wald test with Benjamini–Hochberg correction.
Figure 8—figure supplement 2.
Figure 8—figure supplement 2.. Pathway analysis of endothelial cells (ECs) with Wnt activation.
(A) Enriched gene sets (false discovery rate <0.05) in Passage 1 CHIR-treated ECs compared to Passage 1 DMSO-treated ECs (top), Passage 3 CHIR-treated ECs compared to Passage 3 DMSO-treated ECs (middle), or adult mouse pituitary ECs with stabilized β-catenin (gain-of-function, GOF) compared to controls (Wang et al., 2019) (bottom). For each gene set, the ratio of the number of genes in the gene set that are upregulated (log2(fold change) > 0, adjusted p-value<0.05, DESeq2 Wald test with Benjamini–Hochberg correction) in the relevant comparison (k) to the total number of genes in the gene set (K) is shown. For each comparison, the 20 gene sets with the highest k/K ratio are shown. Supplementary file 5 lists all enriched gene sets, and values of k, K, and false discovery rate. (B) Venn diagram illustrating the number of enriched gene sets for the three comparisons in (A). (C) Genes driving gene set enrichment. Selected gene sets enriched in at least one comparison shown in (A) are shown, with squares highlighted in green indicating upregulation (log2(fold change) > 0, adjusted p-value<0.05, DESeq2 Wald test with Benjamini–Hochberg correction). Only genes upregulated in at least one of the three comparisons are shown.

References

    1. Andreone BJ, Chow BW, Tata A, Lacoste B, Ben-Zvi A, Bullock K, Deik AA, Ginty DD, Clish CB, Gu C. Blood-Brain Barrier Permeability Is Regulated by Lipid Transport-Dependent Suppression of Caveolae-Mediated Transcytosis. Neuron. 2017;94:581–594. doi: 10.1016/j.neuron.2017.03.043. - DOI - PMC - PubMed
    1. Armulik A, Genové G, Mäe M, Nisancioglu MH, Wallgard E, Niaudet C, He L, Norlin J, Lindblom P, Strittmatter K, Johansson BR, Betsholtz C. Pericytes regulate the blood-brain barrier. Nature. 2010;468:557–561. doi: 10.1038/nature09522. - DOI - PubMed
    1. Aurrand-Lions M, Duncan L, Ballestrem C, Imhof BA. JAM-2, a novel immunoglobulin superfamily molecule, expressed by endothelial and lymphatic cells. The Journal of Biological Chemistry. 2001;276:2733–2741. doi: 10.1074/jbc.M005458200. - DOI - PubMed
    1. Bao X, Lian X, Palecek SP. Directed Endothelial Progenitor Differentiation from Human Pluripotent Stem Cells Via Wnt Activation Under Defined Conditions. Methods in Molecular Biology. 2016;1481:183–196. doi: 10.1007/978-1-4939-6393-5_17. - DOI - PMC - PubMed
    1. Bao X, Bhute VJ, Han T, Qian T, Lian X, Palecek SP. Human pluripotent stem cell-derived epicardial progenitors can differentiate to endocardial-like endothelial cells. Bioengineering & Translational Medicine. 2017;2:191–201. doi: 10.1002/btm2.10062. - DOI - PMC - PubMed

Publication types

MeSH terms

Associated data