. 2021 Aug 31:10:e70948.
doi: 10.7554/eLife.70948.

Inducible and reversible inhibition of miRNA-mediated gene repression in vivo

Affiliations

Inducible and reversible inhibition of miRNA-mediated gene repression in vivo

Gaspare La Rocca et al. Elife. .

Abstract

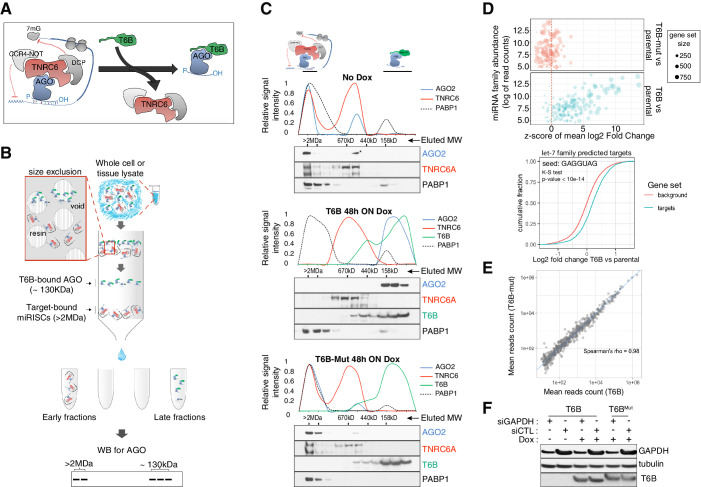
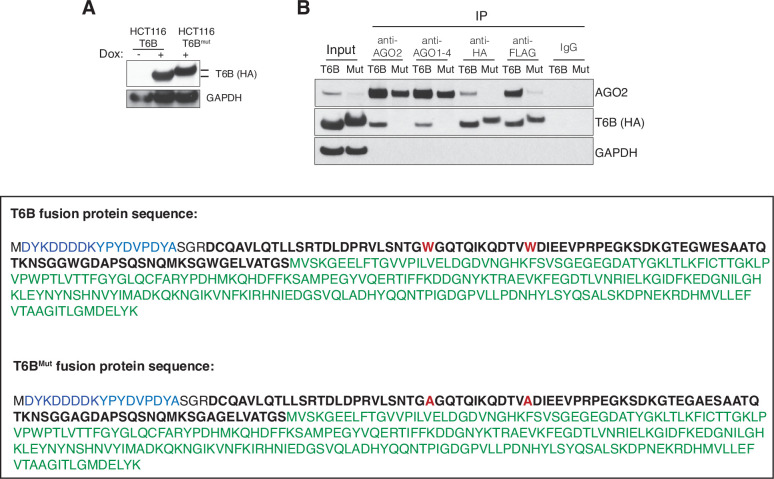
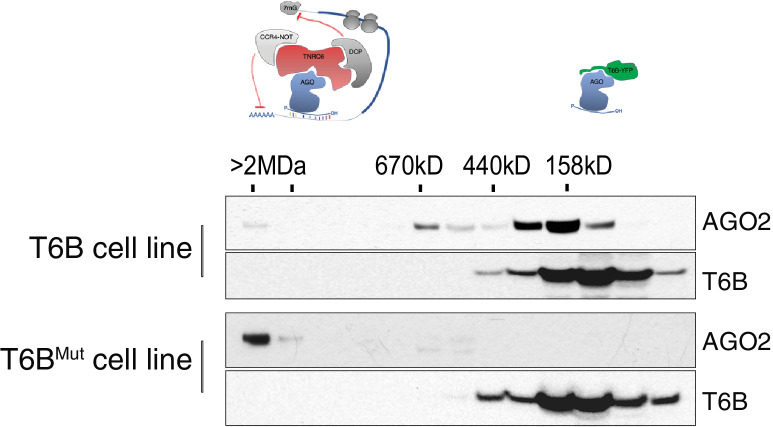
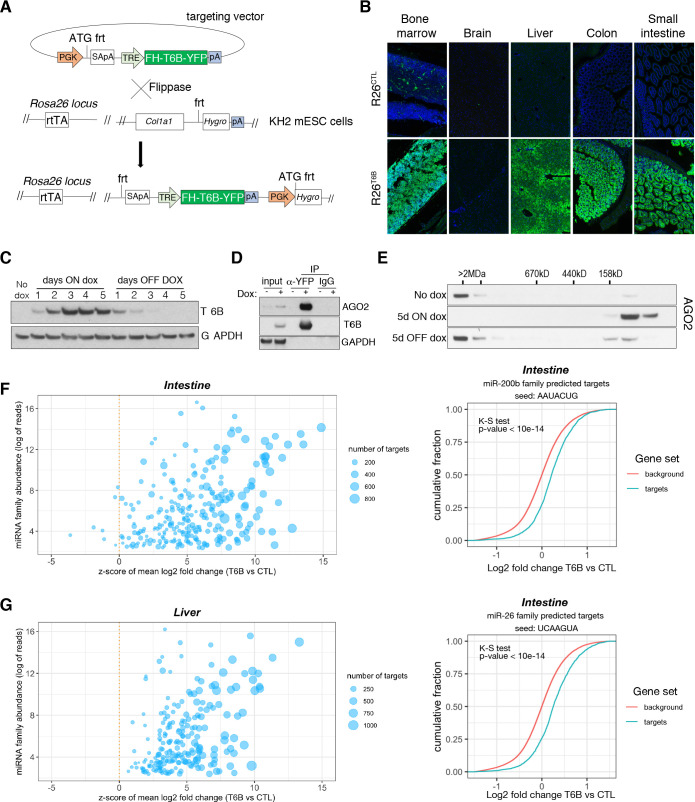
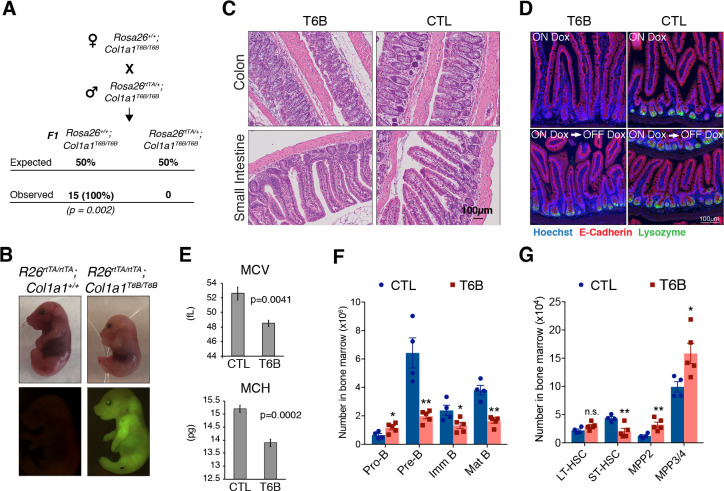
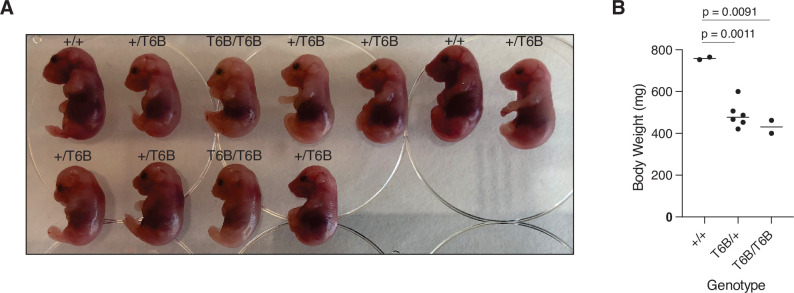
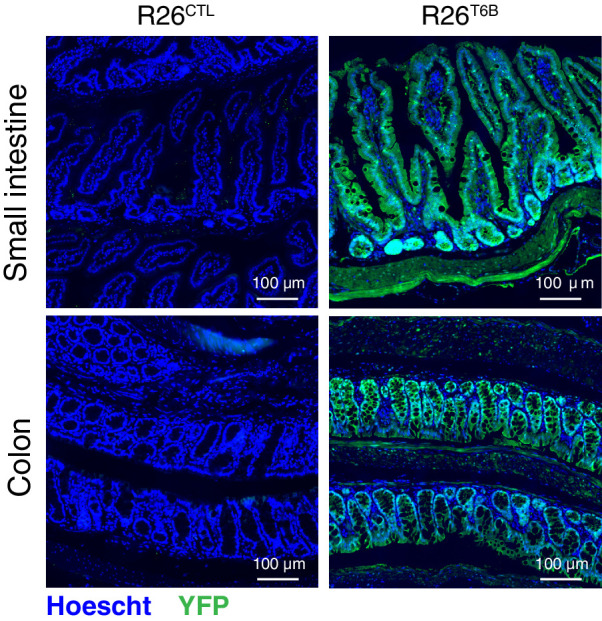
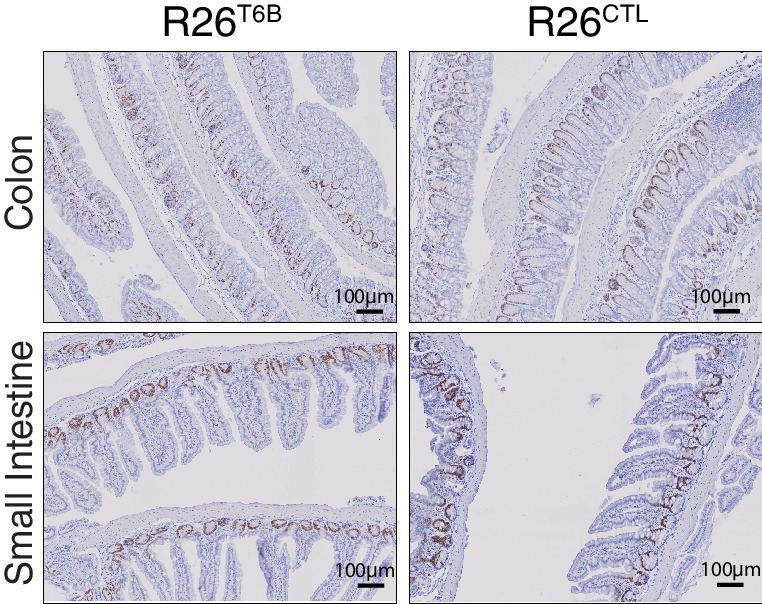
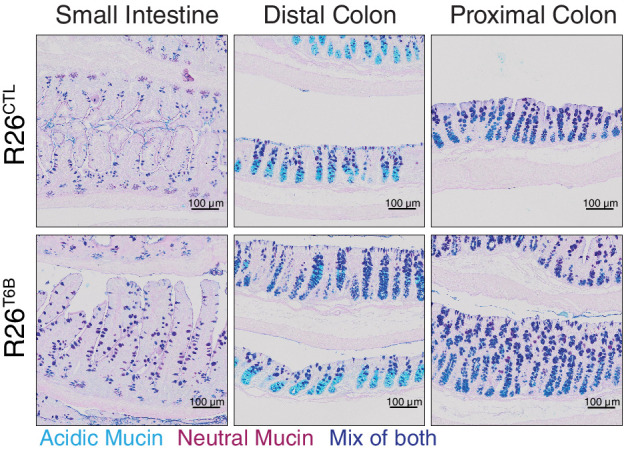
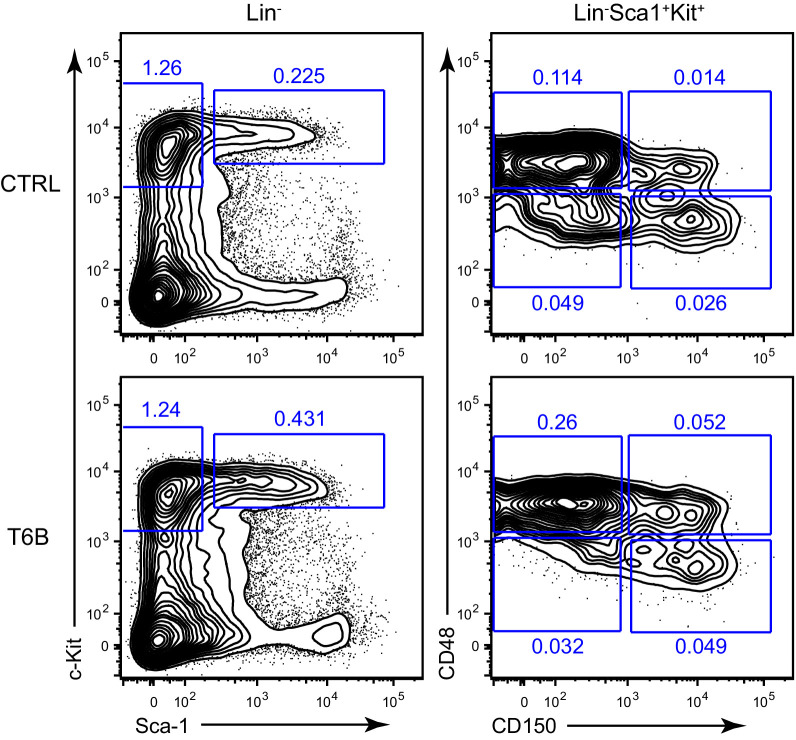
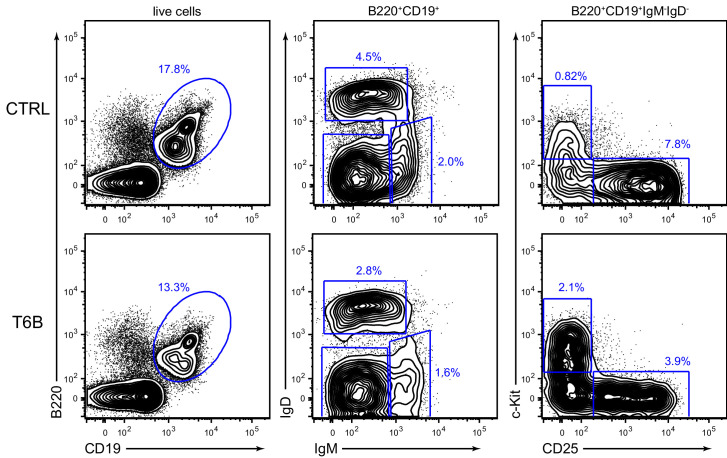
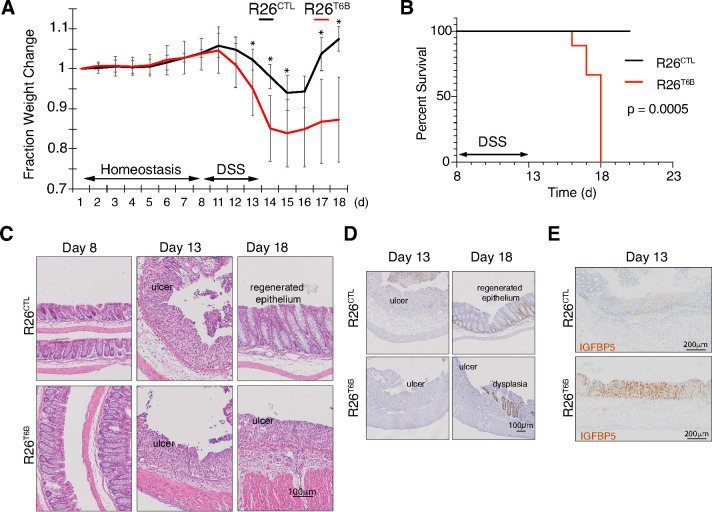
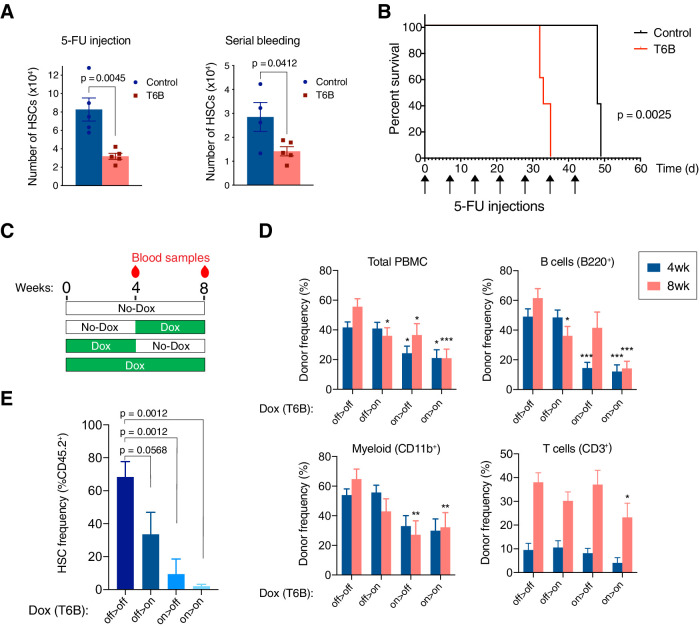
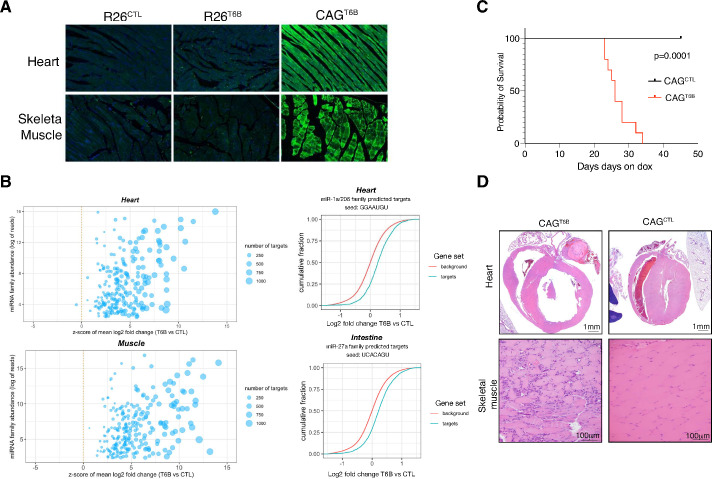
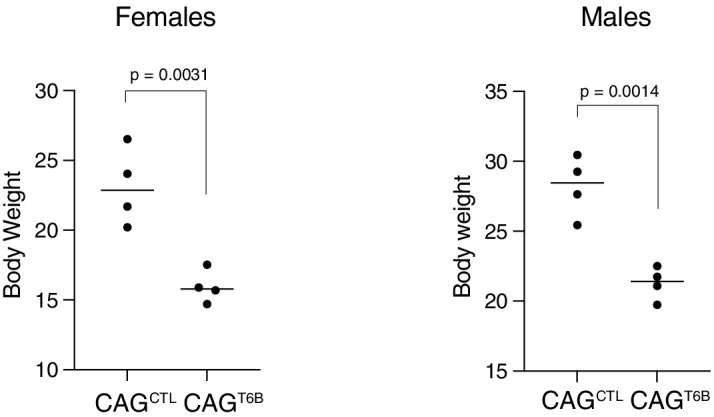
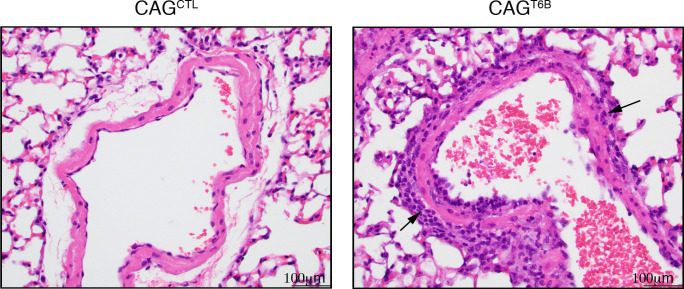
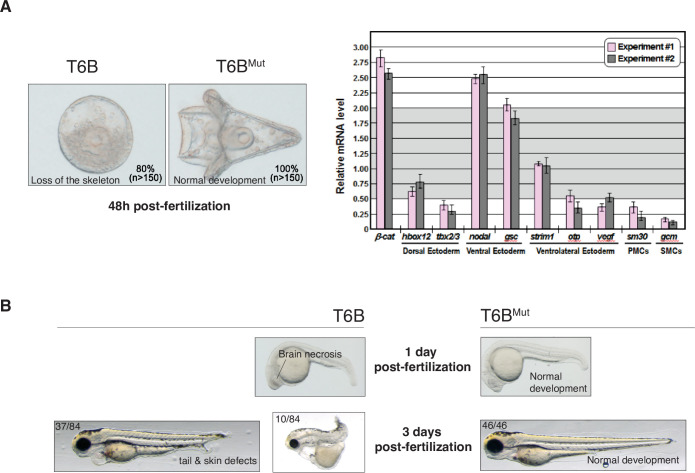
Although virtually all gene networks are predicted to be controlled by miRNAs, the contribution of this important layer of gene regulation to tissue homeostasis in adult animals remains unclear. Gain and loss-of-function experiments have provided key insights into the specific function of individual miRNAs, but effective genetic tools to study the functional consequences of global inhibition of miRNA activity in vivo are lacking. Here we report the generation and characterization of a genetically engineered mouse strain in which miRNA-mediated gene repression can be reversibly inhibited without affecting miRNA biogenesis or abundance. We demonstrate the usefulness of this strategy by investigating the consequences of acute inhibition of miRNA function in adult animals. We find that different tissues and organs respond differently to global loss of miRNA function. While miRNA-mediated gene repression is essential for the homeostasis of the heart and the skeletal muscle, it is largely dispensable in the majority of other organs. Even in tissues where it is not required for homeostasis, such as the intestine and hematopoietic system, miRNA activity can become essential during regeneration following acute injury. These data support a model where many metazoan tissues primarily rely on miRNA function to respond to potentially pathogenic events.

Keywords: RISC; T6B; TNRC6; argonaute; cell biology; miRISC; microRNA; mouse; regenerative medicine; stem cells.


Conflict of interest statement

GL, BK, BS, XL, MZ, KA, PO, CM, KC, VC, YM, VA, DB, JV, TT, GM, TL, KH, AV No competing interests declared, CT is a founder of Agios Pharmaceuticals and a member of its scientific advisory board. He is also a former member of the Board of Directors and stockholder of Merck and Charles River Laboratories. He is a named inventor on patents related to cellular metabolism. Potentially relevant patents on which he is a named inventor include the following: (i) L-2-hydroxyglutarate and stress induced metabolism (United States Patent #10,450,596). (ii) Single diastereomers of 4-fluoroglutamine and methods of their preparation and use (United States Patent #8,747,809). A complete list of patents can be found at the following link: https://tinyurl.com/y35qvajq

Figures

Figure 1.
Figure 1.. T6B fusion protein prevents miRNA-induced silencing complex (miRISC) assembly and impairs microRNA (miRNA) activity in vitro.
(A) Schematics of T6B action: T6B competes with TNRC6 for binding to AGO proteins preventing miRISC assembly. (B) Schematics of the size-exclusion chromatography (SEC) assay for the fractionation of AGO-containing complexes according to their molecular weight. (C) SEC profiling of miRISC components upon T6B expression: total lysates from HCT116 cells expressing no fusion protein (upper panel), T6B (middle panel), or T6BMut (lower panel) were fractionated as described in (B) and immunoblotted to detect AGO2, TNRC6A, T6B, and PABP1. For each blot, the relative signal intensity was assessed by densitometric analysis. (D) RNAseq analysis of total and small RNAs isolated from mouse embryo fibroblasts (MEFs) cell lines expressing either no fusion protein, T6B, or T6BMut (n = 3 for each cell line). Upper panel: bubble plot of target de-repression against miRNA abundance. The mean log2-fold change (T6B or T6BMut vs. control) of predicted targets for each conserved miRNA family was calculated, converted to a z-score and is plotted on the x-axis against the miRNA family abundance (log of the sum of read counts for each member of the family). The size of each circle is proportional to the number of predicted targets. A positive z-score indicates that the targets for that family are preferentially upregulated upon T6B expression, while a negative score would indicate preferential downregulation. Expression of T6B, but not of T6BMut, causes preferential upregulation of miRNA targets of the most miRNA families and the effect is roughly proportional to each miRNA family abundance. Lower panel: cumulative distribution plot of predicted let-7 targets compared to background in T6B-expressing MEFs. (E) Scatter plots of miRNA abundance as determined by small-RNAseq of total RNA extracted from MEFs expressing either T6B or T6BMut (n = 3 for each cell line). Each dot represents a miRNA in miRbase. (F) Effect of T6B expression on AGO2 slicing activity. MEFs expressing either T6B or T6BMut were transfected with siRNAs targeting GAPDH mRNA (siGAPDH) or with scramble siRNA (siCTL). Levels of GAPDH, T6B, and tubulin were assessed by immunoblot 72 hr post-transfection. T6B and T6BMut have slightly different migration on PAGE, as previously observed by Hauptmann et al., 2015.
Figure 1—figure supplement 1.
Figure 1—figure supplement 1.. Sequence and properties of the FH-T6B-YFP fusion protein.
(A) HCTT116 cells transduced with retroviral vectors expressing a doxycycline-inducible T6B or T6BMut transgene (FH-T6B-YFP) were cultured in the presence of doxycycline for 48 hr. Whole-cell lysates were probed with an anti-HA antibody. (B) Lysates from (A) were immunoprecipitated with the indicated antibodies and blotted against AGO2, FH-T6B-YFP (anti-HA), and GAPDH. Note that the T6B fusion protein, but not its mutant version (T6BMut), binds to AGO proteins. Lower panel: amino acid sequence of the T6B and T6BMut fusion proteins. Both T6B versions have HA and FLAG tags at the N termini and are fused to the yellow fluorescent protein (YFP) at the C-termini. In T6BMut, all tryptophan residues (red) are mutated to alanine to prevent interaction with AGO proteins. Blue: FLAG-tag; light blue: HA-tag; bold black: T6B; green: YFP.
Figure 1—figure supplement 2.
Figure 1—figure supplement 2.. Size-exclusion chromatography was performed on whole-cell lysates from mouse embryo fibroblasts transduced with retroviral vectors expressing a doxycycline-inducible T6B or T6BMut transgene and cultured in the presence of doxycycline for 48 hr.
Eluted fractions were probed with the anti-AGO2 or anti-HA antibodies to determine the elution profile of AGO2 and T6B, respectively.
Figure 2.
Figure 2.. Expression of T6B reversibly blocks miRNA-induced silencing complex (miRISC) assembly and inhibits microRNA (miRNA) function in vivo.
(A) Schematic of the targeting strategy to generate the T6B mouse. The construct contains a flippase recognition target site (frt) that allows homing into the Col1a1 locus when electroporated together with a vector expressing the Flippase recombinase into KH2 (Col1a1-frt/Rosa26-rtTA) murine embryonic stem cells. KH2 also express the rtTA trans-activator driven by the endogenous Rosa26 (R26) promoter. (B) Immunofluorescence imaging performed using an anti-YFP antibody, showing T6B expression in a panel of tissues of adult R26T6B mice fed doxycycline for 7 days. Tissues from R26CTL (carrying the rtTA allele but not the T6B allele) were used as negative controls. (C) Protein lysates from the liver of R26T6B mice on or off doxycycline-containing chow for the indicated number of days were resolved by SDS-PAGE and western blotting was performed with anti-HA antibody to detect expression of the T6B transgene. (D) Co-IP experiments using an anti-YFP antibody showing interaction between AGO and T6B in total liver extracts from T6B mice on doxycycline-containing chow. (E) Size-exclusion chromatography (SEC) elution profile of AGO2-containing complexes in liver lysates from T6B mice euthanized at the indicated time points after doxycycline administration. Notice the shift of AGO2 from the high-molecular-weight fractions to the low-molecular-weight fractions after 5 days of doxycycline treatment and the reconstitution of the full miRISC after removal of doxycycline from the diet. (F, G) Total RNA extracted from the large intestine (F) and the liver (G) of R26CTL and R26T6B mice was subjected to RNAseq (n = 3 for each strain). Left panel: scatter plot showing the effect of T6B expression on targets of all miRNA families was generated as described in Figure 1D. The abundance of each miRNA family was calculated using dataset from Isakova et al., 2020. Right panel: representative cumulative distribution plot of log2-fold changes in expression of predicted targets of the indicated miRNA families.
Figure 2—figure supplement 1.
Figure 2—figure supplement 1.. Expression of FH-T6B-YFP fusion protein in targeted ES clones.
(A) Two independent targeted ES clones were cultured in the presence or absence of doxycycline for 48 hr and examined by epifluorescence microscopy to detect FH-T6B-YFP expression. The same exposure was used for all images. Bright-field images are also shown for each clone. (B) Whole-cell lysates from the clones shown in (A) were probed with an anti-HA antibody to detect expression of the T6B fusion protein.
Figure 2—figure supplement 2.
Figure 2—figure supplement 2.. Immunofluorescence imaging using a YFP-specific antibody, showing T6B expression in a panel of tissues of adult R26T6B mice (second column) and CAGT6B mice (third column) fed doxycycline-containing diet for 7 days.
Tissues from R26CTL (first column) mice fed doxycycline-containing diet for 7 days were included as negative controls.
Figure 2—figure supplement 3.
Figure 2—figure supplement 3.. Total extracts from the colon of R26T6B mice kept on doxycycline-containing diet for 1 week were immunoprecipitated using an anti-YFP antibody and probed with the indicated antibodies to measure the interaction between the T6B fusion protein and AGO2 in vivo.
An anti-HA antibody was used to detect T6B.
Figure 2—figure supplement 4.
Figure 2—figure supplement 4.. Size-exclusion chromatography (SEC) fractionation followed by western blotting of total extracts from the liver and large intestine of control and R26T6B mice treated with doxycycline-containing chow for 7 days.
The shift of AGO2 from high-molecular-weight to low-molecular-weight complexes confirms disruption of the miRNA-induced silencing complex.
Figure 3.
Figure 3.. Phenotypic analysis of R26T6B mice during homeostasis.
(A) Rosa26+/+; Col1a1T6B/T6B females were crossed with Rosa26rtTA/+; Col1a1T6B/T6B males and doxycycline was administered by chow starting at 0.5 d.p.c. No viable pups positive for both the rtTA and T6B allele were observed (n = 15, p-value = 0.002, Fisher’s exact test). (B) Pregnant females were kept on doxycycline diet from E13.5 to E18.5 and the pups delivered on E18.5 by c-section. Note the significantly smaller size of Rosa26rtTA/rtTA; Col1a1T6B/T6B embryos relative to Rosa26rtTA/rtTA;Col1a1+/+ control littermates. Lower row: YFP detection by epifluorescence in E18.5 pups of the indicated genotypes. (C) Comparison of intestine architecture in H&E sections from R26T6B and R26CTL mice (n = 3 for each genotype) maintained on doxycycline for 2 months. (D) Immunofluorescence imaging of the small intestine of R26T6B and R26CTL mice (n = 3–5 for each genotype) kept on doxycycline diet for a month (upper row), showing a reduction in lysozyme expression in Paneth cells in the crypts. Lysozyme expression in R26T6B mice returned to normal levels upon removal of doxycycline from the diet (lower row). (E) Peripheral blood analysis conducted in R26T6B and R26CTL mice (R26CTL n = 4; R26T6B n = 5). (F) Flow cytometric analysis of bone marrow of R26T6B and R26CTL mice kept on doxycycline diet for 3 weeks showing developmental block at the Pro-B to Pre-B. p-Values (from left to right): *p=0.0348, **p=0.0023, *p=0.0340, **p=0.0004, unpaired t-test. R26CTL n = 4; R26T6B n = 5. (G) Flow cytometry analysis of the bone marrow of control and R26T6B mice kept on doxycycline diet for 3 weeks. p-Values (from left to right): p=0.0994, **p=0.0092, **p=0.0085, *p=0.0312, unpaired t-test. R26CTL n = 4; R26T6B n = 5.
Figure 3—figure supplement 1.
Figure 3—figure supplement 1.. Effects of FH-T6B-YFP fusion protein expression during development.
(A) Litter obtained by c-section from a pregnant Rosa26rtTA/rtTA; Col1a1T6B/+ female crossed to a Rosa26rtTA/rtTA; Col1a1T6B/+ male and maintained on doxycycline from d.p.c. 13.5 to d.p.c. 18.5. (B) Pups from (A) were weighted and genotyped and the results plotted. p-Value: two-tailed unpaired t-test.
Figure 3—figure supplement 2.
Figure 3—figure supplement 2.. Immunofluorescence imaging of the small and large intestine of R26T6B and R26CTL mice kept on doxycycline diet for a month.
An antibody against YFP was used to detect the T6B fusion protein.
Figure 3—figure supplement 3.
Figure 3—figure supplement 3.. Sections from the colon and small intestine sections of R26T6B and control mice kept on doxycycline-containing diet for 2 months were probed by immunohistochemistry with an anti-Ki67 antibody.
Figure 3—figure supplement 4.
Figure 3—figure supplement 4.. Detection of goblet cells by staining of acidic and neutral mucins in intestine sections from R26T6B and control mice kept on doxycycline diet for 2 months.
Neutral mucins are stained with periodic acid-Shiff, whereas acidic mucins are stained with Alcian blue.
Figure 3—figure supplement 5.
Figure 3—figure supplement 5.. Body weight of R26T6B (n = 5) and control (n = 8) female mice was assessed after 2-month administration of doxycycline-containing chow.
ns, not significant (p=0. 6264, unpaired t-test).
Figure 3—figure supplement 6.
Figure 3—figure supplement 6.. Representative flow cytometry plots showing the gating strategy for the identification of hematopoietic stem and progenitor cells from whole bone marrow harvested from R26T6B and R26CTL mice maintained on doxycycline diet for 3 weeks.
LT-HSC: Lin- Kit+ Sca1+ CD150+ CD48-; ST-HSC: Lin- Kit+ Sca1+ CD150- CD48-; MPP2: Lin- Kit+ Sca1+ CD150+ CD48+; MPP3/4: Lin- Kit+ Sca1+ CD150 CD48+.
Figure 3—figure supplement 7.
Figure 3—figure supplement 7.. Representative flow cytometry plots showing the gating strategy for the identification of B cell lineage populations from whole bone marrow harvested from R26T6B and R26CTL mice maintained on doxycycline diet for 3 weeks.
Pro-B: B220+ CD19+ IgD-IgM-CD25-Kit+; Pre-B: B220+ CD19+ IgD-IgM-CD25+; Imm B: B220+ CD19+ IgD-IgM+; Mat B: B220+ CD19+ IgD + IgM+/lo.
Figure 4.
Figure 4.. T6B-induced block of miRNA-induced silencing complex (miRISC) assembly leads to impaired intestinal regeneration.
(A) R26T6B and R26CTL mice (n = 6 for each genotype) kept on doxycycline diet were treated with dextran sulfate sodium (DSS) for 5 days to induce inflammatory colitis and their weight was monitored daily. Data are presented as mean ± SD. p-Values (from left to right): *p=0.034, *p=0.005, *p=0.029, *p=0.024, *p=0.011, from unpaired t-test. (B) Kaplan–Meier curves of animals treated with DSS as described in panel (A). p-Value from log-rank test (C) Representative hematoxylin-eosin-stained sections of intestine of R26T6B and R26CTL mice (n = 3 for each genotype) at different time points pre- and post-DSS treatment. (D) Ki67 immunostaining of section of intestine at the indicated time points. (E) Sections from the large intestine of control and T6B mice euthanized at day 13 were subjected to RNA in situ hybridization with a probe against the IGFBP5 transcript. The results show increased levels of IGFBP5 mRNA in ulcerated areas of R26T6B as compared to controls (n = 4 for each genotype).
Figure 4—figure supplement 1.
Figure 4—figure supplement 1.. Bar plots showing measurement of colon length, aggregated length of ulcers, percentage of colon with ulcers, area of ulcers, number of immune nodules, and the area of immune nodules performed on H&E longitudinal sections of colon from R26CTL and R26T6B mice 5 days post-dextran sulfate sodium (DSS) treatment.
Measurements of these parameters were obtained using OMERO (https://www.openmicroscopy.org/omero/) and used to estimate the extent of damage and colitis induced by DSS treatment. Plots show that no significant differences between R26CTL and R26T6B mice were observed, suggesting that both groups experienced similar level of DSS-induced colitis.
Figure 4—figure supplement 2.
Figure 4—figure supplement 2.. Representative immunohistochemistry image showing Ki67 signal in control mice (n = 3) 5 days after dextran sulfate sodium (DSS) treatment was discontinued.
The presence of highly proliferating cells indicates residual dysplasia.
Figure 5.
Figure 5.. T6B-induced block of miRNA-induced silencing complex (miRISC) assembly impairs the regeneration of the hematopoietic system.
(A) Long-term hematopoietic stem cell (HSC) in the bone marrow of R26T6B and R26CTL mice treated with 5-fluorouracil (5-FU) or subjected to repeated bleeding (n = 5 for each genotype). Mice were maintained on doxycycline-containing diet throughout the experiment. (B) Kaplan–Meier plots of R26T6B (n = 5) and R26CTL (n = 5) mice treated weekly with 5-FU for 7 weeks. (C) Schematic of the bone marrow transplantation experiments: T6B was induced at different time points post-transplantation, and multilineage reconstitution was assessed at the indicated time points by FACS. (D) FACS analysis conducted on the peripheral blood of irradiated recipients transplanted 1:1 with T6B-expressing and wild-type bone marrow, and maintained on doxycycline diet according to scheme shown in panel (C). Data are presented as mean ± SD. *p<0.05, **p<0.01, ***p<0.001, one-way ANOVA. off > off, n = 9; off > on, n = 10; on > off, n = 8; on > on, n = 8. (E) FACS analysis showing the frequency of T6B-extressing HSCs in the bone marrow of transplanted recipient mice kept on doxycycline diet according to scheme shown in panel (C). off > off, n = 5; off > on, n = 5; on > off, n = 4; on > on, n = 5, one-way ANOVA.
Figure 6.
Figure 6.. The microRNA (miRNA) pathway is essential in heart and skeletal muscle during homeostasis.
(A) Detection of T6B expression with an anti-YFP antibody in the heart and skeletal muscle of R26T6B, CAGT6B, and R26CTL mice maintained on doxycycline-containing diet for 7 days. (B) Total RNA extracted from the heart (upper panel) and the skeletal muscle (lower panel) of CAGCTL and CAGT6B mice (n = 3 for each strain) maintained on dox for 7 days was analyzed by RNAseq. Left panels: scatter plot showing the effect of T6B expression on targets of conserved miRNA families was generated as described in Figure 1D. The abundance of each miRNA family was calculated using dataset from Isakova et al., 2020. Right panels: representative cumulative distribution plot of log2-fold changes in expression of predicted targets of the indicated miRNA families. (C) Kaplan–Meier curves of CAGT6B and CAGCTL mice (n = 8 for each genotype) maintained on doxycycline throughout the duration of the experiment. p-Value from log-rank test. (D) Upper row: representative H&E staining showing marked dilation of the four cardiac chambers in hearts of CAGT6B mice compared to controls (n = 9 for each genotype). Despite having thinner walls, the histomorphology of ventricular cardiomyofibers was within normal limits. Bottom row: representative H&E staining showing degenerative and regenerative changes in the skeletal muscle of the hind limbs of CAGT6B mice compared to controls (n = 9 for each genotype).
Figure 6—figure supplement 1.
Figure 6—figure supplement 1.. Body weight of CAGT6B and control mice maintained on doxycycline for up to 45 days was assessed the day on which euthanasia was performed.
n = 8 (four females and four males) for each genotype (age and sex matched). Mice were kept on doxycycline diet throughout the duration of the experiment, and control mice were euthanized at day 45. P-values: unpaired t-test.
Figure 6—figure supplement 2.
Figure 6—figure supplement 2.. Representative H&E staining showing vasculitis of the pulmonary veins as revealed by inflammatory immune cell infiltration of the vessel wall (arrows).
Figure 6—figure supplement 3.
Figure 6—figure supplement 3.. T6B blocks miRNA activity in sea urchins and zebrafish.
(A) Left panel: representative examples of Mediterranean sea urchin (Paracentrotus lividus) zygotes injected with 1 pg of in vitro-transcribed mRNA coding for either T6B or T6BMut proteins and observed under DIC optics at 48 hr post-fertilization. Both embryos are oriented in a vegetal view. T6B-expressing embryos displayed severe developmental aberrations ranging from the failure to form a proper archenteron and skeletal structures, to overall delay in development and embryonic lethality. By contrast, control T6BMut-expressing embryos observed at the same developmental stage went through embryogenesis normally and exhibited the characteristic easel-like shape of the echinoid pluteus larva. Right panel: quantitative PCR showing dysregulation of territorial marker genes involved in the developmental gene regulatory network of the sea urchin (Cavalieri and Spinelli, 2015a, Cavalieri and Spinelli, 2015b) upon T6B expression. Data are indicated as fold difference in transcript abundance with respect to control T6BMut-expressing embryos at the same stage of development. The gray region represents changes in mRNA abundance corresponding to less than threefold difference, while error bars are standard errors for the qPCR replicates. PMCs: primary mesenchyme cells; SMCs: secondary mesenchyme cells. (B) Zebrafish (Danio rerio) fertilized eggs were injected with 75 pg of in vitro-transcribed mRNA coding for either T6B or T6BMut fusion proteins. While T6BMut-expressing embryos developed normally, the majority of T6B-expressing embryos underwent severe developmental defects.
Scheme 1.
Scheme 1.. Cloning strategy for the generation of the targeting vector expressing the FH-T6B-YFP transgene.

References

    1. Abdellatif M. Differential expression of microRNAs in different disease states. Circulation Research. 2012;110:638–650. doi: 10.1161/CIRCRESAHA.111.247437. - DOI - PMC - PubMed
    1. Ambros V, Horvitz HR. Heterochronic mutants of the nematode Caenorhabditis elegans . Science. 1984;226:409–416. doi: 10.1126/science.6494891. - DOI - PubMed
    1. Bartel DP. MicroRNAs: Target Recognition and Regulatory Functions. Cell. 2009;136:215–233. doi: 10.1016/j.cell.2009.01.002. - DOI - PMC - PubMed
    1. Bartel DP. Metazoan MicroRNAs. Cell. 2018;173:20–51. doi: 10.1016/j.cell.2018.03.006. - DOI - PMC - PubMed
    1. Beard C, Hochedlinger K, Plath K, Wutz A, Jaenisch R. Efficient method to generate single-copy transgenic mice by site-specific integration in embryonic stem cells. Genesis. 2006;44:23–28. doi: 10.1002/gene.20180. - DOI - PubMed

Publication types

Associated data