. 2020 Feb 11:9:e41279.
doi: 10.7554/eLife.41279.

Synthetic and genomic regulatory elements reveal aspects of cis-regulatory grammar in mouse embryonic stem cells

Affiliations

Synthetic and genomic regulatory elements reveal aspects of cis-regulatory grammar in mouse embryonic stem cells

Dana M King et al. Elife. .

Abstract

In embryonic stem cells (ESCs), a core transcription factor (TF) network establishes the gene expression program necessary for pluripotency. To address how interactions between four key TFs contribute to cis-regulation in mouse ESCs, we assayed two massively parallel reporter assay (MPRA) libraries composed of binding sites for SOX2, POU5F1 (OCT4), KLF4, and ESRRB. Comparisons between synthetic cis-regulatory elements and genomic sequences with comparable binding site configurations revealed some aspects of a regulatory grammar. The expression of synthetic elements is influenced by both the number and arrangement of binding sites. This grammar plays only a small role for genomic sequences, as the relative activities of genomic sequences are best explained by the predicted occupancy of binding sites, regardless of binding site identity and positioning. Our results suggest that the effects of transcription factor binding sites (TFBS) are influenced by the order and orientation of sites, but that in the genome the overall occupancy of TFs is the primary determinant of activity.

Keywords: computational biology; gene expression; mouse; pluripotency; systems biology; transcription factors.

Plain language summary

Transcription factors are proteins that flip genetic switches; their role is to control when and where genes are active. They do this by binding to short stretches of DNA called cis-regulatory sequences. Each sequence can have several binding sites for different transcription factors, but it is largely unclear whether the transcription factors binding to the same regulatory sequence actually work together. It is possible that each transcription factor may work independently and there only needs to be critical mass of transcription factors bound to throw the genetic switch. If this is the case, the most important features of a cis-regulatory sequence should be the number of binding sites it contains, and how tightly the transcription factors bind to those sites. The more transcription factors and the more strongly they bind, the more active the gene should be. An alternative option is that certain transcription factors may work better together, enhancing each other's effects such that the total effect is more than the sum of its parts. If this is true, the order, orientation and spacing of the binding sites within a sequence should matter more than the number. One way to investigate to distinguish between these possibilities is to study mouse embryonic stem cells, which have a core set of four transcription factors. Looking directly at a real genome, however, can be confusing and it is difficult to measure the effects of different cis-regulatory sequences because genes differ in so many other ways. To tackle this problem, King et al. created a synthetic set of cis-regulatory sequences based on the four core transcription factors found in mouse stem cells. The synthetic set had every combination of two, three or four of the binding sites, with each site either facing forwards or backwards along the DNA strand. King et al. attached each of the synthetic cis-regulatory sequences to a reporter gene to find out how well each sequence performed. This revealed that the cis-regulatory sequences with the most binding sites and the tightest binding affinities work best, suggesting that transcription factors mainly work independently. There was evidence of some interaction between some transcription factors, because, of the synthetic sequences with four binding sites, some worked better than others, and there were patterns in the most effective binding site combinations. However, these effects were small and when King et al. went on to test sequences from the real mouse genome, the most important factor by far was the number of binding sites. Synthetic libraries of DNA sequences allow researchers to examine gene regulation more clearly than is possible in real genomes. Yet this approach does have its limitations and it is impossible to capture every type of cis-regulatory sequence in one library. The next step to extend this work is to combine the two approaches, taking sequences from the real genome and manipulating them one by one. This could help to unravel the rules that govern how cis-regulatory sequences work in real cells.


Conflict of interest statement

DK, CH, JS, DG, BM, BC No competing interests declared

Figures

Figure 1.
Figure 1.. Activity of synthetic elements and genomic sequences.
(A) The activity of synthetic elements with different numbers of binding sites. Expression is the average log of the ratio of cDNA barcode counts/DNA barcode counts for each synthetic element normalized to basal expression (dotted line). (B) The activity of genomic sequences is largely dependent on the presence of pluripotency binding sites. Normalized expression of wild type (gWT) sequences is plotted against expression of matched sequences with all three pluripotency TFBS mutated (gMUT sequences). Red indicates sequences with significantly different expression between matched gWT and gMUT sequences. The diagonal solid line is the expectation if mutation of TFBS had no impact on expression level. Expression of both gWT and gMUT sequences are normalized to basal controls, but basal expression is only plotted for gWT sequences on the y-axis (dotted line).
Figure 1—figure supplement 1.
Figure 1—figure supplement 1.. Pluripotency motif substitutions for gMUT sequences.
Highest information content positions in each motif were substituted with least frequent nucleotide for that position. (A) For mutating Sox2 motifs, the reference nucleotides were substituted for ‘A’ in position 4 and 5. (B) For mutating Oct4 motifs, the reference nucleotide was substituted for ‘C’ in position 2 and for ‘A’ in position 3. (C) For mutating Esrrb motifs, the reference nucleotide was substituted for ‘C’ in position five and ‘A’ for position 7. (D) For mutating Klf4 motifs, the reference nucleotide was substituted for ‘A’ in position three and ‘C’ in position 5.
Figure 1—figure supplement 2.
Figure 1—figure supplement 2.. MPRA data quality.
Reproducibility of barcode (BC) counts between biological replicates, normalized as reads per million per RNA replicate for (A) Synthetic library and (B) Genomic, gWT and gMUT, library. Comparison of normalized BC expression (BCRNA/BCDNA) versus DNA counts for (C) Synthetic library and (D) Genomic, gWT and gMUT, library.
Figure 2.
Figure 2.. Non-additivity in synthetic elements.
(A) Comparison of synthetic 3-mer elements with matched 4-mer elements containing one additional site in the first or fourth position. Mean expression of elements across barcodes (black dot) is plotted +/- SEM (black whiskers). Green line for comparison to expression of 3-mer; Green transparency highlights SEM of 3-mer shown. Capital letter represents binding site in forward orientation and lower-case letter represents binding site in reverse orientation. Activity of the ten highest (B) and ten lowest (C) expressing 4-mers. Red line represents average expression of all synthetic 4-mer elements. Case represents binding site orientation as in (A) Mean expression of each element across barcodes (black dot) +/- SEM (black whiskers). Activity logos for the top 25% (n = 96) (D) and bottom 25% (E) of 4-mer synthetic elements. Height of letter is proportional to frequency of site in indicated position. Positions organized from 5’ end (Position 1) to 3’ end (Position 4) of elements.
Figure 2—figure supplement 1.
Figure 2—figure supplement 1.. Additional examples of non-additivity in synthetic elements.
Comparisons of synthetic 3-mer elements with matched 4-mer elements containing one additional site in the first or fourth position with (A) three of four matched 4-mers with overlapping expression despite an additional binding site and (B) one of four matched 4-mers with overlapping expression. Activity logos for the top 25% (C), bottom 25% (D) of 3-mer synthetic elements (n = 48 each), and top 25% (E) and bottom 25% (F) of 2-mer synthetic elements (n = 12 each). Height of letter is proportional to frequency of site in indicated position. Positions organized as in Figure 2.
Figure 3.
Figure 3.. Positional grammar in synthetic elements.
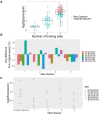
(A) Iterative random forest (iRF) regression model that includes features for presence and position of pluripotency TFBS predicts relative expression of synthetic elements. Number of binding site per element is indicated in pink (2-mers), green (3-mers), and blue (4-mers). Observed and predicted expression are both plotted in log2 space. (B) Ranking of variables in synthetic iRF model. Variable importance is estimated by Increased Node Purity (IncNodePurity), the decrease in node impurities from splitting on that variable, averaged over all trees during training.
Figure 3—figure supplement 1.
Figure 3—figure supplement 1.. Comparison of synthetic and genomic patterns of transcription factor binding sites (TFBS).
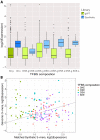
(A) Expression (log2) of all synthetic (dark blue) and gWT (dark green) library members subset by TFBS composition (light blue and light green, respectively). (B) Expression (log2) of synthetic (x-axis) and gWT (y-axis) library members, matched by composition and order of binding sites for OCT4 (O), SOX2 (S), KLF4 (K), and ESRRB (E). Subsets of TFBS composition indicated by color. Gray line indicates x-y diagonal as axis scales differ.133.
Figure 3—figure supplement 2.
Figure 3—figure supplement 2.. Additive effects in synthetic elements.
Iterative random forest (iRF) regression model that includes features for only presence of pluripotency TFBS to predict the relative expression of held out test set of synthetic elements. Number of binding site per element indicated as in Figure 3. Observed and predicted expression are both plotted in log2 space.
Figure 3—figure supplement 3.
Figure 3—figure supplement 3.. Effect of spacer sequences between TFBS on synthetic 4-mer expression.
(A) Expression of sequences in ‘mini spacer’ library with different binding sites. (B) Difference in expression between each 4-mer oligo with new spacer and the original spacer. (C) Expression of each 4-mer oligo with original and new spacers. The numbers next to each point indicate the expression rank of each oligo with its original spacer, with one being the highest expressed and six being the lowest.
Figure 4.
Figure 4.. Sequence features separate active and inactive genomic sequences.
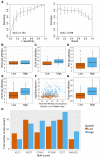
(A) Performance of gkm-SVM for genomic sequences supports contribution of sequence-based features to activity. Word length of 8 bp with gap size of 2 bp was used for training with threefold cross validation. ROC curve (left panel) and PR curve (right panel) is plotted for the average across threefold cross-validation sets +/- standard deviation. (B–E) Primary (O,S,K,E) site affinities across gWT sequences, as output during motif scanning plotted for high genomic sequences (top 25% as ranked by expression, n = 101) and low genomic sequences (bottom 25% as ranked by expression, n = 101). (F–G) Total site affinities is calculated per sequence by summing the predicted affinity of the three primary sites present in each sequence. (H) Total number of occurrences of TFBS for additional TFs in high and low sequences (stratified as in B–G), as determined by motif scanning, excluding primary (O,S,K,E) sites.
Figure 4—figure supplement 1.
Figure 4—figure supplement 1.. Predicted occupancy of genomic sequences.
Predicted occupancy (P(Occ)) for genomic sequences in the absence of the primary pluripotency sites (gMUT sequences) for high assumed protein concentration (mu) for SOX2 (mu = 8), OCT4 (mu = 10), KLF4 (mu = 8), and ESRRB (mu = 8) shown in middle and right panels. Summed P(Occ) of all factors per gMUT sequence, compared to expression (top left panel) or binned as low or high library members (bottom 25% and top 25% of sequences, ranked by gWT expression, n = 101).
Figure 4—figure supplement 2.
Figure 4—figure supplement 2.. Genomic sequences show distance preferences between factors.
Comparison of fraction of sequences (density) with designated edge to edge spacing between S, O, K, and E sites. Site positions outputted by scanning high (top 25% as ranked by gWT expression, n = 101) and low (bottom 25% as ranked by gWT expression, n = 101) sequences. Top two panels show fraction of sequences with indicated distances between site positions relative to the promoter, regardless of identity. Bottom six panels show fraction of sequences with indicated distances between adjacent sites, accounting for site identities.
Figure 5.
Figure 5.. Activity of genomic sequences scales with increased occupancy in the genome.
Expression of elements binned by number of intersected ChIP-seq peak signals for different factors. Number of sequences in each bin indicated in center of boxplot. All gWT sequences overlapped at least one ChIP-seq peak as per library design.
Figure 5—figure supplement 1.
Figure 5—figure supplement 1.. Genomic sequences show signatures for other factors.
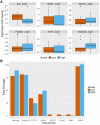
(A) Summed motif scores for indicated motif across genomic sequences, excluding primary pluripotency sites. Site scores output during motif scanning of high (top 25% as ranked by gWT expression, n = 101) and low (bottom 25% as ranked by gWT expression, n = 101) gMUT sequences to prevent scoring of O, S, K, or E TFBS sequences. (B) Overlapping TF occupancy, as measured by ChIP-seq, or accessibility, as measured by ATAC-seq, for high (top 25% as ranked by gWT expression, n = 101) and low (bottom 25% as ranked by gWT expression, n = 101) genomic sequence intervals.
Figure 6.
Figure 6.. Performance of iRF classification models that include features specific to genomic sequences.
(A) ROC Curve and (B) Precision-Recall (PR) Curve comparing genomic iRF models. Color indicates set of features used to train model. (C) Variable importance as evaluated for the feature by the average reduction in the Gini index (Chen et al., 2008c).

References

    1. Bailey TL, Boden M, Buske FA, Frith M, Grant CE, Clementi L, Ren J, Li WW, Noble WS. MEME SUITE: tools for motif discovery and searching. Nucleic Acids Research. 2009;37:W202–W208. doi: 10.1093/nar/gkp335. - DOI - PMC - PubMed
    1. Basu S, Kumbier K, Brown JB, Yu B. Iterative random forests to discover predictive and stable high-order interactions. PNAS. 2018;115:1943–1948. doi: 10.1073/pnas.1711236115. - DOI - PMC - PubMed
    1. Chambers I, Tomlinson SR. The transcriptional foundation of pluripotency. Development. 2009;136:2311–2322. doi: 10.1242/dev.024398. - DOI - PMC - PubMed
    1. Chaudhari HG, Cohen BA. Local sequence features that influence AP-1 cis-regulatory activity. Genome Research. 2018;28:171–181. doi: 10.1101/gr.226530.117. - DOI - PMC - PubMed
    1. Chen CT, Gottlieb DI, Cohen BA. Ultraconserved elements in the Olig2 promoter. PLOS ONE. 2008a;3:e3946. doi: 10.1371/journal.pone.0003946. - DOI - PMC - PubMed

Associated data