. 2008 Jul 25;134(2):291-303.
doi: 10.1016/j.cell.2008.05.044.

An elt-3/elt-5/elt-6 GATA transcription circuit guides aging in C. elegans

Affiliations

An elt-3/elt-5/elt-6 GATA transcription circuit guides aging in C. elegans

Yelena V Budovskaya et al. Cell. .

Abstract

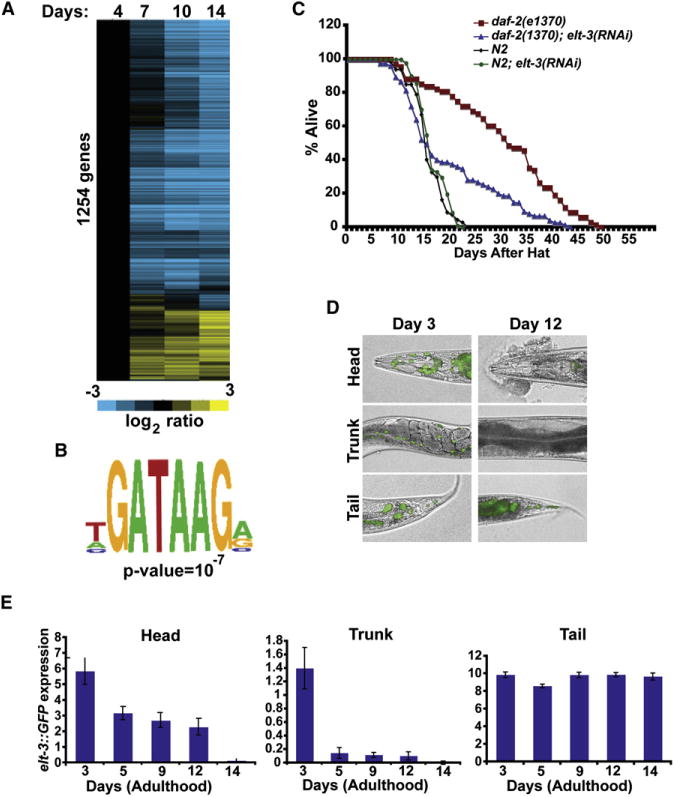
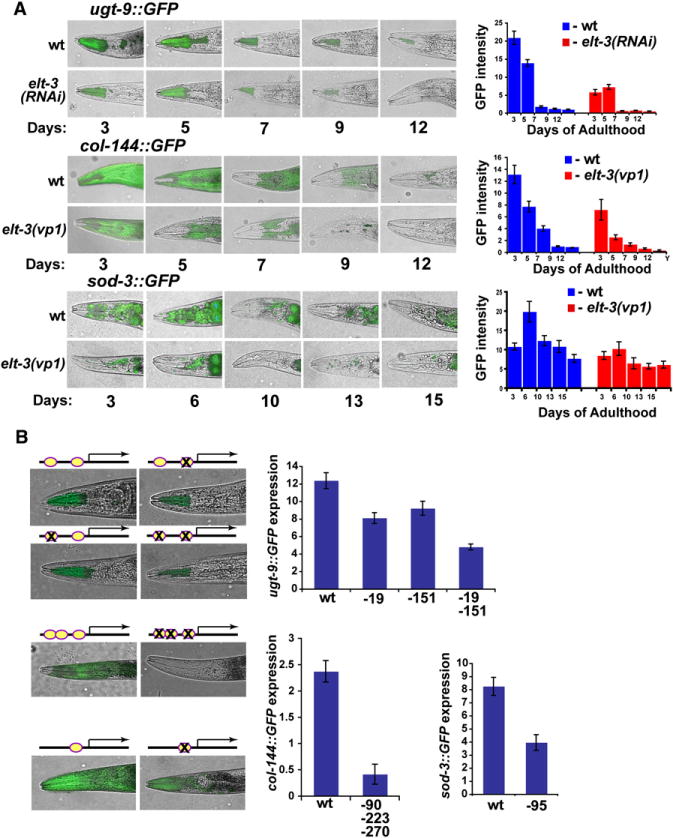
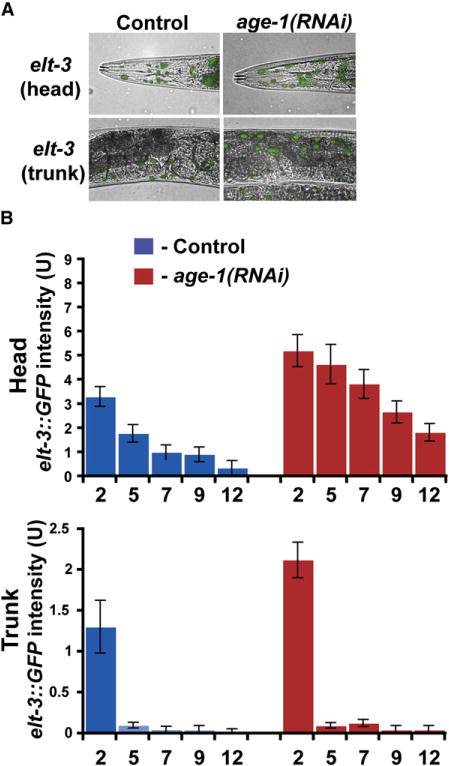
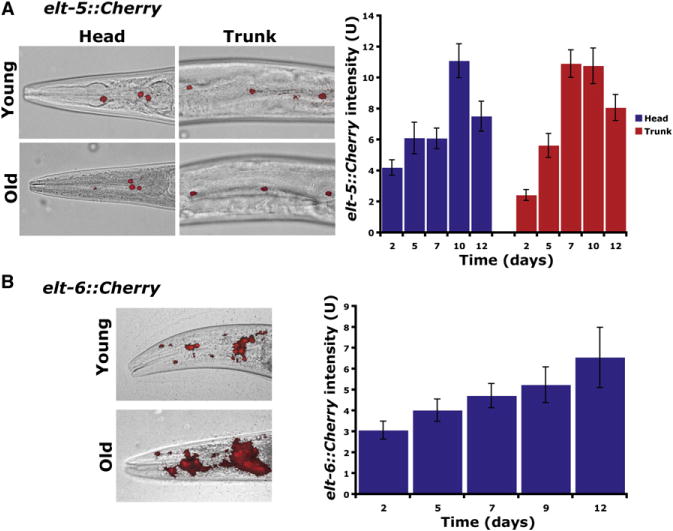
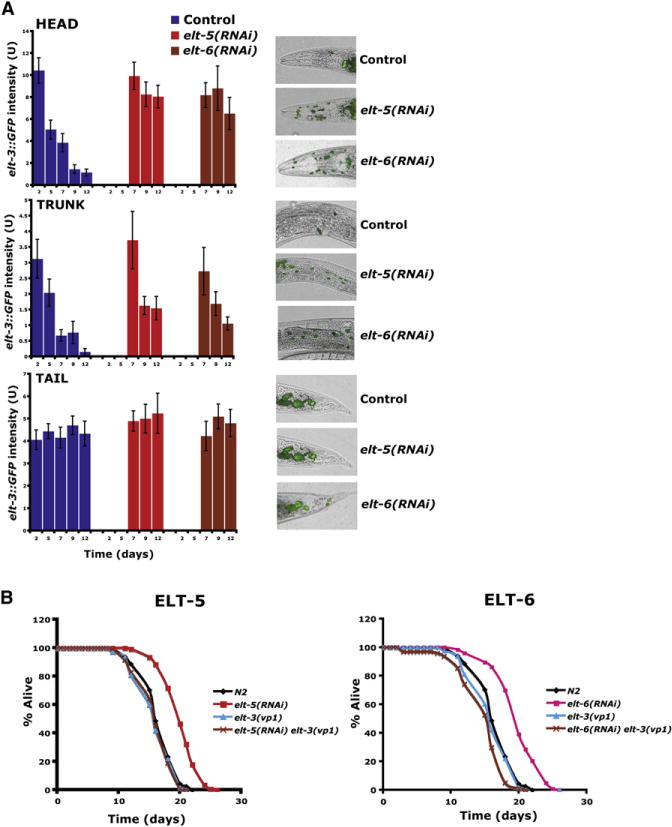
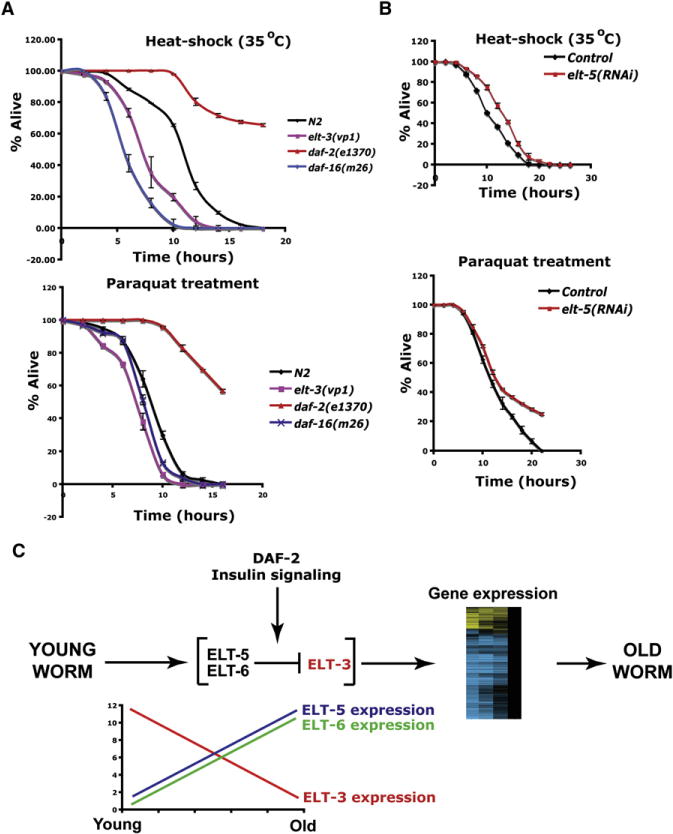
To define the C. elegans aging process at the molecular level, we used DNA microarray experiments to identify a set of 1294 age-regulated genes and found that the GATA transcription factors ELT-3, ELT-5, and ELT-6 are responsible for age regulation of a large fraction of these genes. Expression of elt-5 and elt-6 increases during normal aging, and both of these GATA factors repress expression of elt-3, which shows a corresponding decrease in expression in old worms. elt-3 regulates a large number of downstream genes that change expression in old age, including ugt-9, col-144, and sod-3. elt-5(RNAi) and elt-6(RNAi) worms have extended longevity, indicating that elt-3, elt-5, and elt-6 play an important functional role in the aging process. These results identify a transcriptional circuit that guides the rapid aging process in C. elegans and indicate that this circuit is driven by drift of developmental pathways rather than accumulation of damage.


Figures

Figure 1
Figure 1. An elt-3 Transcriptional Circuit for Aging
(A) Shown are the log2 average expression levels of 1254 age-regulated genes during aging, normalized to expression on day 4. Rows show age-regulated genes and columns at different aging time points (days of adulthood). Full data showing genes and experimental values for this figure can be found in Table S3. The expression results from this aging time course show a Pearson correlation of 0.429 with results from a similar DNA microarray experiment on aging previously by Lund et al., indicating that the two experiments were generally similar (Table 1A) (Lund et al., 2002). Full DNA microarray data set can be found at http://cmgm.stanford.edu/∼kimlab/elt3/index.html. (B) A GATA regulatory element that is significantly enriched in the upstream regions of the age-regulated genes was identified using the CompareProspector program (Liu, 2005). (C) elt-3(RNAi) treatment specifically suppresses the life span extension of daf-2(e1370) mutants (p < 0.001). (D) Expression of elt-3::GFP declines with age in a tissue-specific manner. Shown are adult animals 3 days and 12 days after adulthood. The GFP images were merged with Nomarski images. (E) Expression levels of elt-3::GFP during aging were calculated by measuring pixel intensity from GFP images using ImageJ. The y axis denotes GFP expression (arbitrary units), and the x axis denotes days of adulthood. Average expression and SD from 20 animals are shown.
Figure 2
Figure 2. Expression of ugt-9::GFP, col-144::GFP, and sod-3::GFP Is Regulated by Age and by elt-3
(A) Expression of ugt-9::GFP, col-144::GFP, and sod-3::GFP. (Left) An aging time course of GFP expression merged on Nomarski images for wild-type and elt-3(RNAi) or elt-3(vp1) mutants. (Right) Quantification of GFP expression from 20 worms. (B) The GATA sequence in the promoters of ugt-9, col-144, and sod-3 was mutated and used to generate transgenic GFP reporter strains. (Left) GFP images/Nomarski of wild-type and mutated promoters. Ovals indicate GATA consensus binding sites, and “X” indicates mutation in the GATA site. (Right) Quantification of GFP expression from 20 animals. Numbers refer to the nucleotide position of the GATA site in the upstream region. Error bars represent the SEM pixel intensities.
Figure 3
Figure 3. Regulation of elt-3 GATA by age-1
(A) GFP expression of elt-3 in wild-type and age-1(RNAi) animals at day 3 of adulthood. Images show expression in the head and trunk regions. age-1(RNAi) results in increased elt-3 GATA expression in the head and trunk hypodermal cells but not in intestinal-rectal valve cells and the tail hypodermis. (B) Quantification of levels of elt-3::GFP expression from 20 worms in wild-type and age-1(RNAi) mutants at five times during aging. Expression levels were determined in the head area of the worm by measuring pixel intensity from GFP images. Error bars represent the SEM pixel intensities.
Figure 4
Figure 4. Age Regulation of elt-5 and elt-6
(A) Expression of elt-5::Cherry. (Left) Expression in young (2 days of adulthood) and old (12 days of adulthood) worms. (Right) Quantification of expression levels by measuring pixel intensity from Cherry images using ImageJ. The y axis denotes Cherry expression (arbitrary units), and the x axis denotes days of adulthood. Average expression and SE from 20 animals are shown. (B) Expression of elt-6::Cherry. Error bars represent the SEM pixel intensities.
Figure 5
Figure 5. Effect of elt-5(RNAi) and elt-6(RNAi) on elt-3 Expression and Longevity
(A) elt-3::GFP expression is increased in elt-5(RNAi) or elt-6(RNAi) animals. RNAi was induced starting at day 5 of adulthood by feeding worms bacteria expressing dsRNA. elt-3::GFP expression was measured starting at day 7. The y axis denotes GFP expression (arbitrary units). Average expression and SE from 20 animals are shown. (B) elt-5(RNAi) or elt-6(RNAi) extends life span compared to N2, and this longevity effect is suppressed by elt-3(vp1) (p < 0.0001). Error bars represent the SEM pixel intensities.
Figure 6
Figure 6. Contrasting Functions of elt-3 and elt-5 in Thermotolerance and Resistance to Oxidative Stress
(A) elt-3(vp1) animals are more sensitive than wild-type to heat shock or oxidative stress. Shown are survival comparisons of elt-3(vp1), wild-type, daf-2(e1370) (a control known to show resistance), and daf-16(m26) (a control known to be sensitive to stress) worms under acute thermal stress at 35°C and under oxidative stress (paraquat, 100 mM). (B) elt-5(RNAi) animals are more resistant to heat shock and paraquat treatment than wild-type animals. (C) Model for transcriptional changes during aging. Expression of elt-5 GATA and elt-6 GATA increases as worms age, leading to increased repression of elt-3 in old worms. Changes in the elt-3 GATA transcription factor activate a cascade of downstream changes in expression of 1254 age-regulated genes in old age. Expression of elt-3 is also controlled by the insulin-like signaling pathway.

Comment in

References

    1. Anson RM, Hansford RG. Mitochondrial influence on aging rate in Caenorhabditis elegans. Aging Cell. 2004;3:29–34. - PubMed
    1. Apfeld J, Kenyon C. Regulation of lifespan by sensory perception in Caenorhabditis elegans. Nature. 1999;402:804–809. - PubMed
    1. Aviv A. Telomeres and human aging: facts and fibs. Sci Aging Knowledge Environ. 2004;2004:pe43. - PubMed
    1. Ayub K, Hallett MB. Signalling shutdown strategies in aging immune cells. Aging Cell. 2004;3:145–149. - PubMed
    1. Blasco MA. The epigenetic regulation of mammalian telomeres. Nat Rev Genet. 2007;8:299–309. - PubMed

Publication types

MeSH terms

Substances

Associated data