. 2008 Sep;20(9):2293-306.
doi: 10.1105/tpc.107.057521. Epub 2008 Sep 19.

A protracted and dynamic maturation schedule underlies Arabidopsis leaf development

Affiliations

A protracted and dynamic maturation schedule underlies Arabidopsis leaf development

Idan Efroni et al. Plant Cell. 2008 Sep.

Abstract

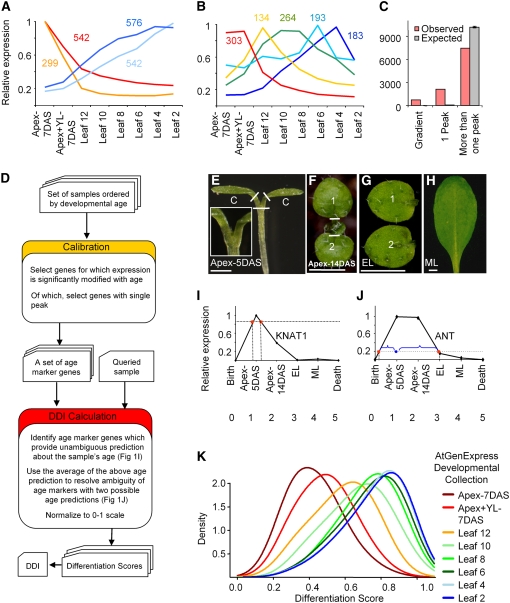
Leaf development has been monitored chiefly by following anatomical markers. Analysis of transcriptome dynamics during leaf maturation revealed multiple expression patterns that rise or fall with age or that display age-specific peaks. These were used to formulate a digital differentiation index (DDI) based on a set of selected markers with informative expression during leaf ontogeny. The leaf-based DDI reliably predicted the developmental state of leaf samples from diverse sources and was independent of mitotic cell division transcripts or propensity of specific cell types. When calibrated by informative root markers, the same algorithm accurately diagnosed dissected root samples. We used the DDI to characterize plants with reduced activities of multiple CINCINNATA (CIN)-TCP (TEOSINTE BRANCHED1, CYCLOIDEA, PCF) growth regulators. These plants had giant curled leaves made up of small cells with abnormal shape, low DDI scores, and low expression of mitosis markers, depicting the primary role of CIN-TCPs as promoters of differentiation. Delayed activity of several CIN-TCPs resulted in abnormally large but flat leaves with regular cells. The application of DDI has therefore portrayed the CIN-TCPs as heterochronic regulators that permit the development of a flexible and robust leaf form through an ordered and protracted maturation schedule.


Figures

Figure 1.
Figure 1.
Characterization and Quantification of Leaf Ontogeny Dynamics. (A) and (B) Clusters of genes in which expression is modified across the AtGenExpress leaf developmental stages samples. Leaf 2 is the second leaf formed and, hence, the oldest (see Table 1 for more details). Data were grouped into 25 clusters (each shown in Supplemental Figure 1 online), nine of which are shown here, illustrating either gradual (A) or transient (B) expression changes during maturation. Numbers indicate cluster size, and lines mark mean normalized expression of all transcripts in the cluster. (C) Prevalence of the patterns shown in (A) and (B) compared with 100 randomly permutated data sets (gray bars) and their sd. (D) Flow chart of the DDI algorithm illustrating the two major steps. Calibration (orange), where a set of age marker genes is isolated, and DDI calculation (red), where, in a two step calculation, differentiation scores are determined for an independent sample. (E) to (H) Samples of gradually maturing Ler leaves as described in Table 1. The trancriptomes of these samples were used to calibrate the DDI estimates of the AtGenExpress samples. White lines indicate where the tissue was dissected. Inset in (E) shows close-up of the collected tissue. C, cotyledons; 1, 2, first two leaves. Bars = 1 cm. (I) and (J) Calculation of a differentiation score based on an unambiguous (I) or ambiguous (J) marker. The graph shows the behavior of two age markers across the calibration set in the (E) to (H) samples. The dotted horizontal line indicates a measured value of the gene in a queried sample. The red dots and vertical dotted lines mark the two age predictions that are either averaged (I) or preferred by proximity (blue brackets) to the average of all unambiguous differentiation scores (blue dot; [J]). (K) Kernel density plots describing the distribution of differentiation scores extracted for the eight AtGenExpress samples of increasing age. The DDI (average of all differentiation scores) and further description of each sample are listed in Table 1.
Figure 2.
Figure 2.
Robustness and Resolution Power of the DDI Algorithm. (A) to (C) Kernel density plots describing the distributions of differentiation scores calculated for samples of various sources by various calibration sets. (A) Comparison of same-age samples differing in ecotype (Ler versus Col), same-age samples differing in genotype (gl1 versus Ler), or same ecotype samples differing in age (Col Apex versus Leaf 12). Differentiation scores are based on the following calibration sets: the four Ler samples (Figures 1E to 1H), the eight AtGenExpress Col samples (Schmid et al., 2005), and a combined set based on nine samples selected from both sets to cover a broader developmental range: Apex-5DAS, Apex-7DAS, Apex+YL-7DAS, EL, Leaf 10, Leaf 8, Leaf 6, Leaf 4, and Leaf 2 (see Table 1 for sample details). (B) A maturation gradient along the plant's 7th leaf captured by a DDI calibrated by the combined set. Inset illustrates the parts of the leaf analyzed. (C) A uniform DDI of same age plants challenged with methyl jasmonate (Goda et al., 2008), which modified >2000 transcripts among the six treatments.
Figure 3.
Figure 3.
Reduced Activities of CIN-TCPs Stimulate Prolonged Growth of Immature Lamina. (A) to (D) Bolting rosettes of plants with gradually reduced CIN-TCP levels. Bars = 1 cm. (E) Fully expanded 6th leaf of the plants in (A) to (D). (F) Fold reduction of specific TCP mRNA levels in the different miRNA overexpression lines. (G) Differentiation score distributions of previously published data of 4-week-old leaf samples (Schwab et al., 2005) capture a mild delayed differentiation in 35S:miR319a. (H) Scanning electron micrographs (all shown at the same magnification) of the adaxial epidermal surfaces of the leaves in (E). Note the small size and absence of jigsaw-like cells in 35S:miR319a blades; cell outlines are marked in red, and average epidermal cell size is at the top left corner. Bars = 50 μM. (I) Wild-type, 35S:miR-3TCP, and 35S:miR319a shoots used for the DDI analysis in (J). The images show the actual material used after removal of all older tissues. (J) Delayed maturation in cin-tcp shoots. The differentiation-score distributions of the samples shown in (I). The 35S:miR319a samples were 3 to 4 d older but the same size as wild type samples and had a dramatically lower transcription of mitosis genes captured by DMI (inset). (K) Expression of the mitotic CYCB1;2:GUS marker (blue color) in wild-type and 35S:miR319a plants. Note the prolonged maintenance of mitotic activities in leaf 3 (L3) of plants with reduced CIN-TCP activities.
Figure 4.
Figure 4.
Temporal-Dependent Effects of Differentiation Regulators. (A) GUS expression (blue color) mediated by selected promoters transiently expressed in developing leaves and allowing gene manipulation in sequential stages along leaf ontogeny. (B) Confocal images of dissected 14-DAS shoot apices expressing OP:GFP (or OP:dsRed for p7470) transactivated by the promoters in (A). GFP fluorescence is in green, dsRed fluorescence is in yellow, and red and blue are calcofluor white. Note the early and brief expression in pKAN1 (P0 marked by an arrow) and the sequential initiation and caesurae of expression mediated by the other promoters. For p650, the onset of leaf expression could not be captured by a SAM-containing frame and thus was not included. (C) Fully expanded first leaf of plants ectopically expressing miR319-insensitive TCP4 (rTCP4) by the promoters shown in (A). The earlier the expression initiates, the more severe the dwarfing effects are. Thus, pKAN1>>rTCP4 plants are made of miniature cotyledons only (boxed). (D) to (F) Comparisons of wild-type and pBLS>>rTCP4 plants. (D) A scanning electron microscopy image of 14-DAS shoots used for DDI and DMI analyses. Cotyledons and leaves 1 and 2 were removed. (E) Distribution of differentiation scores is shifted in pBLS>>rTCP4 plants. (F) Adaxial epidermis of fully expanded sixth leaf of the plants in (D). Average epidermal cell size is at the top left corner. (G) Fully expanded 6th leaf of plants ectopically expressing miR319a by the promoters shown in (A). (H) Growth kinetics of the plants ectopically expressing miR319a. Note the similarity of pBLS>>miR319a and 35S:miR319a. Rosette diameters were measured until a plateau was reached. Gray bars, se; dotted line, growth cessation in the wild type. (I) Adaxial epidermal cells of the wild type and pKAN1>>miR319a have comparable cell shape. Average epidermal cell size is at the top left corner. Bars = 1 cm in (C) and (G); other bars are as labeled.
Figure 5.
Figure 5.
The Organ Differentiation Program and Its Responses to Perturbed Heterochronic Regulators. (A) A model for a program of unidirectional progression along ontogeny through a successive expression of heterochronic regulators, represented by different colors. When such a maturation schedule is made of numerous steps, an ongoing regulation of differentiation is feasible. (B) Temporal CIN-TCP activities (represented by the red line) and its impact on leaf form (shown at the left). In the wild type during primordium initiation (PI), most CIN-TCPs are transcriptionally repressed by miR319. Upon lamina initiation, sequential CIN-TCP activities promote the transition from PM into the cell expansion and SM phase. Precocious TCP4 expression as in pBLS>>rTCP4 causes premature transition into the SM phase and small leaves. A mild delay in CIN-TCP activation as in pKAN1>>miR319a leaves prolongs the PM phase but permits normal entry into the SM phase, yielding much larger leaves.

References

    1. Alonso, J.M., and Stepanove, A.N. (2003). T-DNA mutagenesis in Arabidopsis. Methods Mol. Biol. 236 177–188. - PubMed
    1. Alvarez, J.P., Pekker, I., Goldshmidt, A., Blum, E., Amsellem, Z., and Eshed, Y. (2006). Endogenous and synthetic microRNAs stimulate simultaneous, efficient, and localized regulation of multiple targets in diverse species. Plant Cell 18 1134–1151. - PMC - PubMed
    1. Avery, G.S. (1933). Structure and development of the tobacco leaf. Am. J. Bot. 20 565–592.
    1. Birnbaum, K., Shasha, D.E., Wang, J.Y., Jung, J.W., Lambert, G.M., Galbraith, D.W., and Benfey, P.N. (2003). A gene expression map of the Arabidopsis root. Science 302 1956–1960. - PubMed
    1. Brady, S.M., Orlando, D.A., Lee, J.Y., Wang, J.Y., Koch, J., Dinneny, J.R., Mace, D., Ohler, U., and Benfey, P.N. (2007). A high-resolution root spatiotemporal map reveals dominant expression patterns. Science 318 801–806. - PubMed

Publication types

MeSH terms

Substances

Associated data