. 2024 Dec 13;15(1):10675.
doi: 10.1038/s41467-024-53734-z.

Canonical androgen response element motifs are tumor suppressive regulatory elements in the prostate

Affiliations

Canonical androgen response element motifs are tumor suppressive regulatory elements in the prostate

Xuanrong Chen et al. Nat Commun. .

Abstract

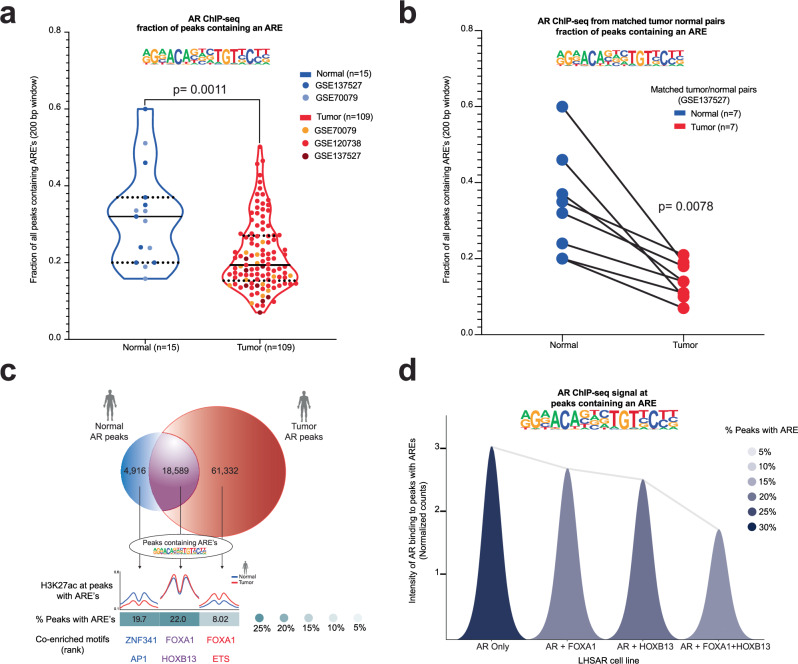
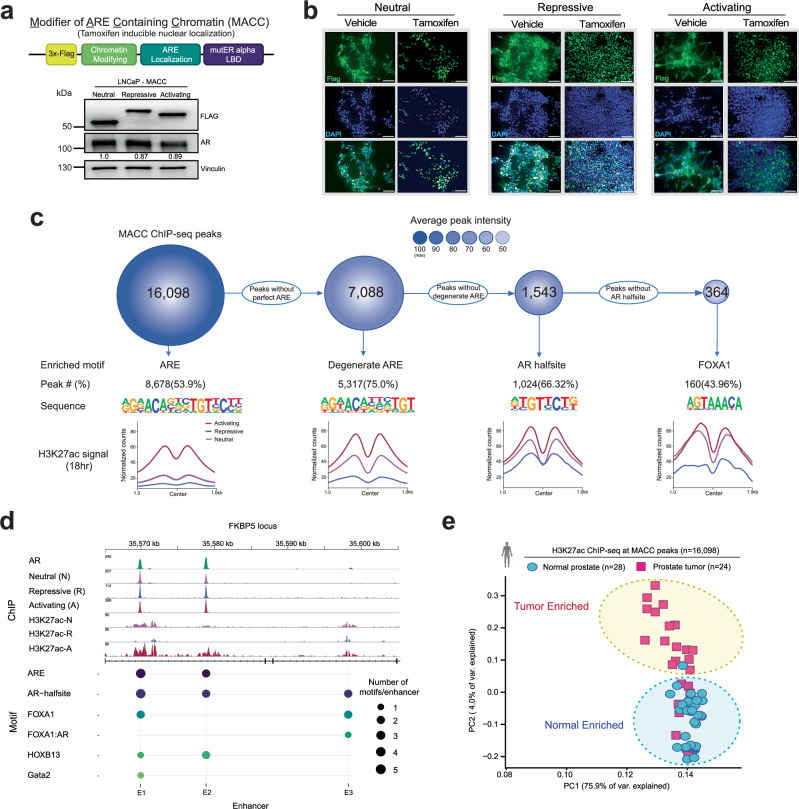
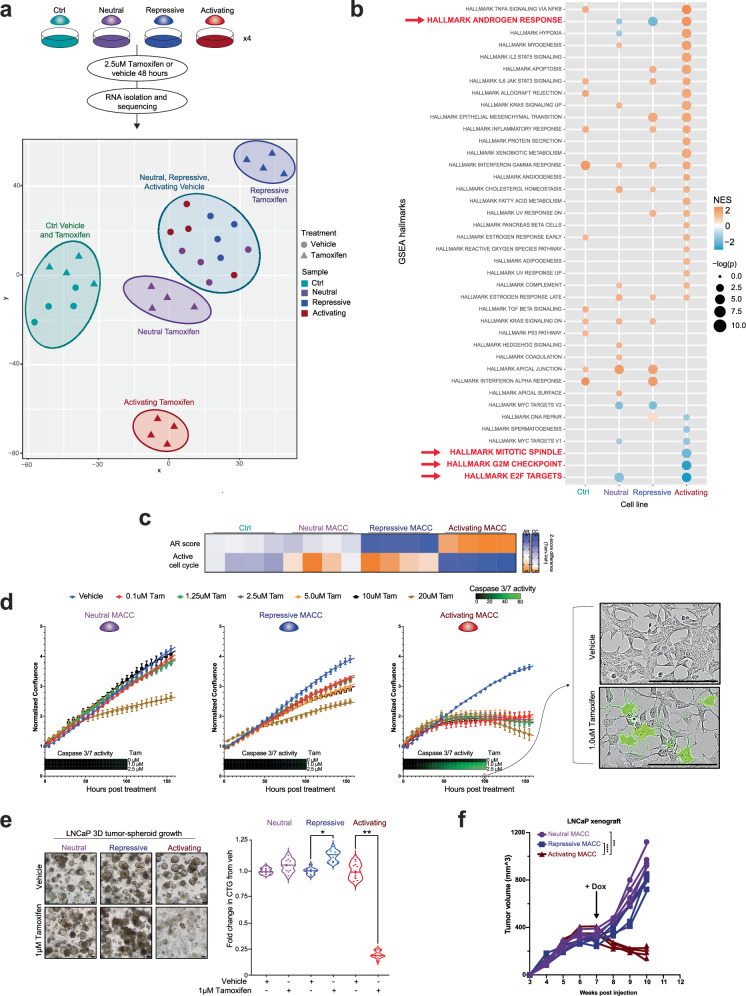
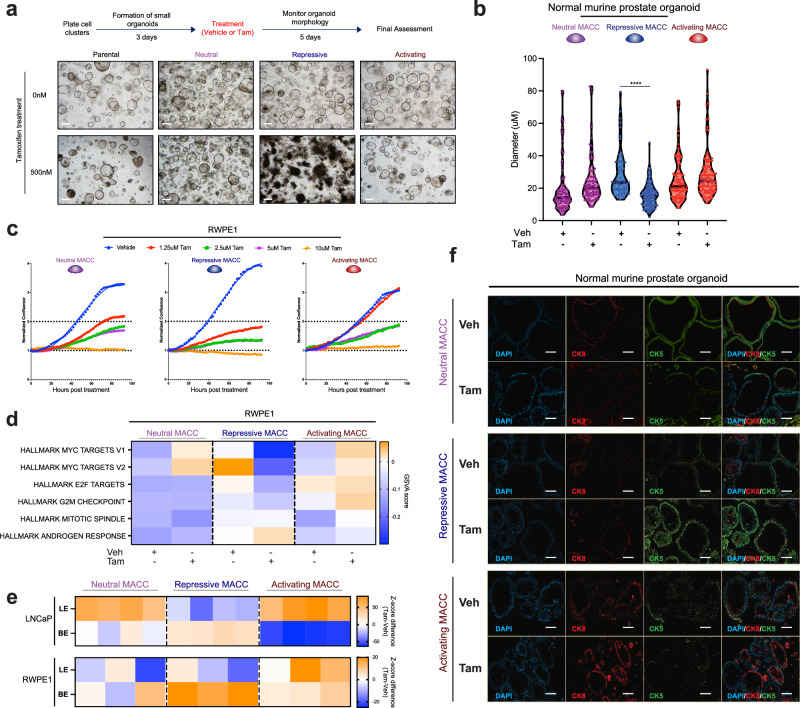
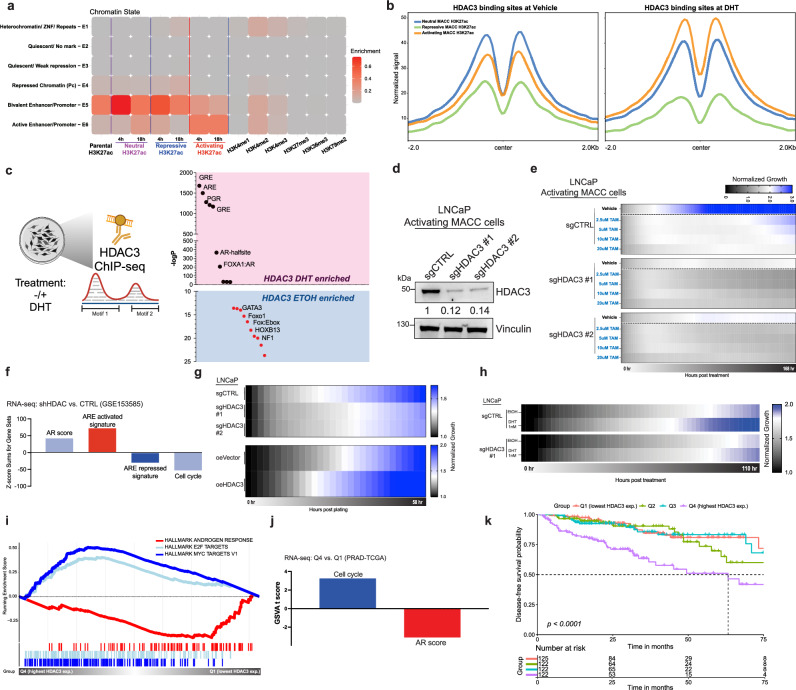
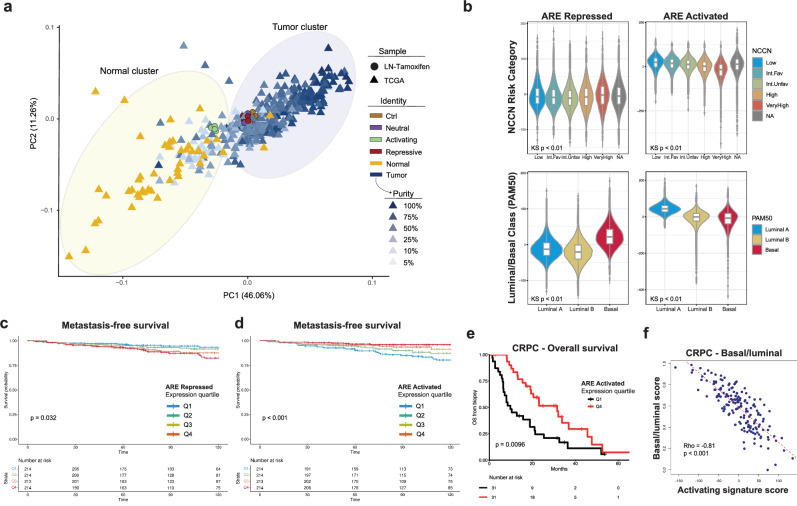
The androgen receptor (AR) is central in prostate tissue identity and differentiation, and controls normal growth-suppressive, prostate-specific gene expression. It also drives prostate tumorigenesis when hijacked for oncogenic transcription. The execution of growth-suppressive AR transcriptional programs in prostate cancer (PCa) and the potential for reactivation remain unclear. Here, we use a genome-wide approach to modulate canonical androgen response element (ARE) motifs-the classic DNA binding elements for AR-to delineate distinct AR transcriptional programs. We find that activating these AREs promotes differentiation and growth-suppressive transcription, potentially leading to AR+ PCa cell death, while ARE repression is tolerated by PCa cells but deleterious to normal prostate cells. Gene signatures driven by ARE activity correlate with improved prognosis and luminal phenotypes in PCa patients. Canonical AREs maintain a normal, lineage-specific transcriptional program that can be reengaged in PCa cells, offering therapeutic potential and clinical relevance.


Conflict of interest statement

Competing interests: M.S. reports grants from the Swedish Research Council, the Swedish Society of Medicine, and the Prostate Cancer Foundation during the conduct of the study. A.H., Y.L., and E.D. are employees of Veracyte, Inc. M.A.A. and D.L. are currently employees of Loxo Oncology. C.E.B. is a co-inventor on a patent issued to Weill Medical College of Cornell University on SPOP mutations in prostate cancer. F.Y.F. reports fees from Janssen Oncology, Bayer, PFS Genomics, Myovant Sciences, Roivant Sciences, Astellas Pharma, Foundation Medicine, Varian, Bristol Myers Squibb (BMS), Exact Sciences, BlueStar Genomics, Novartis, and Tempus; other support from Serimmune and Artera outside the submitted work. The authors declare no other potential competing interests.

Figures

Fig. 1
Fig. 1. Canonical AR Response Element (ARE) motifs are depleted in human prostate cancer.
a Fraction of peaks containing an ARE from AR ChIP-seq data in normal human prostate tissue (blue) and PCa tissue (red). P =  0.0011 by Mann-Whitney two-sided test. b Fraction of peaks with ARE from AR ChIP-seq data in matched normal human prostate tissue (blue) and PCa (red) from the same patients. P  =  0.0078 by Wilcoxon two-sided test. c Overlap of collated AR peaks from normal and tumor prostate samples, with associated enhancer activity (H3K27ac) at normal specific (blue), tumor specific (red), and common (purple) AR peaks, along with percent containing AREs, and other associated motifs. d Intensity of AR binding in peaks with an ARE in LHSAR cells expressing AR alone or associated oncogenic factors (FOXA1 and HOXB13). AR binding to peaks with AREs decreases with the addition of FOXA1 and HOXB13. Source data are provided as a Source Data file.
Fig. 2
Fig. 2. MACCs represent an inducible system to directly modulate ARE-containing regulatory elements.
a Schematic of MACC constructs, and expression of neutral (3X FLAG only), repressive (KRAB) and activating (VP64) constructs. The samples derive from the same experiment, but different gels for Flag, AR, and Vinculin were processed in parallel. The experiment was repeated three times (biological replicates), and a representative example is shown here. b Nuclear localization of constructs upon tamoxifen induction. Scale bar = 20 μm. The experiment was repeated 3 times (biological replicates), and a representative example is shown here. c ChIP-seq of MACC constructs in LNCaP cells, showing maximal binding and effect on enhancer activity at ARE motifs, with decreasing affinity and effect on H3K27ac activity for associated motifs. d Example of MACC localization and modulation of regulatory activity at the FKBP5 locus, with ARE-containing enhancers 1 and 2 (E1 and E2) affected by MACCs, but E3 (without an ARE) is insensitive. e H3K27ac signal at MACC peaks distinguishes tumor from normal human prostate tissue. For (a, b) experiments were conducted at least three times with consistent results. Source data are provided as a Source Data file.
Fig. 3
Fig. 3. Modulation of AREs results in uncoupling of canonical AR target genes and proliferation in prostate cancer cells, with ARE activation growth suppressive, while ARE repression is tolerated.
a Experimental plan for transcriptional profiling, and PCA of gene expression profiled from vehicle or tamoxifen-treated LNCaP MACC lines. b Pathway analysis using GSEA Hallmarks of induced vs. vehicle LNCaP MACC lines. The enrichment analysis was generated using Fisher’s exact test. c Opposing effects on AR target genes (AR score) and cell cycle genes (RB loss signature) with activation or repression of AREs. d Growth of LNCaP MACC lines in 2D culture with vehicle or increasing doses of tamoxifen. Neutral and repressive constructs have minimal effect; Activating MACC is growth suppressive and induces apoptosis as measured by Caspase 3/7 activity. Scale bar = 20 μm, n = 4. Data are shown as mean ± SD as representative results from three independent experiments. e Brightfield images and growth of LNCaP MACC lines as 3D spheroids, +/- tamoxifen. Scale bar = 20 μm, n  =  12 for all conditions, two-tailed Student’s t-test, *p  <  0.05, **p  <  0.01. The experiment was repeated 3 times (biological replicates), and a representative example is shown here. f LNCaP xenografts with doxycycline-inducible MACC constructs in nude mice (4 mice per group). Doxycycline chow was started at week 7. Two-way ANOVA, ***p  <  0.001, ****p  <  0.0001. Source data are provided as a Source Data file.
Fig. 4
Fig. 4. In benign prostate cells, ARE activation is well tolerated, but ARE repression results in altered growth and differentiation.
a, b Genetically normal mouse prostate organoids (a, #1 and b, #2) with inducible MACC constructs, showing loss of luminal morphology with repression of AREs. Scale bar = 40 μm. Two-tailed Student’s t test, ****p  <  0.0001. Each point represents a separate organoid cell. c Growth of benign RWPE1 prostate MACC lines with vehicle or increasing doses of tamoxifen, n = 3. d Pathway analysis using gene expression profiling of induced vs. vehicle RWPE1 MACC lines. e Heatmap of LE and BE markers’ gene signature levels in LNCaP and RWPE1 MACC lines. f Representative immunofluorescence images of the expression of luminal (cytokeratin 8) and basal (cytokeratin 5) markers in normal mouse prostate organoids (#2). Organoids were treated with either vehicle or 2 μM Tamoxifen for 48 h. Scale bar = 20 μm. The experiment was repeated three times (biological replicates), and a representative example is shown here. For (ac, f) experiments were conducted at least three times with consistent results. Source data are provided as a Source Data file.
Fig. 5
Fig. 5. HDAC3 mitigates the growth-suppressive effect of AREs.
a Combinatorial pattern of histone marks in a 6-state model using ChromHMM. The heatmap (Emission plot) displays the frequency of the six distinct histone modifications (H3K4me1—active enhancer, H3K4me2, H3K4me3—active promoter, H3K27me3—repressive epigenetic mark, H3K36me3—transcription mark, H3K79me2) under androgen stimulation along with MACCs in each state. b Signal of MACC H3K27ac (18 h) at all HDAC3 vehicle-treated (GSM717402) or HDAC3 DHT-treated (GSM717403) binding peaks. c Schematic of motif enrichment analysis from HDAC3 ChIP-seq before and after DHT stimulation. ARE motifs were enriched in the DHT condition at HDAC3 binding sites. d Immunoblot of HDAC3 expression in LNCaP activating MACC cells with control or two independent HDAC3 sgRNAs. The samples derive from the same experiment, but different gels for HDAC3 and Vinculin were processed in parallel. e Growth of HDAC3 knockout in LNCaP activating MACC cells with vehicle or increasing doses of tamoxifen. HDAC3 knockout amplified the growth-suppressive phenotypes upon ARE activation. The growth readout is presented in a heatmap format, n = 3. f Pathway analysis using gene expression profiling of HDAC3-knockdown RNA-seq data in LNCaP cells (GSE153585). g Growth of HDAC3 knockout or overexpression in LNCaP cells. The growth readout is presented in a heatmap format, n = 3. h Growth of LNCaP HDAC3 knockout cells after androgen deprivation and DHT stimulation. The growth readout is presented in a heatmap format, n = 3. i, j Pathway analysis using GSEA Hallmarks and gene signatures of Q4 vs. Q1 groups based on HDAC3 expression level in the TCGA cohort. k Kaplan–Meier analysis of disease-free survival in the TCGA cohort, stratified into quartiles by HDAC3 expression level. Time = months. Statistical significance was determined using the log-rank test. For (d, e, g, h) experiments were conducted at least three times with consistent results. Source data are provided as a Source Data file. c Created with BioRender.com.
Fig. 6
Fig. 6. Distinct transcriptional programs revealed by modulating AREs are clinically relevant in human prostate cancer.
a Unsupervised clustering of the transcriptomes of human prostate cancer and normal samples (TCGA), along with tamoxifen induced LNCaP MACC lines. b Association of ARE and activated signatures from LNCaP MACC lines with National Comprehensive Cancer Network (NCCN) risk category (top) and PAM50 luminal/basal classification (bottom) in clinically localized prostate cancer, n = 169,123 (n = number of patients; center: median; box: 25th to 75th percentile; shape: the distribution of the data, with the width indicating the kernel density estimate of the frequency). KS Kruskal–Wallis, Int.Fav Favorable Intermediate risk, Int.Unfav Unfavorable Intermediate risk, also Supplementary Table 1 and 3. c Kaplan–Meier analysis of metastasis-free survival in 855 men after radical prostatectomy, stratified into quartiles by ARE repressed signature expression level. Time = months. Statistical significance was determined using the log-rank test. d Kaplan–Meier analysis of metastasis-free survival in 855 men after radical prostatectomy, stratified into quartiles by ARE activated signature expression level. Time = months. Statistical significance was determined using the log-rank test. e Kaplan–Meier analysis of overall survival in 123 men with metastatic castrate resistant prostate cancer, stratified into quartiles by ARE activated signature expression level in biopsy specimens. Hazard ratio (HR) = 0.47 [0.26−0.83]. Statistical significance was determined using the log-rank test. f Correlation analysis of basal/luminal phenotype score (higher = more basal) by gene expression (Y-axis) with ARE activated signature expression level (X-axis). Rho = −0.81, Spearman’s correlation. Statistical significance was evaluated using a two-sided Spearman’s rank correlation test.

Update of

References

    1. Garraway, L. A. & Sellers, W. R. Lineage dependency and lineage-survival oncogenes in human cancer. Nat. Rev. Cancer6, 593–602 (2006). - PubMed
    1. Gelmann, E. P. Molecular biology of the androgen receptor. J. Clin. Oncol.20, 3001–3015 (2002). - PubMed
    1. Pomerantz, M. M. et al. The androgen receptor cistrome is extensively reprogrammed in human prostate tumorigenesis. Nat. Genet.47, 1346–1351 (2015). - PMC - PubMed
    1. Stelloo, S. et al. Integrative epigenetic taxonomy of primary prostate cancer. Nat. Commun.9, 4900 (2018). - PMC - PubMed
    1. Augello, M. A. et al. CHD1 loss alters AR binding at lineage-specific enhancers and modulates distinct transcriptional programs to drive prostate tumorigenesis. Cancer Cell35, 603–617.e608 (2019). - PMC - PubMed

Publication types

Associated data