. 2024 Dec;300(12):107964.
doi: 10.1016/j.jbc.2024.107964. Epub 2024 Nov 5.

The noncanonical RNA-binding protein RAN stabilizes the mRNA of intranuclear stress granule assembly factor G3BP1 in nasopharyngeal carcinoma

Affiliations

The noncanonical RNA-binding protein RAN stabilizes the mRNA of intranuclear stress granule assembly factor G3BP1 in nasopharyngeal carcinoma

Pan-Yang Yang et al. J Biol Chem. 2024 Dec.

Abstract

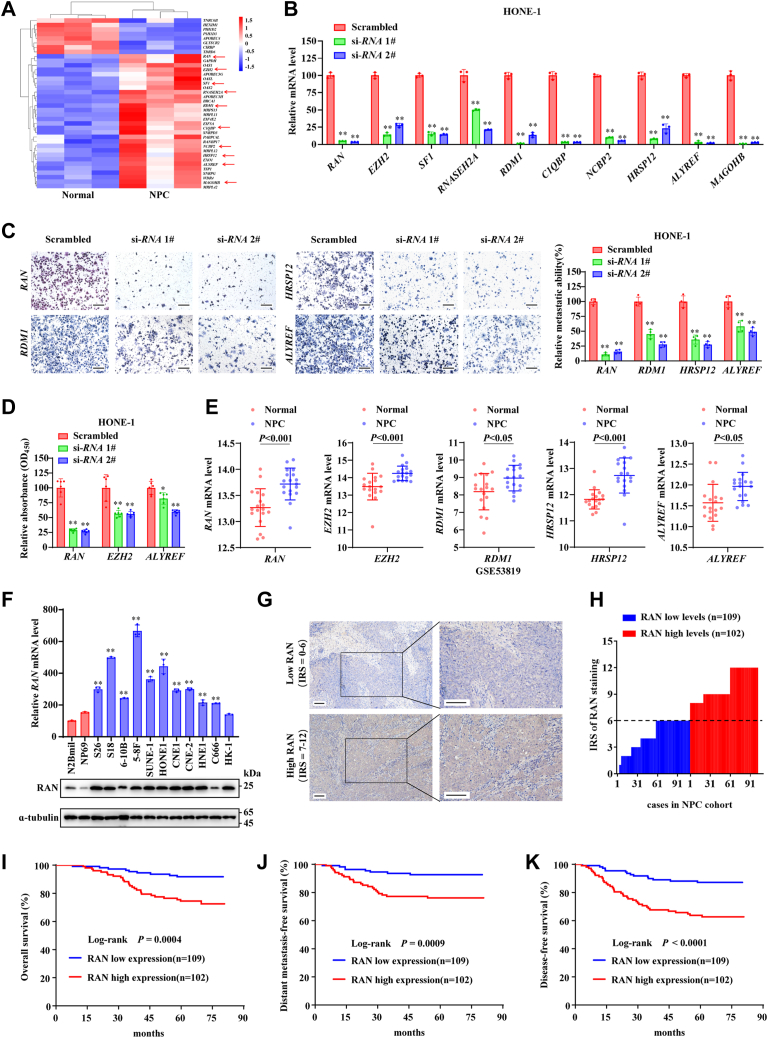
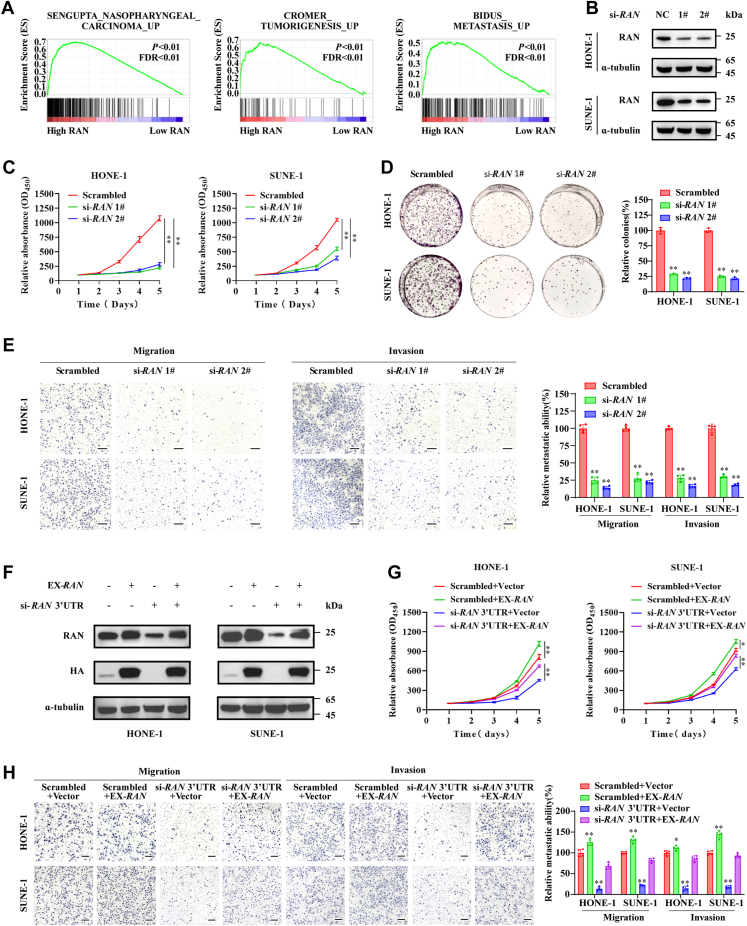
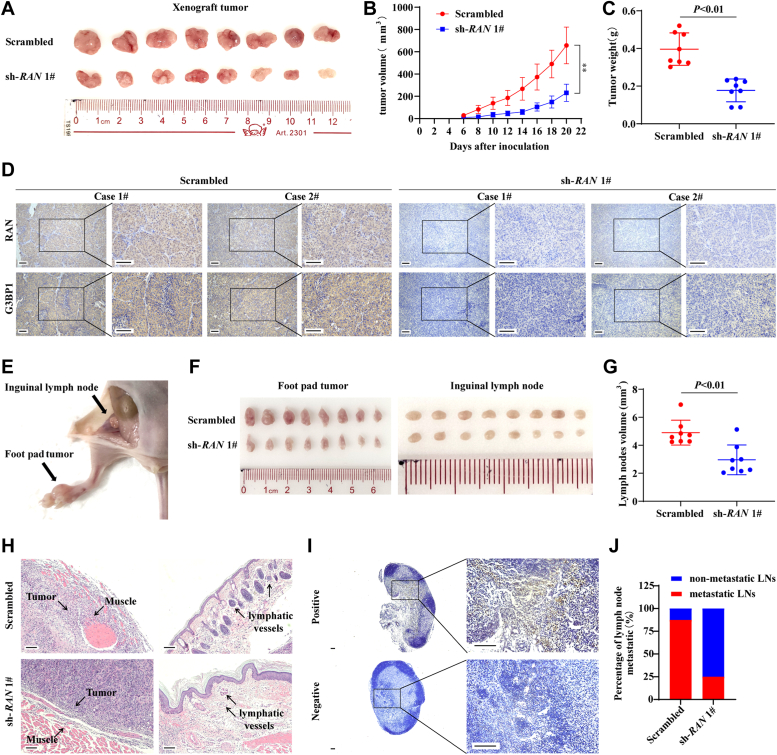
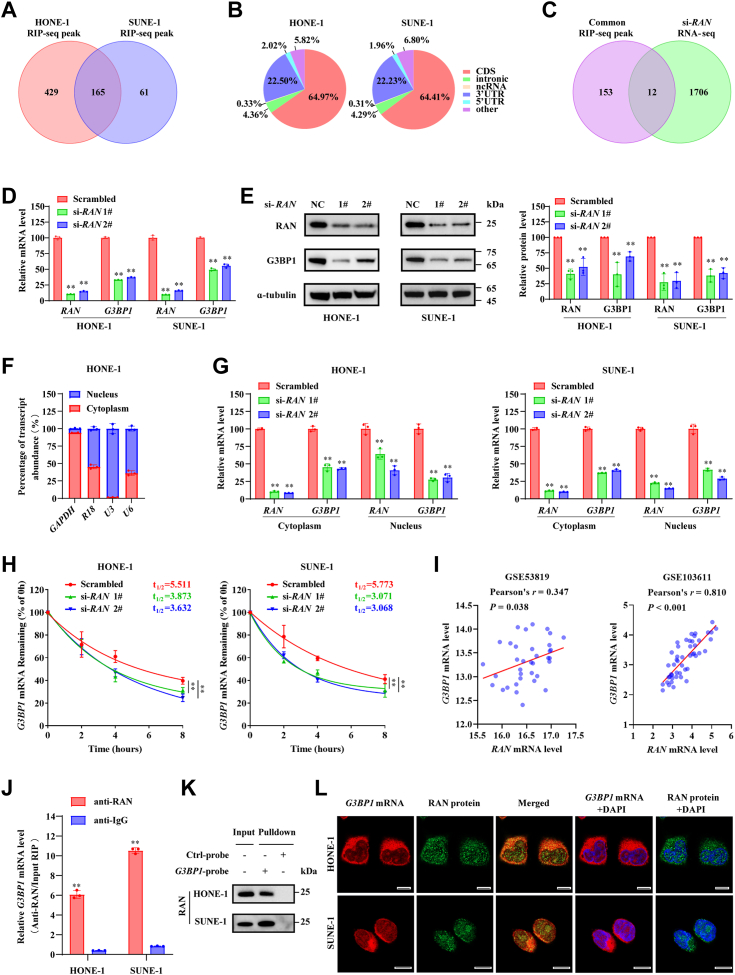
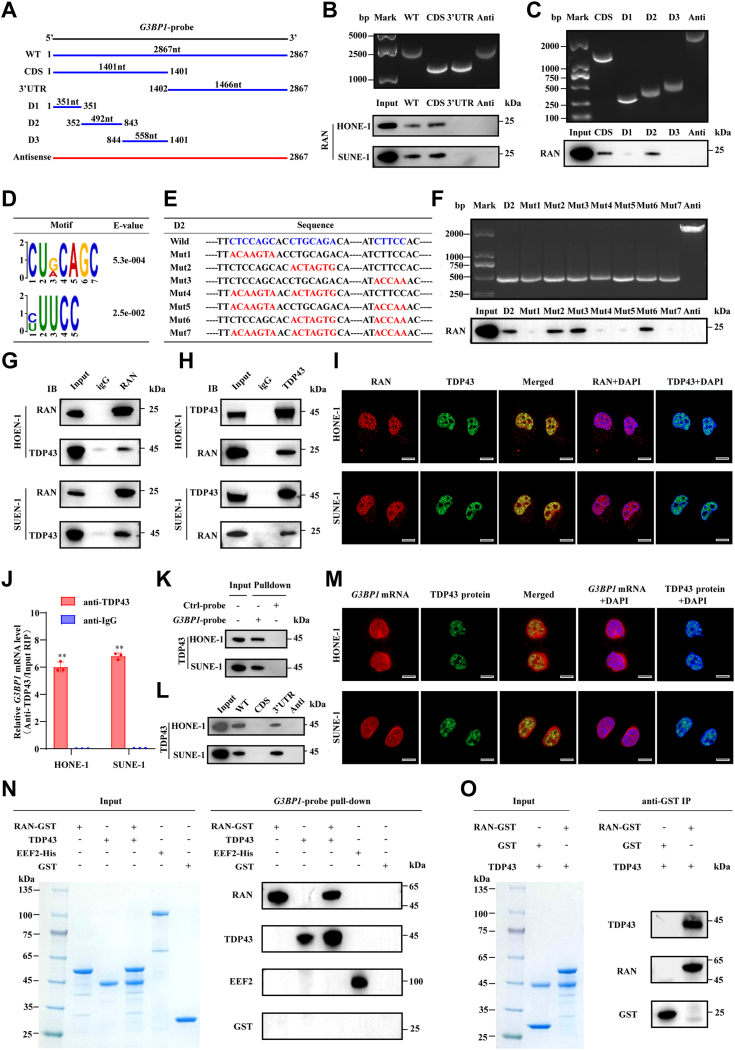
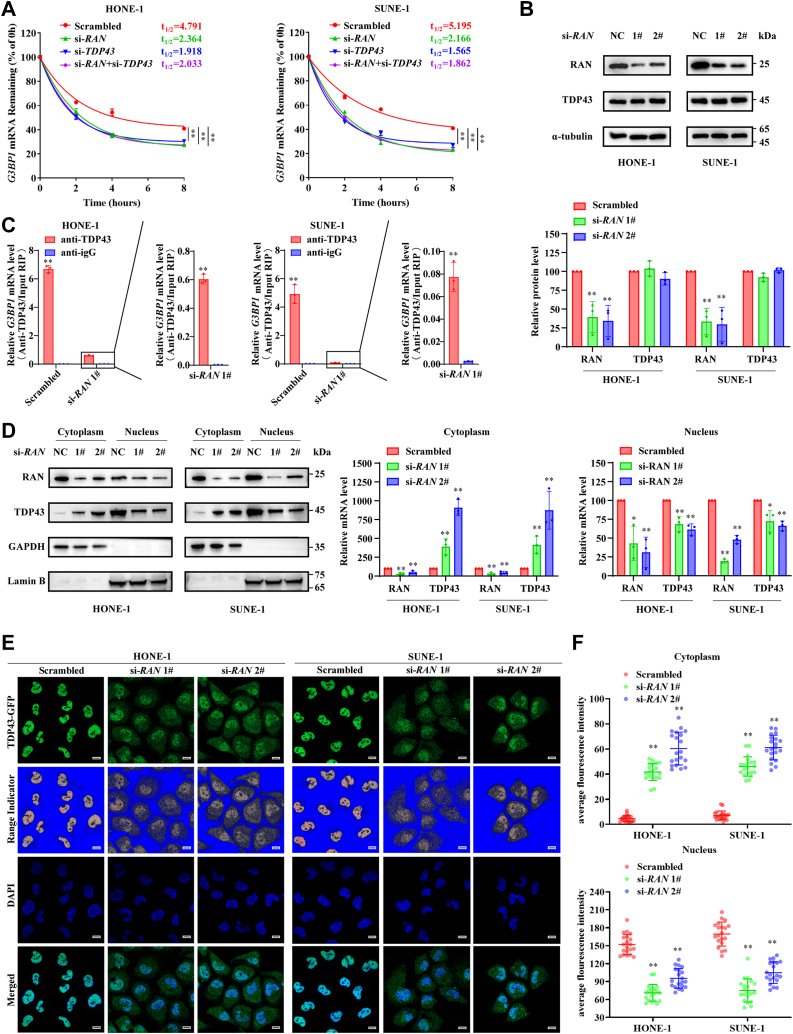
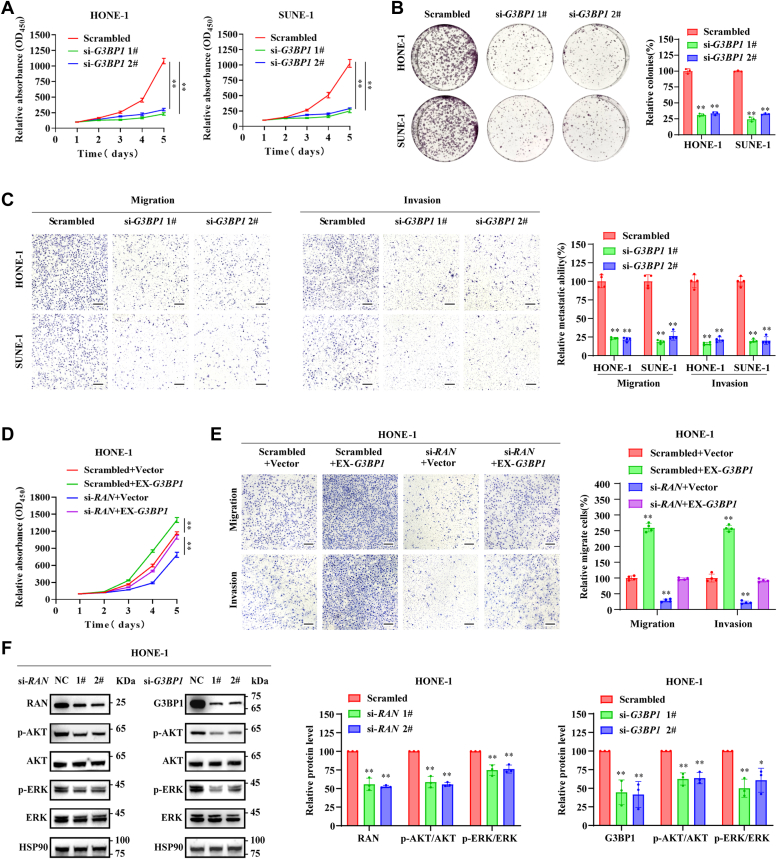
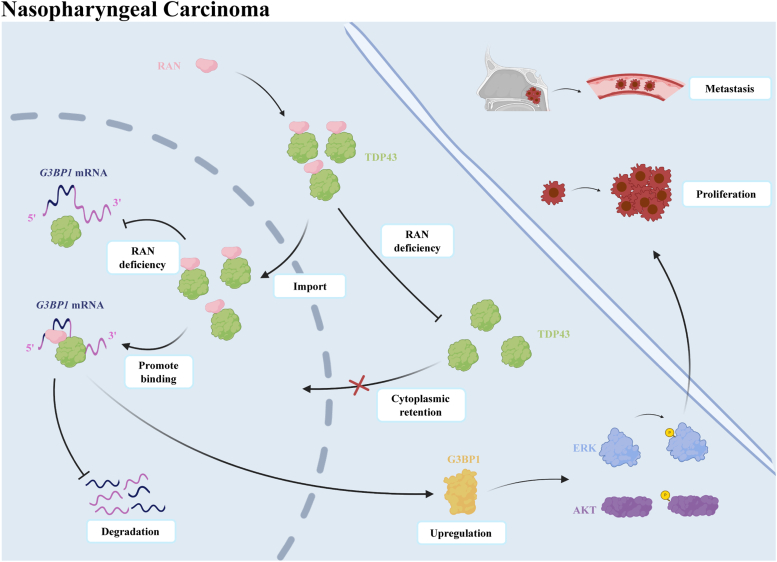
RNA-binding proteins (RBPs) play critical roles in tumor progression by participating in the posttranscriptional regulation of RNA. However, the levels and function of RBPs in nasopharyngeal carcinoma (NPC) remain elusive. Here we identified a noncanonical RBP RAN that has the most significant role in NPC progression by a small siRNA pool screening. Functionally, RAN facilitates NPC proliferation and metastasis in vitro and in vivo. High levels of RAN are associated with poor prognosis of NPC patients and can be performed as a prognostic biomarker. Mechanistically, RAN increases the nucleus import of TDP43 and enhances TDP43 nuclear distribution. On the other hand, RAN is directly bound to the coding sequence of G3BP1 mRNA and serves as an adapter to facilitate TDP43 interacting with G3BP1 mRNA 3' UTR. These contribute to increasing G3BP1 mRNA stability in the nucleus and lead to upregulation of G3BP1, which further enhances AKT and ERK signaling and ultimately promotes NPC proliferation and metastasis. These findings reveal that RAN stabilizes intranuclear G3BP1 mRNA by dual mechanisms: recruiting TDP43 into the nucleus and enhancing its interaction with G3BP1 mRNA, suggesting a critical role of RAN in NPC progression and providing a new regulation framework of RBP-RNA.


Conflict of interest statement

Conflict of interest The authors declare that they have no conflicts of interest with the contents of this article.

Figures

Figure 1
Figure 1
Aberrant levels of RBPs are related to NPC progression.A, heat map was performed to illustrate the differently expressed RBPs between 3 NPC tissues and three normal nasopharyngeal tissues from our previous database (GSE126683). B, siRNA-mediated interference was used to knockdown selected RBPs in HONE-1 cells, and RT-qPCR was applied to determine knockdown efficiency. Data are presented as the mean ± SD (n = 3). C, representative images (left) and quantified results (right) of the transwell migration assays in HONE-1 cells. The scale bar represents 200 μm. Data are presented as the mean ± SD (n = 4). D, identification of cell proliferation ability by CCK-8 assays after 96 h of siRNA interference. Data are presented as the mean ± SD (n = 6). E, validation of RAN, EZH2, RDM1, HRSP12, and ALYREF expression levels in NPC tissues (n = 18) and normal nasopharyngeal tissues (n = 18) based on data from GEO database GSE53819. Data are presented as the mean ± SD (n = 18). F, evaluation of RAN expression level in two immortalized nasopharynx epidermal cells (N2Bmil and NP69) and NPC cell lines. RNA levels were indicated by RT-qPCR (upper), and protein levels were detected by Western blotting (lower). Data are presented as the mean ± SD (n = 3). GK, the prognostic value of RAN expression levels in NPC was assessed by IHC staining in the NPC cohort (n = 211). G, RAN expression level was identified using the immunoreactivity score (IRS) system. Representative images of IHC staining for RAN were provided, and 0 to 6 were categorized as RAN low levels (upper), and 7 to 12 were categorized as RAN high levels (lower). The scale bar represents 100 μm. H, distribution of RAN IRS in the NPC cohort, consisted of RAN low levels (n = 109) and RAN high levels (n = 102). IK, Kaplan–Meier curves of overall survival (I), distant metastasis-free survival (J), and disease-free survival (K) according to RAN levels. The log-rank test was used to compare differences in survival outcomes. ∗p < 0.05 and ∗∗p < 0.01. The significant differences were assessed using one-way ANOVA (B–D and F) and t test (E). CCK-8, Cell Counting Kit-8; RBP, RNA-binding protein; GEO, Gene Expression Omnibus; RT-qPCR, reverse transcription quantitative real-time PCR; IHC, immunohistochemistry; NPC, nasopharyngeal carcinoma.
Figure 2
Figure 2
RAN facilitates NPC cell proliferation, migration, and invasion in vitro.A, GSEA based on data from the GEO database (GSE53819) found that RAN expression levels were positively correlated with NPC progression and metastasis. B, siRNA-mediated interference was used to knockdown RAN in HONE-1 and SUNE-1 cells, and Western blotting was applied to validate knockdown efficiency. C, cell proliferation ability was evaluated by CCK-8 assays in HONE-1 and SUNE-1 cells after silencing of RAN. Data are presented as the mean ± SD (n = 6). D, cell proliferation ability was evaluated by colony formation assays in HONE-1 and SUNE-1 cells after silencing of RAN. Data are presented as the mean ± SD (n = 3). E, migration and invasion capacity were analyzed by transwell assays in RAN-silenced SUNE-1 and HONE-1 cells. The scale bar represents 200 μm. Data are presented as the mean ± SD (n = 4). F, Western blotting was applied to confirm the cotransfection efficiency of scrambled control or siRNA-targeting RAN 3′ UTR, together with empty vector or HA-tagged RAN overexpression vector. G, cell proliferation was evaluated by CCK-8 assays in SUNE-1 and HONE-1 cells after cotransfected with scrambled control or si-RAN 3′ UTR, together with empty vector or HA-tagged RAN overexpression vector. Data are presented as the mean ± SD (n = 6). H, migration and invasion capacity were analyzed by transwell assays in SUNE-1 and HONE-1 cells after cotransfected with scrambled control or si-RAN 3′ UTR, together with empty vector or HA-tagged RAN overexpression vector. Data are presented as the mean ± SD (n = 4). ∗p < 0.05, ∗∗p < 0.01. The significant differences were assessed using one-way ANOVA (D, E, and H) and two-way ANOVA (C and G). CCK-8, Cell Counting Kit-8; GEO, Gene Expression Omnibus; NPC, nasopharyngeal carcinoma; GSEA, gene set enrichment analysis; HA, hemagglutinin.
Figure 3
Figure 3
Silencing RAN impairs NPC proliferation and invasion in vivo. A–D, SUNE-1 cells stably transfected with scrambled control shRNA or sh-RAN 1# were subcutaneously injected in nude mice to construct a xenograft tumor model. A, a representative image of the xenograft tumors. B, the tumor growth curves of the xenografts. Data are presented as the mean ± SD (n = 8). C, the tumor weights of the xenografts. Data are presented as the mean ± SD (n = 8). D, xenograft tumors were paraffin-embedded and sectioned. Then, the expression levels of RAN and G3BP1 were assessed by IHC staining. The scale bar represents 100 μm. E–J, SUNE-1 cells with or without RAN stable silencing were injected into the footpad of nude mice to establish an inguinal lymph node metastasis model. E, representative image of the inguinal lymph node metastasis model. F, representative images of the primary footpad tumors (left) and metastatic inguinal lymph nodes (right). G, the volume of the inguinal lymph nodes was calculated. Data are presented as the mean ± SD (n = 8). H, representative images of footpad tumor sections stained with H&E showing tumor cells invasion into muscle tissues (left) or lymphatic vessels (right). The scale bar represents 100 μm. I, representative images of IHC staining with pan-cytokeratin in metastatic (upper) or nonmetastatic (lower) inguinal lymph nodes. The scale bar represents 100 μm. J, the quantitative result of the ratios of inguinal lymph nodes metastasis. ∗p < 0.05 and ∗∗p < 0.01. The significant differences were assessed using two-way ANOVA (A) and t test (B and G). GEO, Gene Expression Omnibus; RT-qPCR, reverse transcription quantitative real-time PCR; IHC, immunohistochemistry; NPC, nasopharyngeal carcinoma.
Figure 4
Figure 4
RAN directly binds and stabilizes G3BP1 mRNA.A, Venn diagram of genes identified by RIP-seq in HONE-1 or SUNE-1 NPC cell lines (logOddScore >1). B, pie charts showing the distribution of reads recognized by RIP-seq on gene functional elements. C, venn diagram of differentially expressed genes identified by RNA-seq after RAN silencing and overlapping genes identified by RIP-seq. D, relative levels of G3BP1 mRNA level with or without RAN silencing were detected by RT-qPCR. Data are presented as the mean ± SD (n = 3). E, G3BP1 protein level with or without RAN silencing was detected by Western blotting. The blots are the representation of three independent experiments. Data are presented as the mean ± SD (n = 3). F, nuclear/cytosol RNA fractionation assays were used to identify the suitable internal control. Data are presented as the mean ± SD (n = 3). G, relative levels of G3BP1 mRNA level in cytoplasm or nucleus, which were normalized to GAPDH or U3, was indicated by RT-qPCR upon knockdown of RAN in HONE-1 and SUNE-1 cells. Data are presented as the mean ± SD (n = 3). H, after treatment with actinomycin D (10 μg/ml), G3BP1 mRNA level was quantified at indicated times in control and RAN-silenced cells. The half-life of G3BP1 mRNA was analyzed by plotting degradation curves. Data are presented as the mean ± 95%CI (n = 3). I, Pearson correlation analysis of RAN and G3BP1 levels in different GEO databases (GSE53819 and GSE103611). J, relative enrichment of G3BP1 mRNA immunoprecipitated by anti-RAN or anti-IgG antibody was indicated by RT-qPCR. Data are presented as the mean ± SD (n = 3). K, enrichment of RAN proteins pulled down by biotin-labeled G3BP1 probes from in vitro transcription or control antisense probes was detected by Western blotting. L, RAN protein distribution in cells was recognized by IF (green), G3BP1 mRNA distribution in cells was recognized by FISH (red), and cell nuclei were stained with DAPI (blue). The scale bar represents 10 μm. ∗p < 0.05 and ∗∗p < 0.01. The significant differences were assessed using one-way ANOVA (D, E, and G), two-way ANOVA (H), and t test (J). The significant differences in correlations were assessed using the Pearson correlation analysis (I). GEO, Gene Expression Omnibus; RT-qPCR, reverse transcription quantitative real-time PCR; NPC, nasopharyngeal carcinoma; DAPI, 4′, 6-diamino-2-phenylindole; IF, immunofluorescence; CI, confidence interval.
Figure 5
Figure 5
RAN, TDP43, and G3BP1 mRNA form a complex in the nucleus.A, diagrams of full-length G3BP1 transcript consist of CDS and 3′ UTR, as well as its deletion fragments. B and C, the in vitro–transcribed full-length G3BP1 transcript and deletion fragments with the correct sizes were indicated (upper). RNA pull-down assay and Western blotting showed whether these biotin-labeled G3BP1 fragments could pull down RAN in cell lysates (lower). D, the motif discovery algorithm DREME was used to recognize the top consensus motif based on the RIP-seq data. E, construction of mutant fragments based on predicted motifs. F, the in vitro–transcribed D2 fragments and mutant fragments with the correct sizes are indicated (upper). RNA pull-down assay and Western blotting indicated whether these biotin-labeled fragments could pull down RAN in cell lysates (lower). G, the interaction between endogenous RAN and TDP43 was evaluated by Co-IP assays using anti-RAN antibody or normal rabbit IgG in HONE-1 and SUNE-1 cell lysates. H, the interaction between endogenous TDP43 and RAN was evaluated by Co-IP assays using anti-TDP43 antibody or normal rabbit IgG in HONE-1 and SUNE-1 cell lysates. I, RAN (red) or TDP43 (green) protein distribution in cells was recognized by IF, and cell nuclei were stained with DAPI (blue). The scale bar represents 10 μm. J, relative enrichment of G3BP1 mRNA immunoprecipitated by anti-TDP43 or anti-IgG antibody was indicated by RT-qPCR. Data are presented as the mean ± SD (n = 3). K, enrichment of TDP43 pulled down by biotin-labeled G3BP1 probes from in vitro transcription or control antisense probes was detected by Western blotting. L, RNA pull-down assay and Western blotting showed whether biotin-labeled full-length G3BP1 transcript or deletion fragments could pull down TDP43 in cell lysates. M, TDP43 protein distribution in cells was recognized by IF (green), G3BP1 mRNA distribution in cells was recognized by FISH (red), and cell nuclei were stained with DAPI (blue). The scale bar represents 10 μm. N, in vitro purified RAN-GST, TDP43, eEF2-His (positive control), and GST (negative control) proteins were used to perform a cell-free RNA pull-down experiment. Coomassie brilliant blue staining showed the purification of these proteins (left). Enrichment of proteins pulled down by biotin-labeled G3BP1 probes from in vitro transcription was detected by Western blotting (right). O, in vitro purified RAN-GST, TDP43, and GST (negative control) proteins were used to perform a cell-free co-IP experiment. Coomassie brilliant blue staining showed the purification of these proteins (left). Enrichment of proteins immunoprecipitated by anti-GST magnetic beads was detected by Western blotting (right). ∗p < 0.05 and ∗∗p < 0.01. The significant differences were assessed using t test (J). RT-qPCR, reverse transcription quantitative real-time PCR; ; NPC, nasopharyngeal carcinoma; Co-IP, coimmunoprecipitation; GST, glutathione-S-transferase; IF, immunofluorescence; DAPI, 4′, 6-diamino-2-phenylindole; CDS, coding sequence.
Figure 6
Figure 6
RAN increases TDP43 nucleus import and facilitates TDP43 binding G3BP1 mRNA.A, after treatment with actinomycin D (10 μg/ml), G3BP1 mRNA level was quantified at indicated times in control, RAN-silenced, TDP43-silenced, and both RAN and TDP43-silenced cells. The half-life of G3BP1 mRNA was analyzed by plotting degradation curves. Data are presented as the mean ± 95%CI (n = 3). B, TDP43 protein levels with knockdown of RAN were detected by Western blotting. The blots are the representation of three independent experiments. Data are presented as the mean ± SD (n = 3). C, relative enrichment of G3BP1 mRNA immunoprecipitated by anti-TDP43 or anti-IgG antibody was indicated by RT-qPCR upon knockdown of RAN. Data are presented as the mean ± SD (n = 3). D, the nucleus and cytoplasm proteins in HONE-1 and SUNE-1 cells were isolated by nuclear/cytosol fractionation assays. TDP43 distribution in the nucleus or cytoplasm was identified by Western blotting with or without RAN silencing, GAPDH as the cytoplasm marker, and Lamin B as the nucleus marker. The blots are the representation of three independent experiments. Data are presented as the mean ± SD (n = 3). E, TDP43-GFP overexpression vectors were transfected in HONE-1 and SUNE-1 cells after RAN silencing. Recognizing TDP43-GFP protein distribution (green) in HONE-1 and SUNE-1 cells after 24 h of TDP43-GFP overexpression vectors transfected, range indicator was performed to show clearer distribution of TDP43-GFP in the nucleus or cytoplasm, cell nuclei were stained with DAPI (blue). The scale bar represents 10 μm. F, the average fluorescence intensity of TDP43-GFP in the nucleus (lower) and cytoplasm (upper) of each cell was calculated. Data are presented as the mean ± SD (n = 20). ∗p < 0.05 and ∗∗p < 0.01. The significant differences were assessed using one-way ANOVA (B, D, and F), two-way ANOVA (A), and t test (C). RT-qPCR, reverse transcription quantitative real-time PCR; DAPI, 4′, 6-diamino-2-phenylindole; CI, confidence interval.
Figure 7
Figure 7
RAN facilitates AKT/ERK phosphorylation via G3BP1 and further promotes NPC progression.A and B, cell proliferation ability was evaluated by CCK-8 assays in SUNE-1 and HONE-1 cells after silencing of G3BP1. Data are presented as the mean ± SD (n = 6). B, cell proliferation ability was evaluated by colony formation assays in SUNE-1 and HONE-1 cells after silencing of G3BP1. Data are presented as the mean ± SD (n = 3). C, migration and invasion capacity were analyzed by transwell assays in G3BP1-silenced SUNE-1 and HONE-1 cells. The scale bar represents 200 μm. Data are presented as the mean ± SD (n = 4). D, cell proliferation ability was evaluated by CCK-8 assays in HONE-1 cells after cotransfected with scrambled control or si-RAN, together with empty vector or HA-tagged G3BP1 overexpression vector. Data are presented as the mean ± SD (n = 6). E, migration and invasion capacity were analyzed by transwell assays in HONE-1 cells after cotransfected with scrambled control or si-RAN, together with empty vector or HA-tagged G3BP1 overexpression vector. Data are presented as the mean ± SD (n = 4). F, AKT, p-AKT, ERK, and p-ERK protein levels with knockdown of RAN or G3BP1 were detected by Western blotting in HONE-1 cells. The blots are the representation of three independent experiments. Data are presented as the mean ± SD (n = 3). ∗p < 0.05 and ∗∗p < 0.01. The significant differences were assessed using one-way ANOVA (B, C, and F) and two-way ANOVA (A and D). CCK-8, Cell Counting Kit-8; HA, hemagglutinin; IHC, immunohistochemistry; NPC, nasopharyngeal carcinoma.
Figure 8
Figure 8
Example diagram of RAN–TDP43–G3BP1 axis modulation. RAN increases the nucleus import of TDP43 and acts as an adapter to facilitate TDP43 direct binding to G3BP1 mRNA in the nucleus, thereby increasing G3BP1 mRNA stability and leading to upregulation of G3BP1, which further enhances AKT and ERK signaling and ultimately facilitates NPC proliferation and metastasis. NPC, nasopharyngeal carcinoma.

References

    1. Van Nostrand E.L., Freese P., Pratt G.A., Wang X., Wei X., Xiao R., et al. A large-scale binding and functional map of human RNA-binding proteins. Nature. 2020;583:711–719. - PMC - PubMed
    1. Gerstberger S., Hafner M., Tuschl T. A census of human RNA-binding proteins. Nat. Rev. Genet. 2014;15:829–845. - PMC - PubMed
    1. Qin H., Ni H., Liu Y., Yuan Y., Xi T., Li X., et al. RNA-binding proteins in tumor progression. J. Hematol. Oncol. 2020;13:90. - PMC - PubMed
    1. Zhao Y., Mir C., Garcia-Mayea Y., Paciucci R., Kondoh H., LLeonart M.E. RNA-binding proteins: underestimated contributors in tumorigenesis. Semin. Cancer Biol. 2022;86:431–444. - PubMed
    1. Gebauer F., Schwarzl T., Valcárcel J., Hentze M.W. RNA-binding proteins in human genetic disease. Nat. Rev. Genet. 2021;22:185–198. - PubMed

Publication types

MeSH terms