. 2009 Mar 20;136(6):1122-35.
doi: 10.1016/j.cell.2008.12.043.

Ezh2 orchestrates gene expression for the stepwise differentiation of tissue-specific stem cells

Affiliations

Ezh2 orchestrates gene expression for the stepwise differentiation of tissue-specific stem cells

Elena Ezhkova et al. Cell. .

Abstract

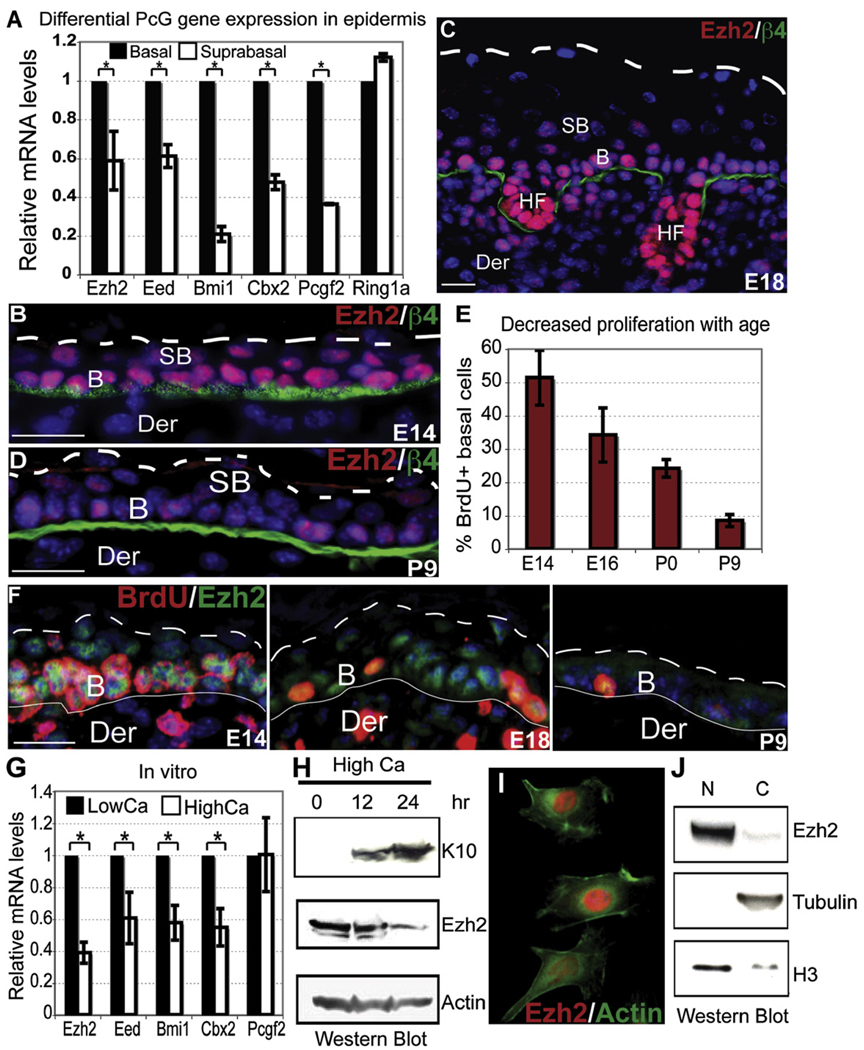
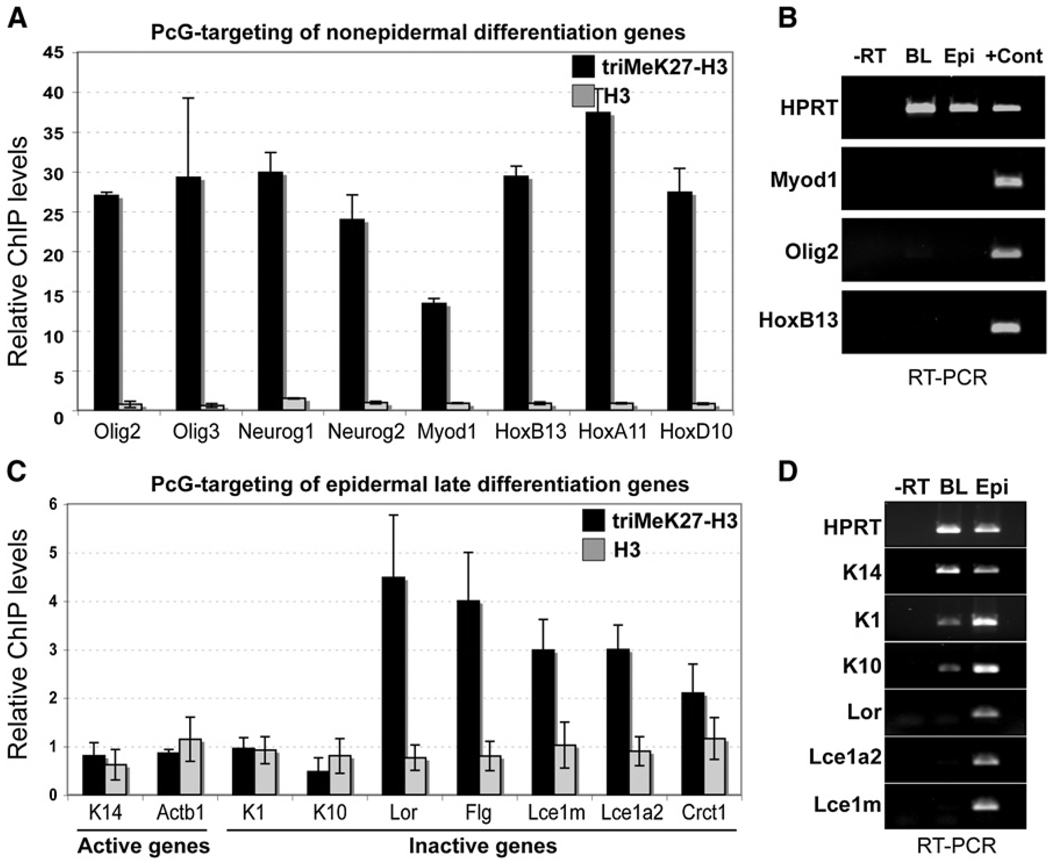
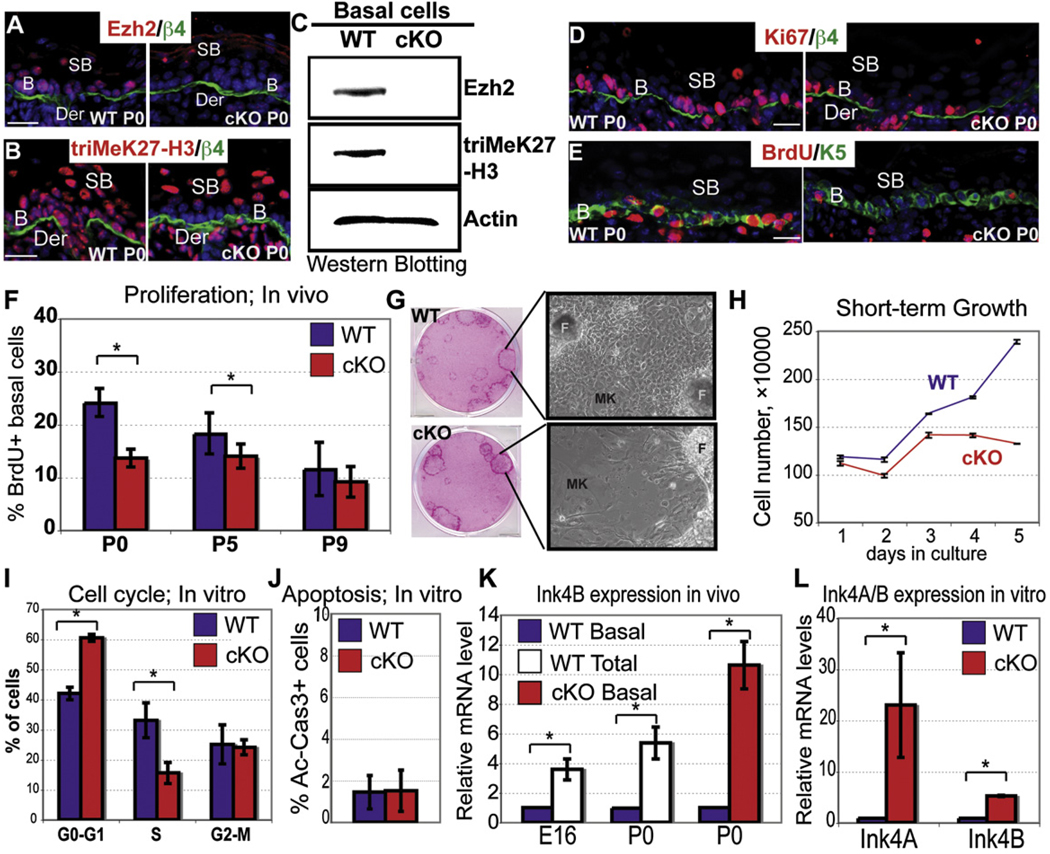
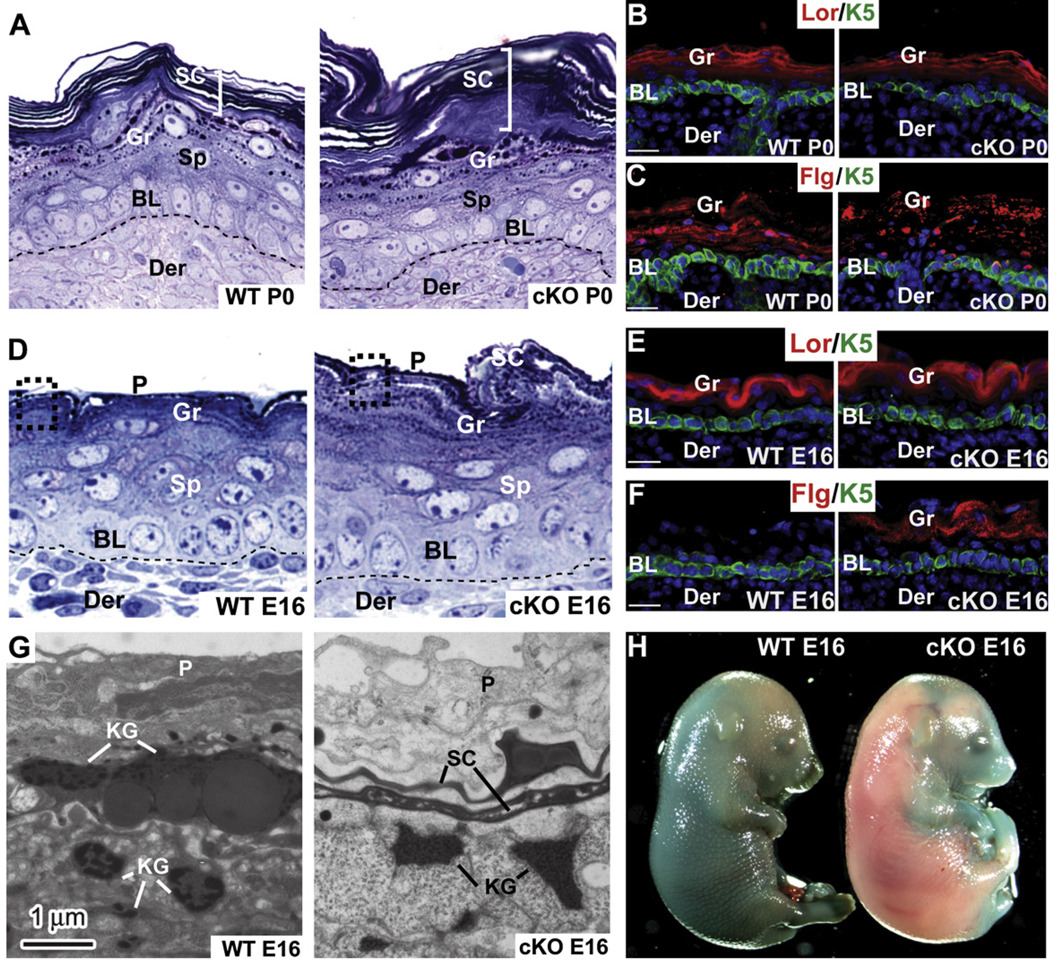
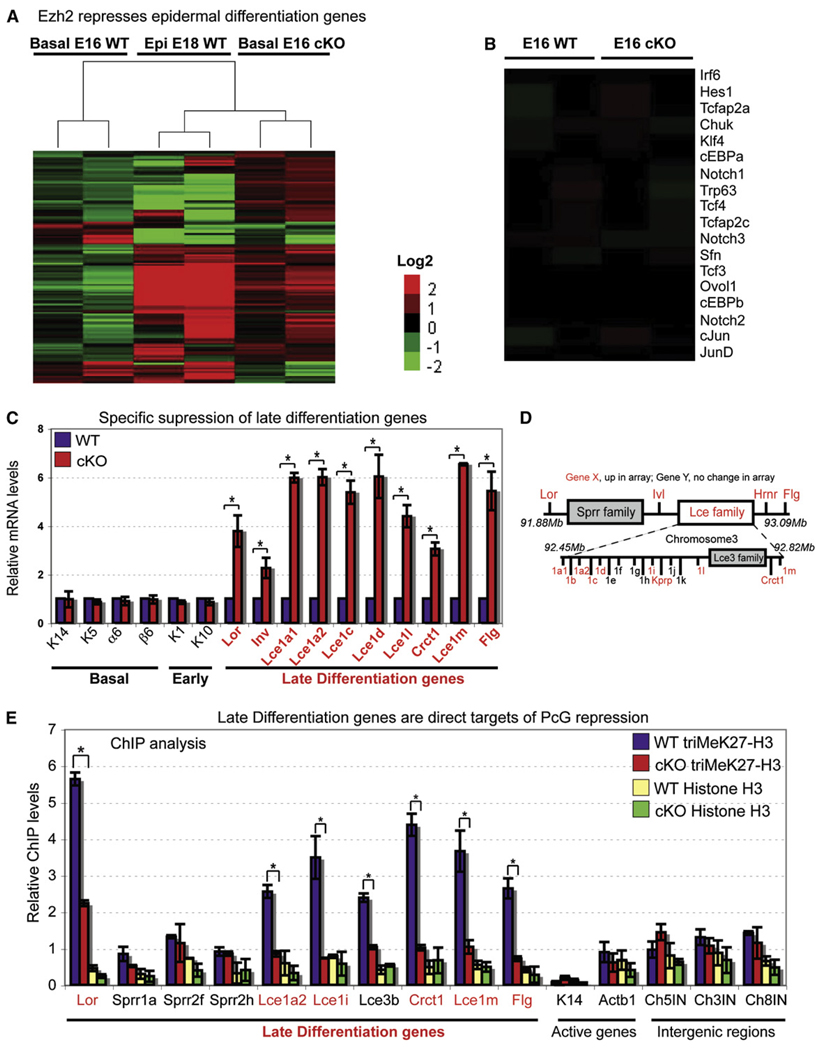
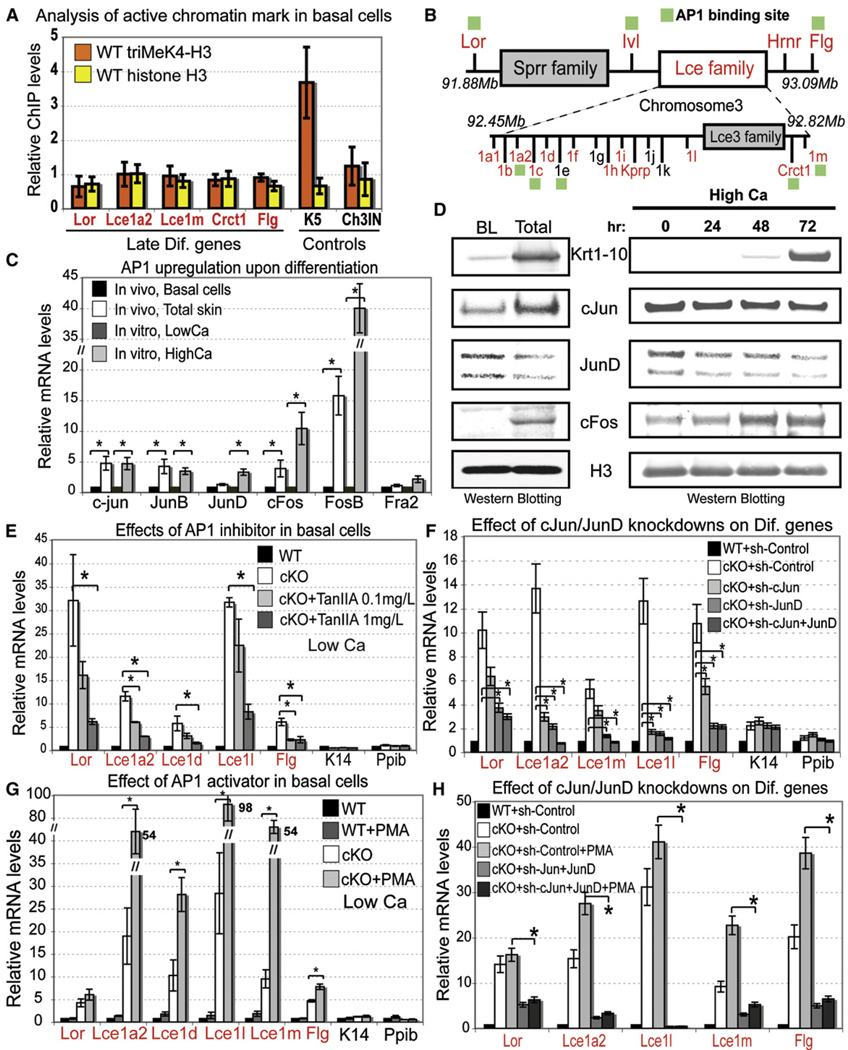
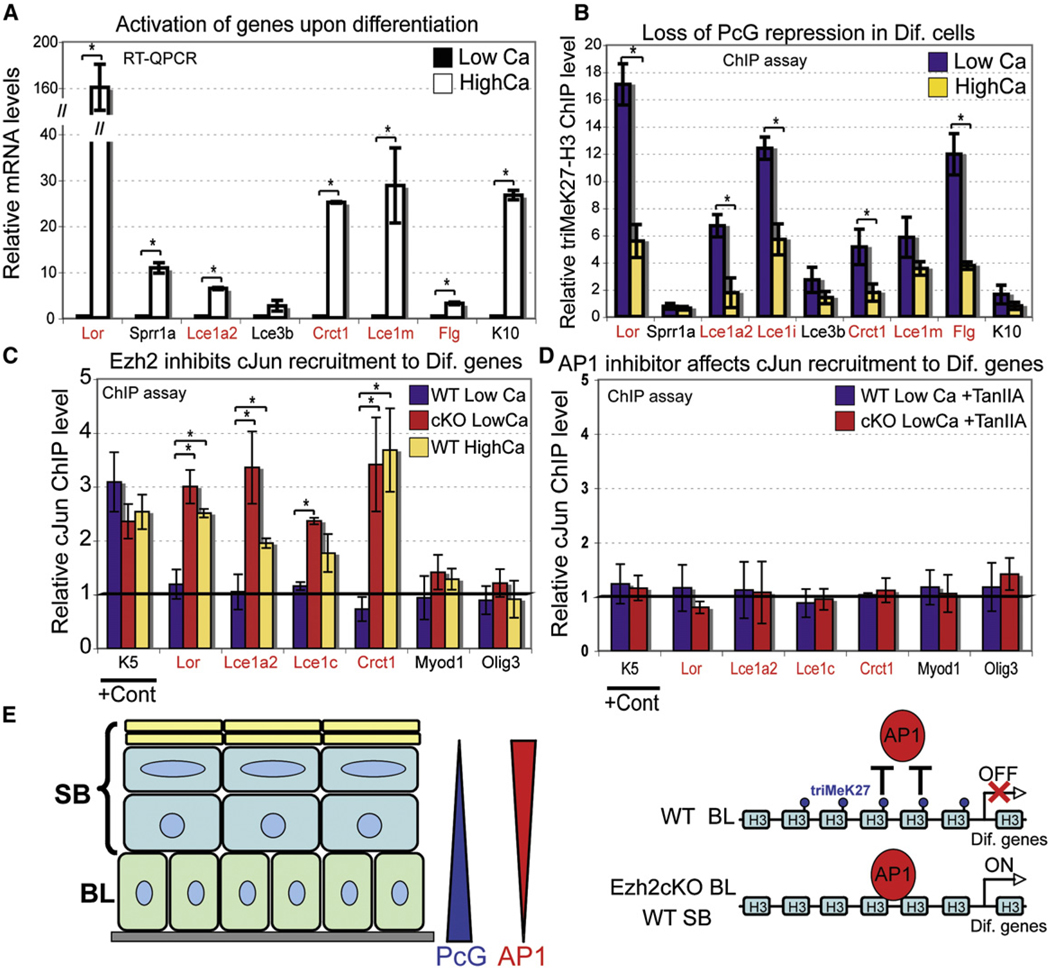
Although in vitro studies of embryonic stem cells have identified polycomb repressor complexes (PRCs) as key regulators of differentiation, it remains unclear as to how PRC-mediated mechanisms control fates of multipotent progenitors in developing tissues. Here, we show that an essential PRC component, Ezh2, is expressed in epidermal progenitors but diminishes concomitant with embryonic differentiation and with postnatal decline in proliferative activity. We show that Ezh2 controls proliferative potential of basal progenitors by repressing the Ink4A-Ink4B locus and tempers the developmental rate of differentiation by preventing premature recruitment of AP1 transcriptional activator to the structural genes that are required for epidermal differentiation. Together, our studies reveal that PRCs control epigenetic modifications temporally and spatially in tissue-restricted stem cells. They maintain their proliferative potential and globally repressing undesirable differentiation programs while selectively establishing a specific terminal differentiation program in a stepwise fashion.


Figures

Figure 1
Figure 1. Ezh2 Marks Basal Cell Progenitors in Developing Epidermis
(A) Differential expression of PcG components in E14 epidermis. FACS-purified basal and suprabasal cells were analyzed by semiquantitative RT-PCR of their isolated mRNAs. Data are mean ± SD. n = 3. *p < 0.05. (B–F) Age-related decline in basal Ezh2 correlates with reduced proliferative potential. BrdU was administered 4 hr prior to sacrificing mice. Frozen skin sections were subjected to immunofluorescence microscopy. Primary Abs are color coded according to their secondary Abs. Nuclei are stained with Dapi (blue). (G) Semiquantitative RT-PCR reveals decreased expression of PcG components with epidermal terminal differentiation in vitro. Primers against HPRT were used for normalization. Data are mean ± SD. n = 2. *p < 0.05. (H) Ezh2 protein diminishes upon calcium (Ca)-induced MK differentiation in vitro. Controls are actin (unchanged) and K10 (spinous marker). (I–J) Immunofluorescence and western blot analyses show Ezh2 nuclear localization and partitioning. Note that the cytosolic fraction (C) contains minor residual nuclear material as judged by H3, whereas the nuclear fraction (N) is clean as judged by the absence of β-tubulin. B, basal. SB, suprabasal. Der, dermis. HF, hair follicle. β4, β4 integrin. Scale bars, 30 µm.
Figure 2
Figure 2. In Embryonic Basal Progenitors, triMeK27-H3 Marks Silenced Differentiation-Specific Genes of Both Epidermal and Nonepidermal Lineages
(A and C) ChIP analysis showing association of tri-MeK27-H3 and bulk H3 with promoters of nonepidermal and epidermal genes in FACS-purified E16 basal progenitors. Semiquantitative PCR of the basal K5 gene promoter region was used for normalization. Data are mean ± SD. n = 2. (B and D) RT-PCR of nonepidermal and epidermal mRNAs in E16 basal cells (BL) versus total epidermis from P0 embryos. Negative control is PCR with total RNA (−RT) as a template. RT-PCR with RNAs isolated from skeletal muscle and brain served as positive controls (+Cont) for Myod1 (muscle) and Olig2 (brain). Control is HPRT (unchanged).
Figure 3
Figure 3. A Developmental Role for Ezh2 in the Proliferative Potential of Epidermal Progenitors
(A–C) Immunofluorescence and western blot reveal the absence of Ezh2 and triMeK27-H3 in P0 Ezh2 cKO basal cells. (D and E) Immunofluorescence shows fewer Ki67 and BrdU(+) basal cells in P0 Ezh2 cKO epidermis. (F) Quantification of BrdU(+) basal cells from mice receiving a 4 hr BrdU pulse at indicated times. Data are mean ± SD. WT, cKO n = 3–6. *p < 0.05. (G–J) Differences in morphologies, growth rates, and cell cycles, but not apoptosis (active caspase 3, Ac-Cas3), of WT versus Ezh2 cKO epidermal cells in vitro. Cell-cycle data are mean ± SD. WT, cKO n = 3. *p < 0.05. (K–L) Semiquantitative RT-PCR to measure Ink4A and/or Ink4B expression in FACS-purified basal cells in vivo (K) or cultured 1° MK in vitro (L). Data are mean ± SD. n = 2 for in vivo and n = 3 for in vitro analysis. *p < 0.05. For comparative purposes, WT expression in differentiating cells was determined by analyzing total epidermal mRNA. The HPRT gene was used for all normalizations. MK, mouse keratinocytes. F, feeders. Scale bar, 30 µm.
Figure 4
Figure 4. A Role for Ezh2 in Regulating Temporal Differentiation and Epidermal Barrier Acquisition during Skin Development
(A–F) Histological and immunofluorescence microscopy reveals signs of accelerated epidermal differentiation in P0 and E16 Ezh2 cKO epidermis. Semithin sections in (A) and (D) are toluidine blue stained. Frozen sections are labeled with Abs as indicated (color coding according to secondary Abs). (G) Ultrastructural analyses. Note the presence of mature keratohyalin granules (KG), a thin stratum corneum layer (SC), and a partial loss of periderm (P) in Ezh2 cKO E16 epidermis, all lacking in the WT counterpart. (H) Blue dye exclusion assay to measure skin barrier. Lor, Loricrin. Flg, filaggrin. BL, basal layer. Sp, spinous layer. Gr, granular layer. Der, dermis. Scale bar, 30 µm.
Figure 5
Figure 5. Transcriptional Profiling and Chromatin Analyses Reveal Late Differentiation Genes as Direct Functional Targets of Ezh2 Repression in Embryonic Basal Cells
(A and B) Heatmap derived from cluster analysis of microarray data of E16 basal progenitors shows that genes whose expression is normally associated with late-stage terminal differentiation are elevated in the absence of Ezh2. E18 WT epidermis is used as a comparative source of genes active in late-stage terminal differentiation. Microarray hybridizations for each sample were done in duplicate and are shown as separate columns. Probesets were selected that demonstrate a 2 log change (in either direction) and present (“P”) in both instances of a condition (P in both KO or P in both WT). Red, overexpressed genes. Green, under-expressed genes. No obvious changes were revealed in the basal expression of key epidermal transcriptional regulators when Ezh2 was absent (B). (C) Semiquantitative RT-PCR of mRNAs from FACS-purified E16 basal progenitors confirms the precocious induction of late differentiation genes when Ezh2 is absent. Semiquantitative RT-PCR with primers against the HPRT gene was used for normalization. Data are mean ± SD. n = 2. *p < 0.05. (D) Schematic representation of the epidermal differentiation cluster (EDC) on mouse chromosome 3. Late-stage differentiation EDC genes that were upregulated in Ezh2-deficient basal cells are marked in red. (E) ChIP analyses reveal the presence of triMeK27-H3 at promoters of many genes within the EDC in WT and reduction in Ezh2 cKO cells. Semiquantitative PCR with primers against the promoter of the active K5 gene was used for normalization. Data are mean ± SD. n = 2. *p < 0.05.
Figure 6
Figure 6. Transcriptional Activator AP1, Rather Than Activating Histone Modifications, Governs Upregulation of EDC Genes in Ezh2 cKO Basal Cells
(A) ChIP analyses show no association of the active triMeK4-H3 mark with EDC genes in WT embryonic basal cells, in which the EDC is silent. Semiquantitative PCR with primers against the intergenic region on chromosome 5 was used for normalization. The basal K5 gene was used as a positive control. Data are mean ± SD. n = 2. (B) AP1 consensus sites are found at promoters of EDC genes. (C and D) Semiquantitative RT-PCR and western blotting detects Jun and Fos AP1 proteins in epidermis and cultured MK. Expression of some members is enhanced in terminally differentiating cells. Positive control is HPRT (unchanged) and Flg (differentiated layers). Data are mean ± SD. n = 2. *p < 0.05. (E and F) Semiquantitative RT-PCR shows that the precocious activation of EDC genes in Ezh2 cKO basal progenitors is largely abrogated by either the AP1 inhibitor, TanIIA, or RNAi-mediated attenuation of cJun/JunD expression. Data are mean ± SD. n = 2. *p < 0.05. (G and H) By contrast, PMA, which promotes AP1 activity, enhances precocious expression of EDC genes in Ezh2 cKO, but not WT basal cells (G). EDC upregulation in PMA-treated Ezh2 null cells is significantly lower when Jun and JunD are knocked down than in sh control (H). Data are mean ± SD. n = 3. *p < 0.05. Active K14 and Ppib genes served as controls. BL, basal layer cells. LowCa, in vitro conditions that prevent differentiation of basal progenitors. HighCa, conditions that promote terminal differentiation.
Figure 7
Figure 7. Opposing Roles for PcG Repressors and AP1 Transcriptional Activators in Epidermal Development and Differentiation
(A and B) Semiquantitative RT-PCR shows that EDC genes are induced when WT basal cells commit to terminally differentiate (A), and ChIP analysis (B) shows that triMeK27-H3 marks associated with EDC genes in basal cells decline upon calcium-induced differentiation. Semiquantitative PCR with primers against promoter of the active K5 gene was used for normalization (B). (C and D) ChIP analysis shows cJun recruitment to promoters of late differentiation genes upon removal of Ezh2-dependent triMeK27-H3 mark in cKO basal cells or WT cells upon differentiation (C), but this recruitment is inhibited upon treatment of cells with AP1 inhibitor TanIIA (D). Presence of cJun at the K5 promoter served as a positive control. No recruitment of cJun to Myod1 and Olig3 promoters that lack obvious AP1 sites was detected. Semiquantitative PCR with primers against intergenic region on chromosome 5 was used for normalization. Data are mean ± SD. n = 2. *p < 0.05. (E) Differential expression of PcG repressor and Ap1 activator ensures spatial and temporal program of epidermal differentiation. In WT basal cells, the presence of triM3K27-H3 mark prevents AP1 from binding and activation of late differentiation genes. In Ezh2cKO or in differentiated WT cells, loss of triMeK27-H3 mark allows Ap1 to bind and activate transcription of late differentiation genes.

Comment in

References

    1. Agger K, Cloos PA, Christensen J, Pasini D, Rose S, Rappsilber J, Issaeva I, Canaani E, Salcini AE, Helin K. UTX and JMJD3 are histone H3K27 demethylases involved in HOX gene regulation and development. Nature. 2007;449:731–734. - PubMed
    1. Bernstein BE, Mikkelsen TS, Xie X, Kamal M, Huebert DJ, Cuff J, Fry B, Meissner A, Wernig M, Plath K, et al. A bivalent chromatin structure marks key developmental genes in embryonic stem cells. Cell. 2006;125:315–326. - PubMed
    1. Blanpain C, Lowry WE, Geoghegan A, Polak L, Fuchs E. Self-renewal, multipotency, and the existence of two cell populations within an epithelial stem cell niche. Cell. 2004;118:635–648. - PubMed
    1. Boyer LA, Plath K, Zeitlinger J, Brambrink T, Medeiros LA, Lee TI, Levine SS, Wernig M, Tajonar A, Ray MK, et al. Polycomb complexes repress developmental regulators in murine embryonic stem cells. Nature. 2006;441:349–353. - PubMed
    1. Bracken AP, Kleine-Kohlbrecher D, Dietrich N, Pasini D, Gargiulo G, Beekman C, Theilgaard-Monch K, Minucci S, Porse BT, Marine JC, et al. The Polycomb group proteins bind throughout the INK4A-ARF locus and are disassociated in senescent cells. Genes Dev. 2007;21:525–530. - PMC - PubMed

Publication types

Substances

Associated data