. 2020 Aug 3:9:e53392.
doi: 10.7554/eLife.53392.

ZCWPW1 is recruited to recombination hotspots by PRDM9 and is essential for meiotic double strand break repair

Affiliations

ZCWPW1 is recruited to recombination hotspots by PRDM9 and is essential for meiotic double strand break repair

Daniel Wells et al. Elife. .

Abstract

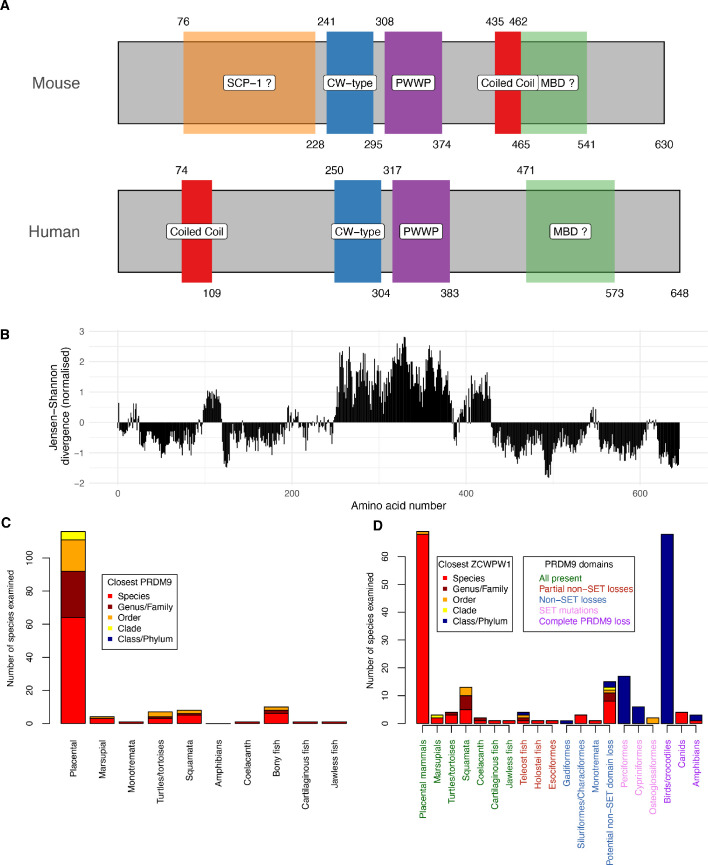
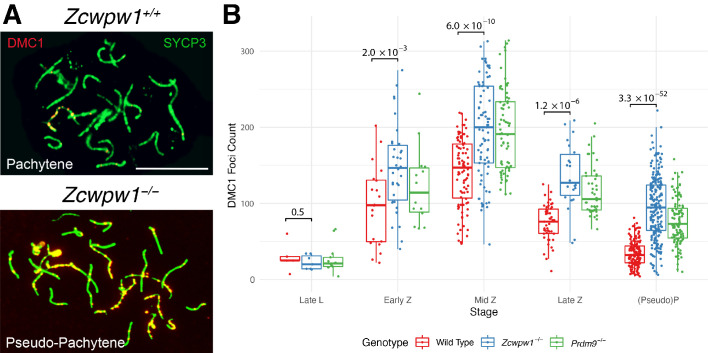
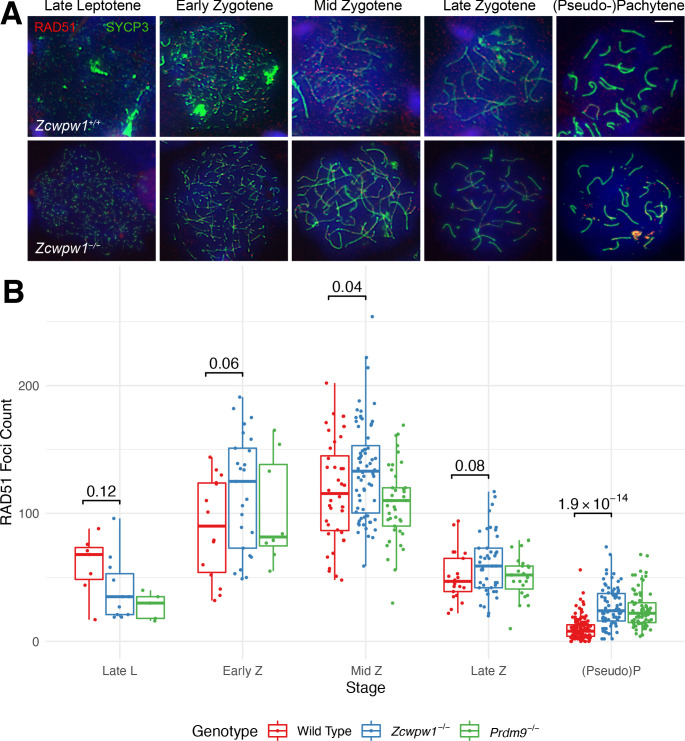
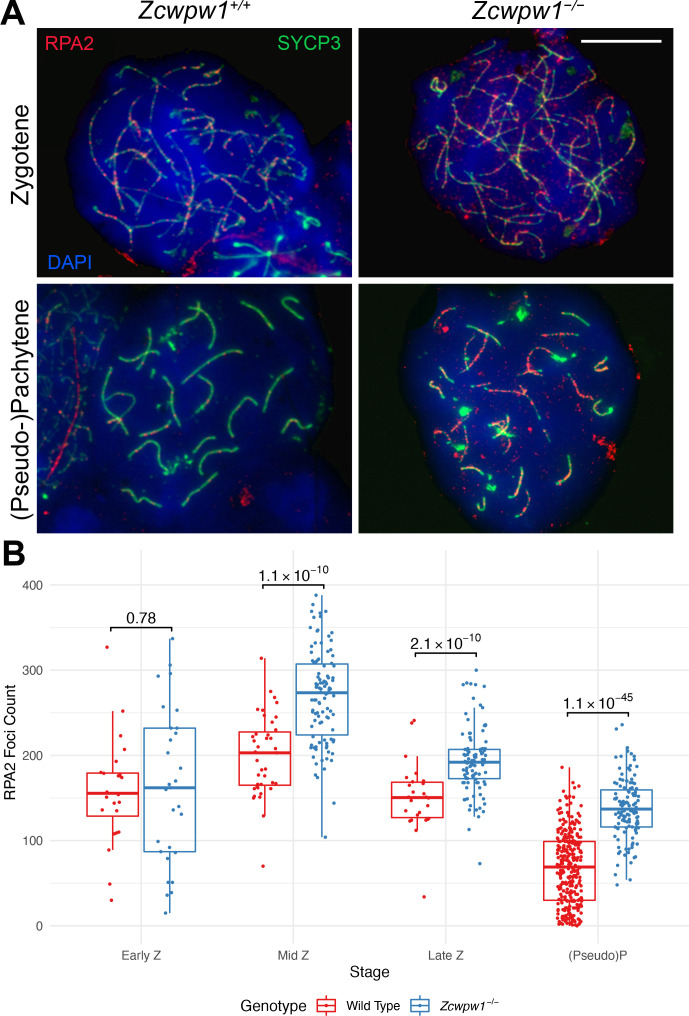
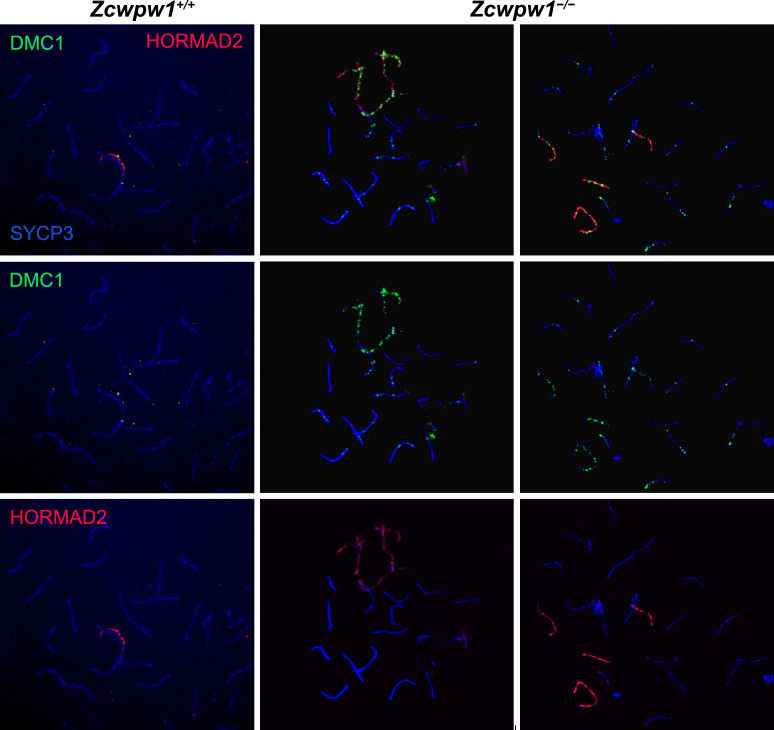
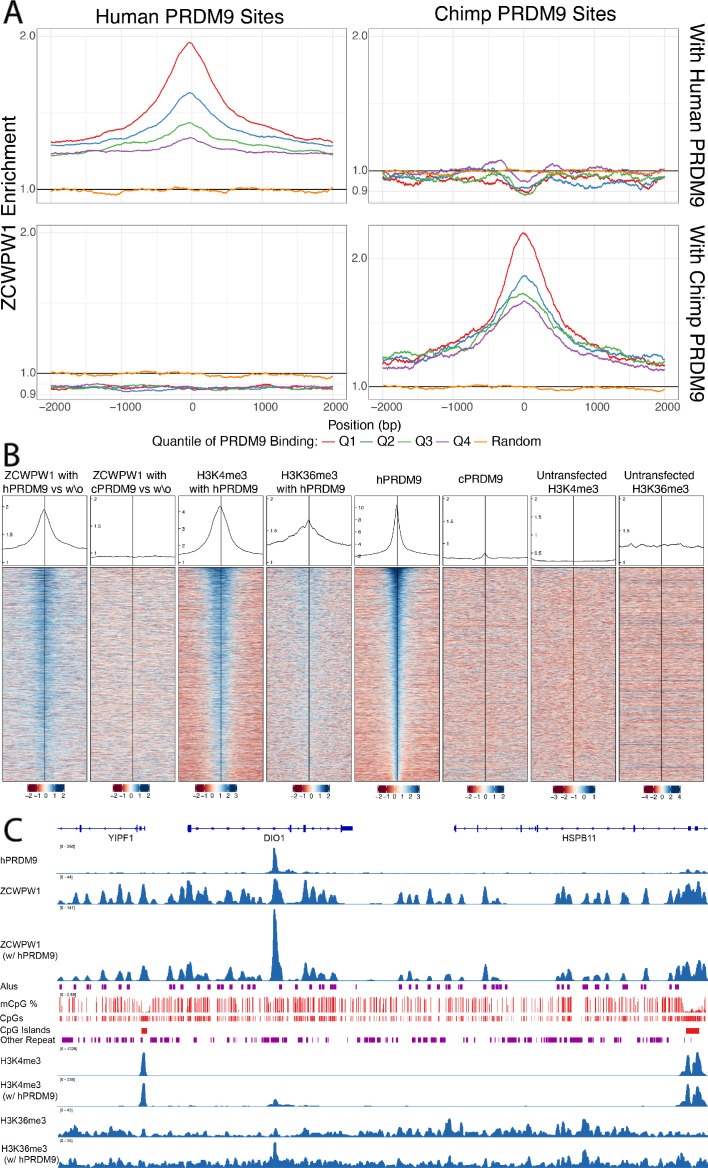
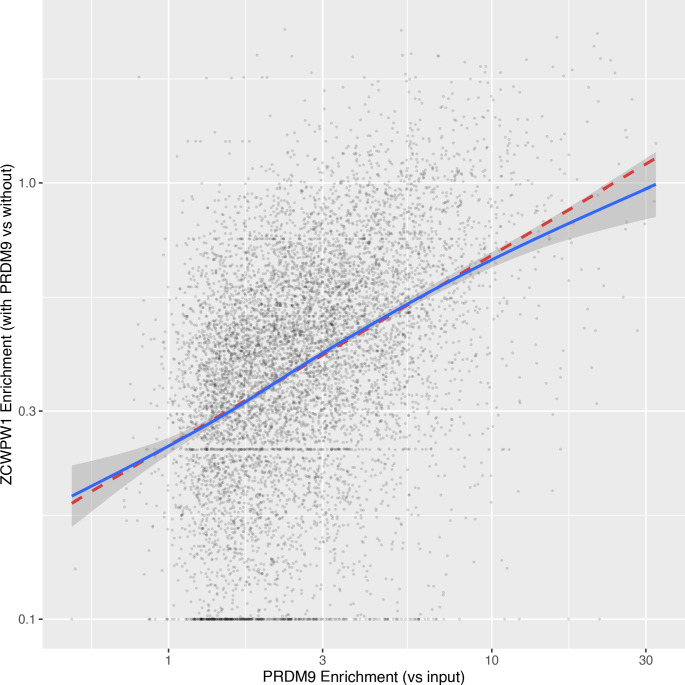
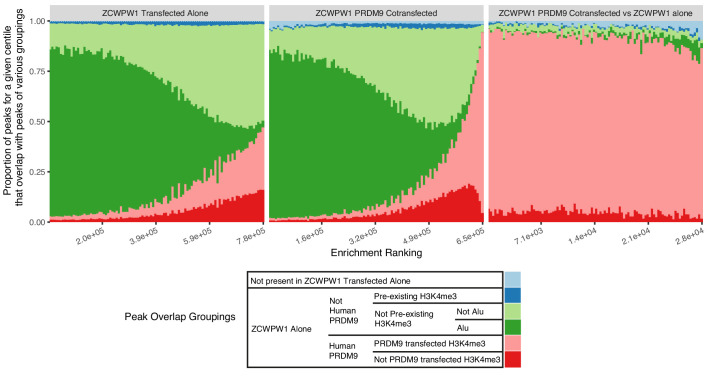
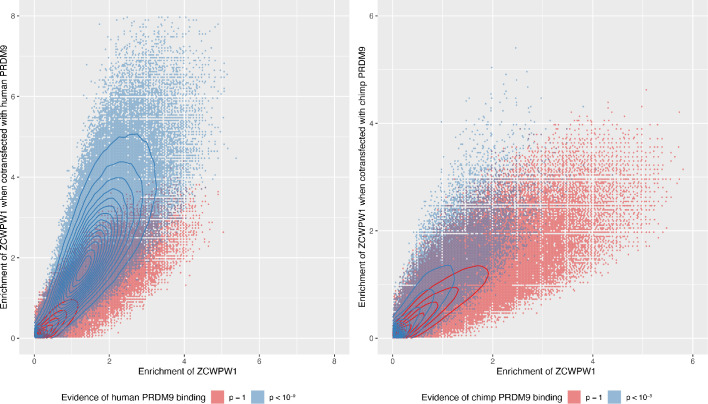
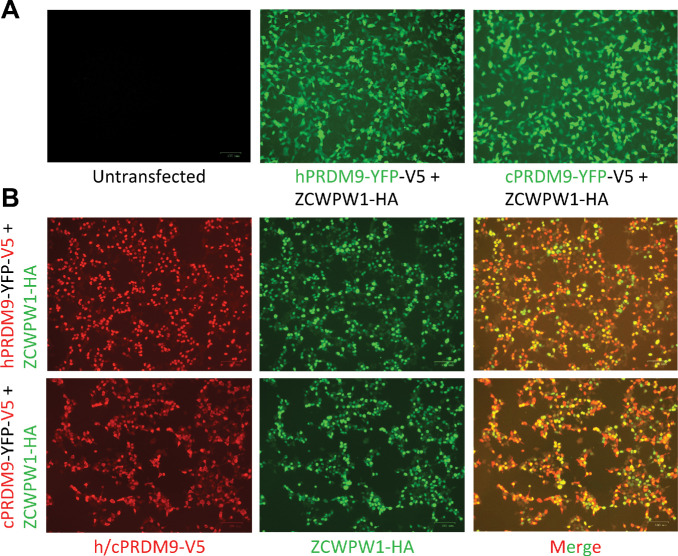
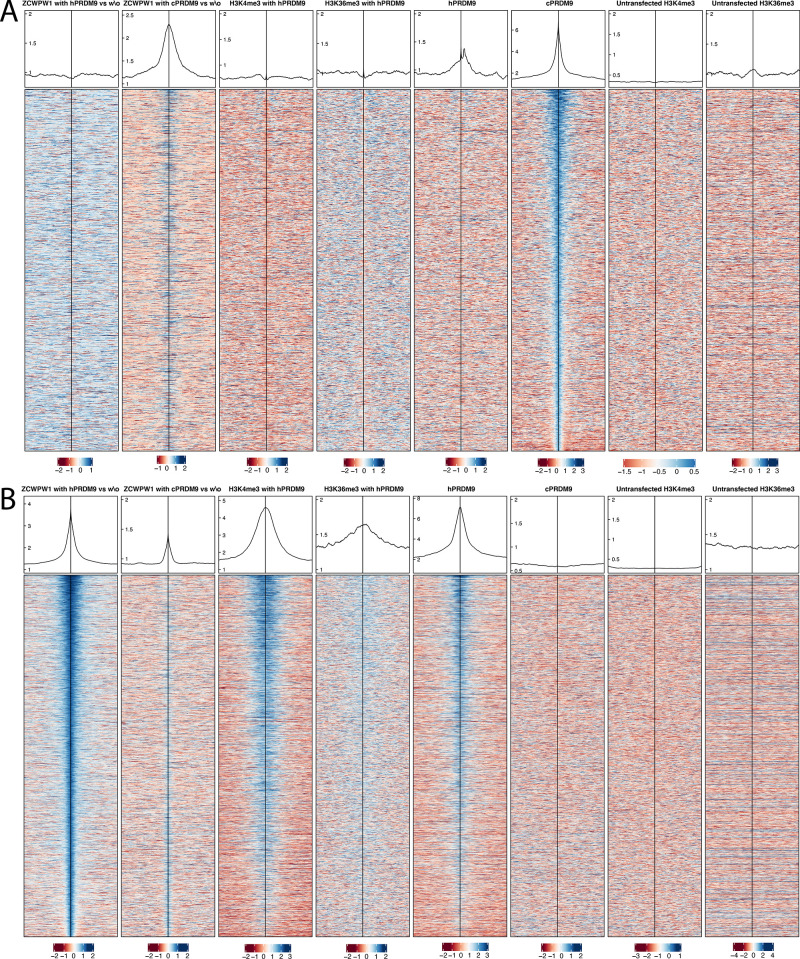
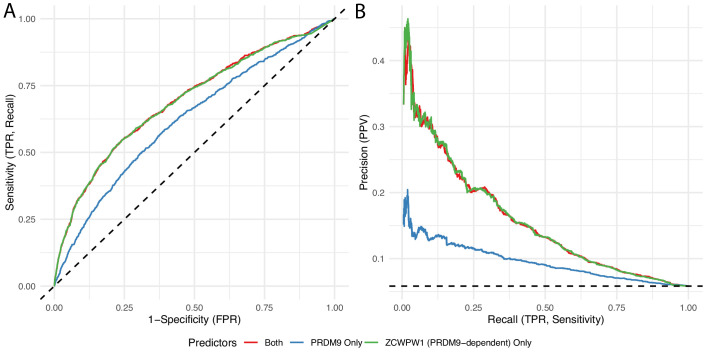
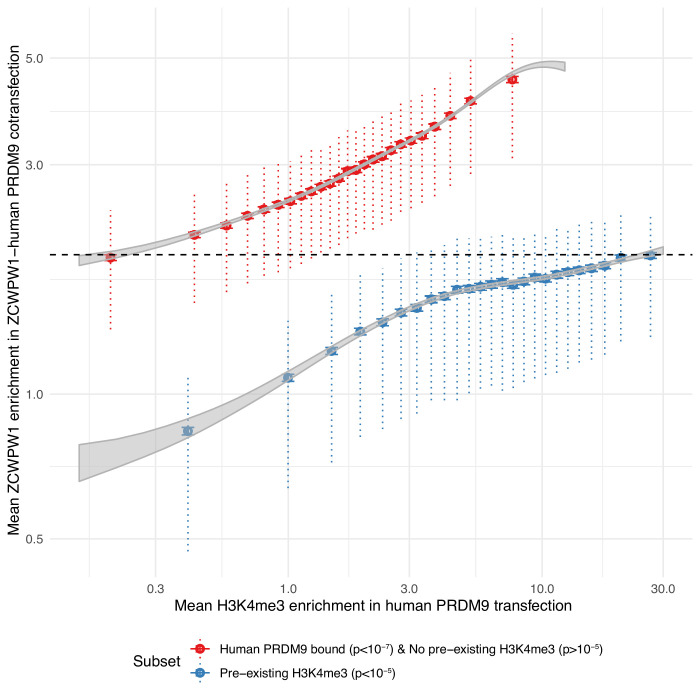
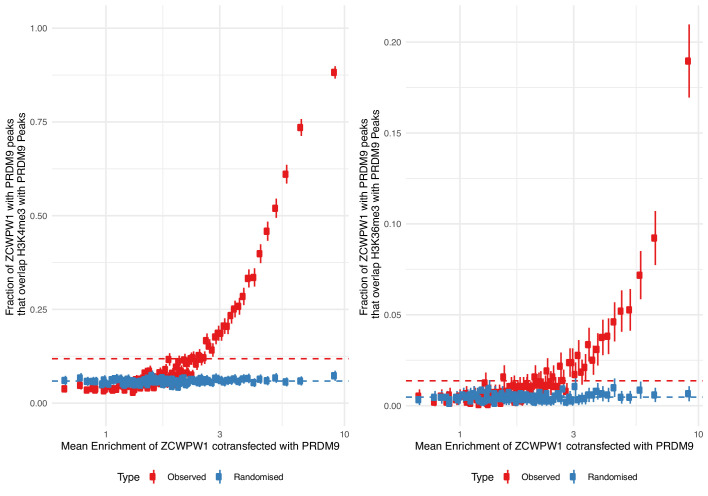
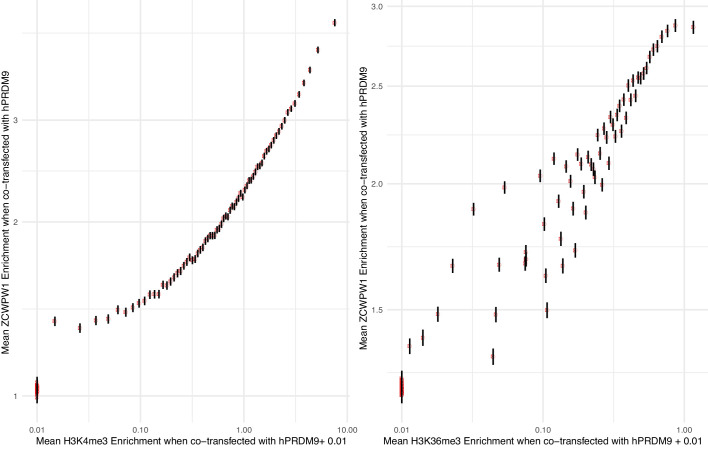
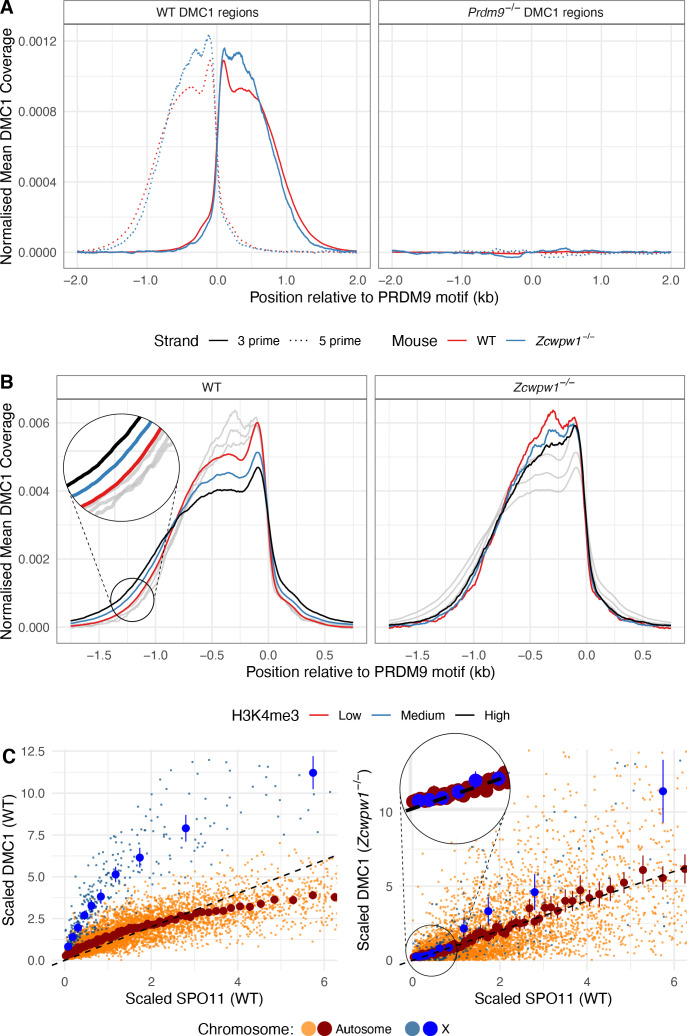
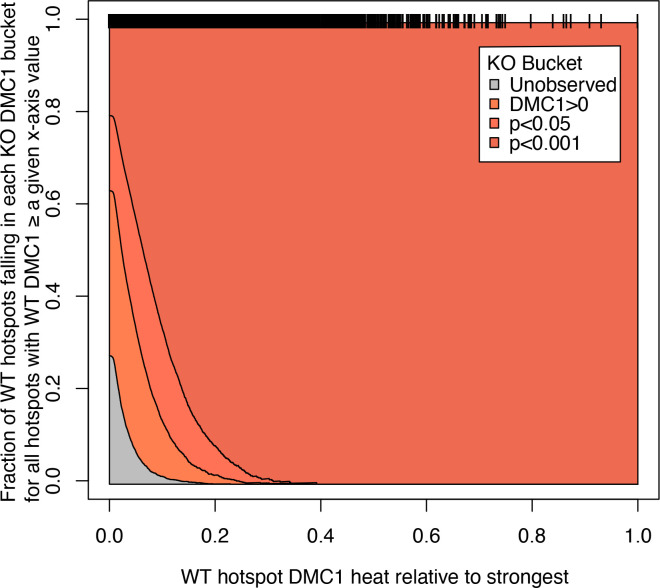
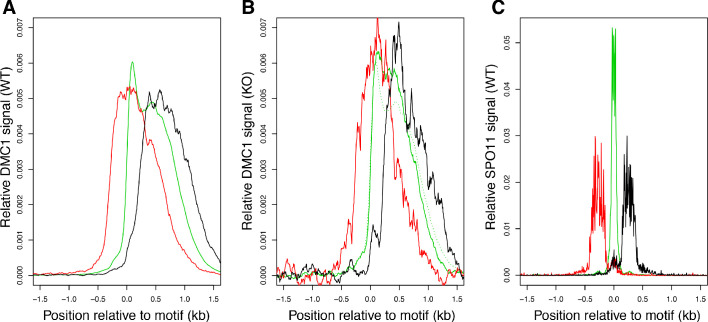
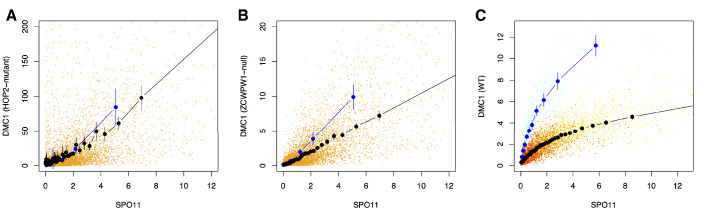
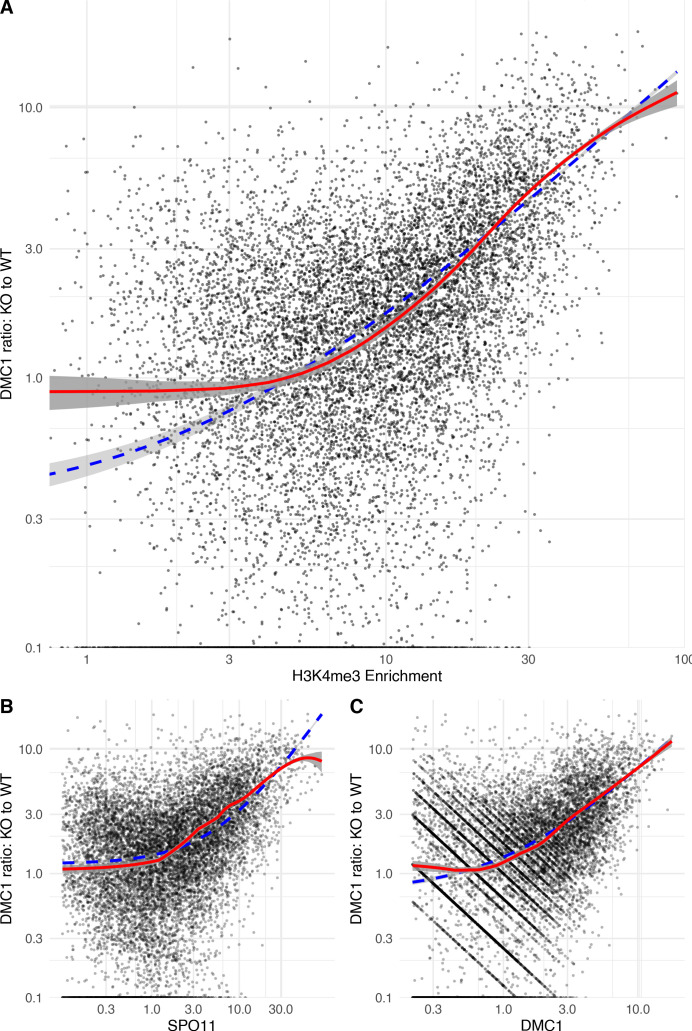
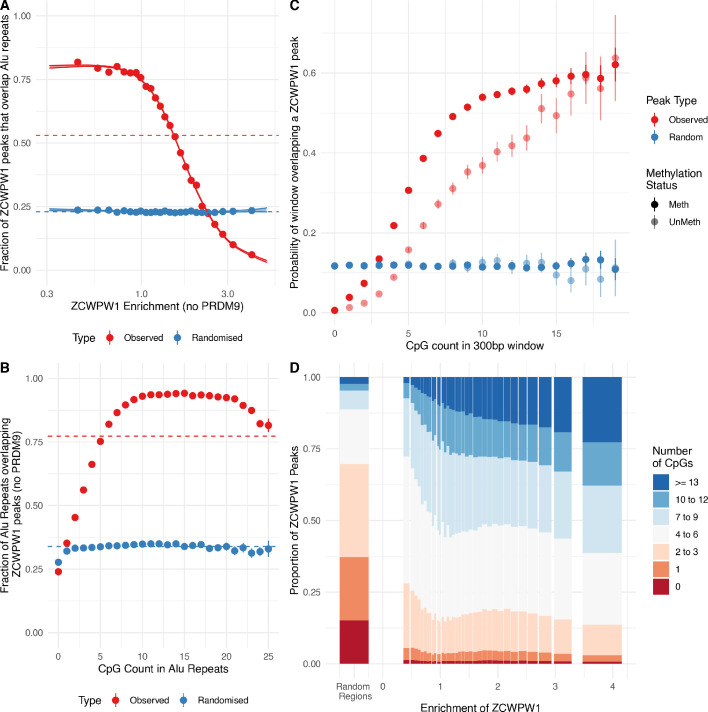
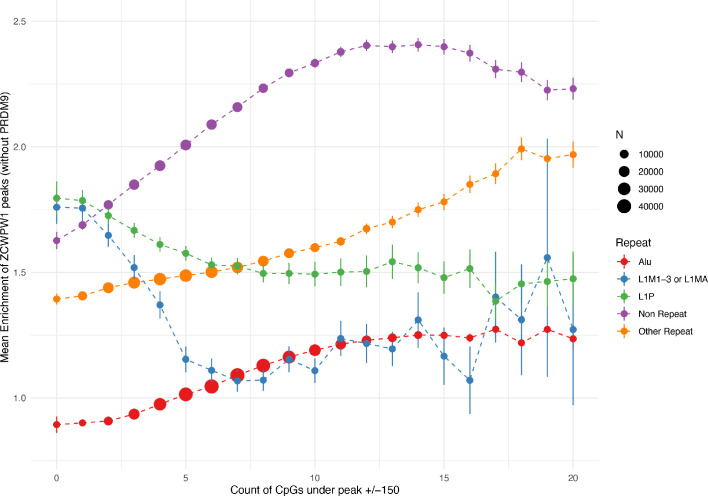
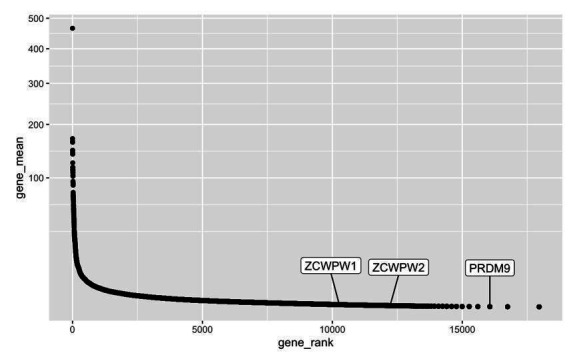
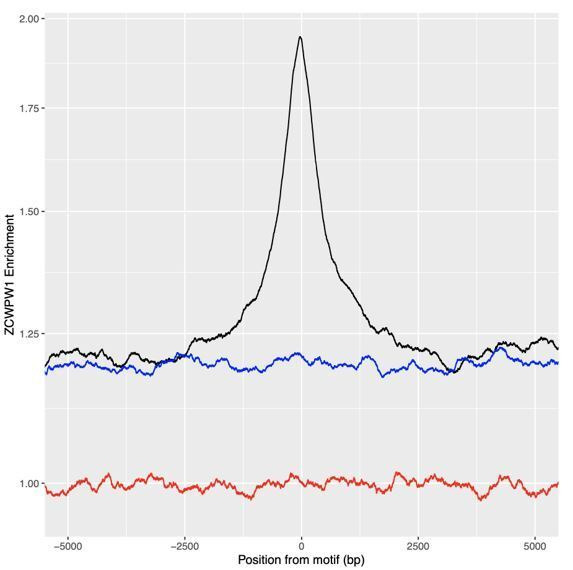
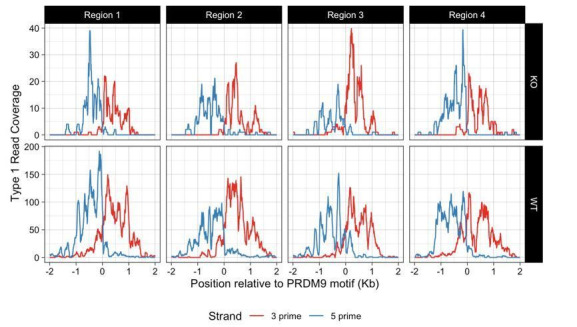
During meiosis, homologous chromosomes pair and recombine, enabling balanced segregation and generating genetic diversity. In many vertebrates, double-strand breaks (DSBs) initiate recombination within hotspots where PRDM9 binds, and deposits H3K4me3 and H3K36me3. However, no protein(s) recognising this unique combination of histone marks have been identified. We identified Zcwpw1, containing H3K4me3 and H3K36me3 recognition domains, as having highly correlated expression with Prdm9. Here, we show that ZCWPW1 has co-evolved with PRDM9 and, in human cells, is strongly and specifically recruited to PRDM9 binding sites, with higher affinity than sites possessing H3K4me3 alone. Surprisingly, ZCWPW1 also recognises CpG dinucleotides. Male Zcwpw1 knockout mice show completely normal DSB positioning, but persistent DMC1 foci, severe DSB repair and synapsis defects, and downstream sterility. Our findings suggest ZCWPW1 recognition of PRDM9-bound sites at DSB hotspots is critical for synapsis, and hence fertility.

Keywords: DMC1; PRDM9; ZCWPW1; double strand break repair; genetics; genomics; human; meiosis; mouse; recombination.

Plain language summary

Sexual reproduction – that is, the combination of sex cells from two different individuals to produce an embryo – is one of the many mechanisms that have evolved to maintain genetic diversity. Most human cells contain 23 pairs of chromosomes, with each chromosome in a pair carrying either a paternal or maternal copy of the same gene. To form an embryo with the right number of chromosomes, each sex cell (the egg or sperm cell) must only contain one chromosome from each pair. Sex cells are produced from parent cells containing two sets of paternal and maternal chromosomes: these cells then divide twice to form four sex cells which contain only one chromosome from each pair. Before the parent cell divides, a process known as ‘recombination’ takes place, which allows chromosomes in a pair to exchange bits of genetic information. This reshuffling ensures that each chromosome in a sex cell is unique. A protein called PRDM9 helps control which sections of genetic information are recombined by modifying proteins attached to the chromosomes, marking them as locations for exchange. The DNA at each of these sites is then broken and repaired using the genetic sequence of the chromosome it is paired with as a template, thus causing the two chromosomes to swap genes. In 2019, a group of researchers found a set of genes in the testis of mice that are expressed at the same time as the gene for PRDM9. This suggested that another protein called ZCWPW1 is likely involved in recombination, but the precise role of this protein was unclear. To answer this question, Wells, Bitoun et al. – including many of the researchers involved in the 2019 study – examined human cells grown in the laboratory to determine where ZCWPW1 binds to in the chromosome. This revealed that ZCWPW1 can be found at the same sites as PRDM9, which is responsible for bringing it there. Furthermore, cells from male mice lacking the gene for ZCWPW1 cannot complete the exchange of genetic information between chromosomes, meaning that the mice are infertile. As such, ZCWPW1 seems to connect location selection by PRDM9 to the DNA repair mechanisms needed for gene exchange between chromosomes. Infertility is a significant issue for humans affecting as many as one in every six couples. Fertility is complex and many of the biological mechanisms involved are not fully understood. This work suggests that both PRDM9 and ZCWPW1 are key to the production of sex cells and may be worth investigating as factors that affect fertility in humans.


Conflict of interest statement

DW, EB, DM, GZ, AH, JJ, PD, CG, SM No competing interests declared

Figures

Figure 1.
Figure 1.. Domain organisation (A) and evolutionary conservation (B) of ZCWPW1, and co-evolution with PRDM9 (C,D).
(A) Protein domains in the human and mouse proteins (source: UniProt). Amino acid start and end positions of each domain are shown above and below the rectangles, respectively. Prediction of SCP-1 (SYCP1) domain from Marchler-Bauer and Bryant, 2004 and of MBDs (methyl-CpG binding domain) from Lobley et al., 2009 (Materials and methods). (B) Conservation of human amino acids, normalised Jensen-Shanon divergence normalised to mean of 0 and standard deviation of 1 is shown on the y-axis (a measure of sequence conservation, see Capra and Singh, 2007 and Johansson and Toh, 2010) computed from using multiple alignment of 167 orthologues (Materials and methods). (C) All species we identified as possessing ZCWPW1 copies were phylogenetically grouped into clades as previously (Baker et al., 2017) (x-axis) and each clade divided (stacked bars) according to whether ZCWPW1-possessing species within it also possess PRDM9 (‘Species’, red) or instead their closest PRDM9-possessing relative is respectively in the same genus/family, order, clade or order/phylum, with colours as given in the ‘Closest PRDM9’ legend. (D) As (C), but now showing the closest relative possessing ZCWPW1 (‘Closest ZCWPW1’ legend) for species possessing complete, partial or no identified PRDM9 copies. As in (C), the x-axis groups species into clades, now further divided based on data from Baker et al., 2017 into subclades according to the domains of PRDM9 lost or mutated across that subclade in all observed copies, reflecting multiple partial losses of particular PRDM9 domains, or complete loss of all PRDM9 copies (Main text). The x-axis labels are ordered and coloured according to the PRDM9 domains present (‘PRDM9 domains’ legend, where ‘SET’ refers to PRDM9’s PR/SET domain and the KRAB and SSXRD domains are grouped as ‘non-SET’, and ‘partial’ losses are seen in some but not all PRDM9 copies in that species). Further details are presented in Materials and methods, and the raw data in Figure 1—source datas 1 and 2.
Figure 1—figure supplement 1.
Figure 1—figure supplement 1.. ZCWPW1 is specifically expressed in testis in humans.
Data Source: GTEx Analysis Release V7 (dbGaP Accession phs000424.v7.p2). (A) Total expression by human tissue type. (B) Isoforms of ZCWPW1 expressed in human testis.
Figure 2.
Figure 2.. Expression of ZCWPW1 across meiosis prophase I in mouse testis.
Nuclear spreads from 9 to 10 weeks old WT mice were immunostained with antibodies against ZCWPW1 (red) and the synaptonemal complex protein SYCP3 (green) which labels the chromosome axis, and counterstained with DAPI (blue) to visualise nuclei. Developmental stages are indicated above and below. Yellow arrows point to ZCWPW1 foci clearly visible at both ends of the synaptonemal complex in mid-late pachytene. Additional evidence is provided in Figure 2—figure supplement 2. The dashed circle shows staining in the XY body. Images for the individual channels are provided in Figure 3—figure supplement 1. These images are representative of the results obtained in three mice. Scale bar: 10 μm.
Figure 2—figure supplement 1.
Figure 2—figure supplement 1.. ZCWPW1 antibody generation and validation.
(A) Expression and purification of full-length recombinant mouse ZCWPW1 (mZCWPW1) in E. Coli. Left panel: SDS-PAGE analysis and Coomassie blue staining of bacterial lysates before (pre-IPTG) and after (post-IPTG) induction of protein expression with IPTG, the soluble protein fraction (after cell sonication) used for purification, the flow through (incompletely depleted from the target protein) after incubating the soluble fraction with Talon resin beads to bind His-tagged mZCWPW1, the wash containing 5mM imidazole, the protein eluate from the beads using 300mM imidazole, and the purified recombinant protein after further purification from low molecular weight (MW) contaminants by size exclusion. Right panel: Western blot detection of purified His-tagged mZCWPW1 using an anti-His and a mouse polyclonal antibody raised against the human protein (previously tested positively against mouse ZCWPW1 overexpressed in HEK293T cells). *Indicates degradation fragments (likely C-terminal). The purified protein was used to immunise rabbits and produce an antiserum against mZCWPW1. (B-E) Validation of the rabbit ZCWPW1 antiserum by immunofluorescence staining (IF), immunoprecipitation (IP) and western blotting (WB) in B6 testis (B,C) and transfected HEK293T cells (D,E). (B) Testis nuclear spreads from 10 weeks old B6 mice were immunostained with the ZCWPW1 antiserum or the pre-immune serum (red), and chromosome axes were labeled with SYCP3 (green). Representative mid-zygotene and early pachytene cells are shown. No signal is detected by the pre-immune serum. Scale bar: 10μm. (C) IP-WB detection of mZCWPW1 from 10 weeks old B6 mouse testis. Left panel: Lane 1, 100 µg protein extract; Lanes 2–3, IP from 2.6 mg protein extract using ZCWPW1 antiserum (lane 2) or the pre-immune serum (lane 3). The ZCWPW1 antibody detects a unique protein band within the expected MW range (predicted at 70.5 KDa) both by direct WB (lane 1) and IP-WB (lane 2). No signal is detected by the pre-immune serum (lane 3). Right panel: the testis protein extract was resolved on a higher (4–20%) SDS-PAGE gel; no detection of ZCWPW2 is observed by WB at the 38KDa MW range predicted for mouse ZCWPW2, only a single band is present within the expected MW range for ZCWPW1. The images in (B–C) are representative of the results obtained in two mice. (D) Specific IP-WB and WB detection of FLAG-tagged mZCWPW1 over ZCWPW2 from transfected HEK293T cells. Lanes 1,3: protein extracts from untransfected cells; Lanes 2,4: protein extracts from cells transfected with mZCWPW1-FLAG (lane 2) or mZCWPW2-FLAG (lane 4). Lanes 1–2, 5 µg extracts; lanes 3–4: 50 µg extracts. The ZCWPW1 antiserum detects the same protein band as the anti-FLAG antibody in the expected MW range (74 KDa) both by direct WB and by IP-WB, but does not show any reactivity against mZCWPW2-FLAG. The preimmune serum does not detect the mZCWPW1-FLAG protein band. Detection of beta-actin serves as a loading control. The asterisk indicates degradation fragments typically observed, as in (A). (E) Specific IF detection of FLAG-tagged mZCWPW1 over ZCWPW2 from transfected HEK293T cells. Cells were co-immunostained with ZCWPW1 antiserum or the pre-immune serum (green), and a FLAG antibody (red). The ZCWPW1 antiserum detects mZCWPW1-FLAG (precisely overlapping the signal detected by the FLAG antibody results in yellow fluorescence in the merged image), but not mZCWPW2-FLAG protein. No signal is detected with the pre-immune serum.
Figure 2—figure supplement 2.
Figure 2—figure supplement 2.. ZCWPW1 localises to both subtelomeric and subcentromeric regions of chromosomes in pachytene cells.
(A) Testis chromosome spreads from 10-week-old WT mice were immunostained for SYCP3 and ZCWPW1, and hybridised by FISH with distal telomeric (Tel) and proximal centromeric (Cen) probes. To aid the visualisation of each signal, the bottom right merged image was decomposed into multiple combinations of two to three individual channels, as indicated. Note that the ZCWPW1 foci do not exactly co-localize with the FISH signals, and generally lie more internally (subtelomerically and subcentromerically) on the chromosome axis. These images are representative of the results obtained for three mice. Scale bar: 10 μm. (B) The localisation of ZCWPW1 foci to either Tel or Cen end, or both ends, of the synaptonemal complex was quantified in mid-Pachytene to late-Diplotene cells. Chromosomes that did not show any ZCWPW1 foci were recorded as ‘not labeled’. Error bars represent 95% confidence intervals using the Wilson method. n = 3–25 cells of each stage from one mouse. Raw data in Figure 2—source data 1.
Figure 3.
Figure 3.. Zcwpw1−/ male mice show reduced testis size and asynapsis, similar to the Prdm9−/− mutant.
(A) Schematic of the Zcwpw1 knockout (KO) mouse line. E: Exon. gRNA: guideRNA. Sanger sequencing DNA chromatograms of wild-type (WT) and KO mice encompassing the deletion are shown. The intron-exon organisation is not to scale. (B) Immunofluorescence staining of testis nuclear spreads from 9- to 10-week-old Zcwpw1+/+ and Zcwpw1−/− mice for ZCWPW1 or HORMAD2 (red) which marks asynapsed chromosomes, and the synaptonemal complex protein SYCP3 (green) which labels the chromosome axis. Cells were counterstained with DAPI (blue) to visualise nuclei (top images). These images are representative of the data obtained for three mice per genotype. Scale bar: 10 μm. (C) Representative testes from 9- to 10-week-old WT (+/+), Het (+/−) and Hom (−/−) Zcwpw1 KO mice are shown. (D) Paired testes weight was normalised to lean body weight. Each datapoint represents one mouse. The p-value is from Welch’s two sided, two sample t-test. Raw data in Figure 3—source data 1. (E) Synapsis quantification in testis chromosome spreads immunostained with HORMAD2, as in (B). The percentage of mid-Pachytene (WT) or pseudo-Pachytene (Zcwpw1−/− and Prdm9−/−) cells with all autosomes fully synapsed is plotted by genotype; each datapoint represents one mouse, each with n≥ 49 cells analysed. Vertical lines are 95% Wilson binomial confidence intervals. Raw data in Figure 3—figure supplement 2—source data 1.
Figure 3—figure supplement 1.
Figure 3—figure supplement 1.. Loss of ZCWPW1 expression in Zcwpw1−/− mouse testis.
(A) Testis protein extracts from adult (10–12 weeks old) B6 wild-type (WT), Zcwpw1−/− and Prdm9−/− were immunoprecipitated with an anti-ZCWPW1 antibody (2.7mg/IP), followed by western blot detection with the same antibody. Detection of beta-actin from protein extracts (100µg) shows equal input for IP. (B) Testis chromosome spreads from 9- to 10-week-old Zcwpw1+/+ and Zcwpw1−/− mice were immunostained with antibodies against the synaptonemal complex protein SYCP3, and ZCWPW1, and counterstained with DAPI to visualise nuclei. Developmental stages are indicated at the top. The top row of panels shows merged signals, and the bottom rows individual signals. For ease of comparison, the boundaries of the mid-Leptotene cell in the Zcwpw1+/+ sample are marked by a rectangle. Red arrows point to ZCWPW1 foci at the ends of the synaptonemal complex (white arrows in the single-channel image). The yellow arrow points to the XY body. These images are representative of the results obtained for three mice per genotype. Scale bar: 10 μm.
Figure 3—figure supplement 2.
Figure 3—figure supplement 2.. Asynapsis, and lack of XY body formation and crossover sites in Zcwpw1−/− mouse testis.
Testis chromosome spreads from 9- to 12-week-old WT, Zcwpw1−/− and Prdm9−/− mice were immunostained with antibodies against SYCP3 (A–B), γ-H2AX (phosphorylated form) and HORMAD2 (A), or MLH1 and DMC1 (B), and counterstained with DAPI (A–B). WT Pachytene cells show full synapsis of all autosomes, an XY body strongly labeled by γ-H2AX and at least one (obligate) crossover site per chromosome labeled by MLH1. In contrast, many chromosomes are asynapsed and the XY body is absent in pseudopachytene cells from Zcwpw1−/− and Prdm9−/− mice; in the Zcwpw1−/− mutant, no MLH1 foci are observed either, and many DMC1 foci persist on asynapsed chromosomes. In the Prdm9−/− mutant, mispairing of homologues is evident by the formation of branched structures referred to as ‘tangled’ chromosomes in the text and Figure 3—figure supplement 2—source data 1. These images are representative of the results obtained for two (Prdm9−/−) to three mice (WT and Zcwpw1−/−) per genotype. Scale bar: 10 μm.
Figure 4.
Figure 4.. Similar DMC1 count elevation in Zcwpw1−/− and Prdm9−/− mice, compared to wild-type.
(A) Testis chromosome spreads from 9- to 10-week-old Zcwpw1+/+ and Zcwpw1−/− mice were immunostained for DMC1 and SYCP3. Late (pseudo)-Pachytene cells are shown. These images are representative of the data obtained for three mice per genotype. Scale bar: 10 μm. (B) The number of DMC1 foci in cells from the indicated stages of prophase I were counted; see Figure 4—source data 1 for number of cells per stage per mouse. p-values are from Welch’s two sided, two sample t-test. L: Leptotene, Z: Zygotene, P: Pachytene. n = 3 mice for Zcwpw1−/− and wild-type, n = 2 for Prdm9−/−. Raw data in Figure 4—source data 1.
Figure 4—figure supplement 1.
Figure 4—figure supplement 1.. Similar RAD51 count elevation in Zcwpw1−/− and Prdm9−/− mice, compared to wild-type.
(A) Testis chromosome spreads from 9- to 10-week-old Zcwpw1+/+ and Zcwpw1−/− mice were immunostained with antibodies against the synaptonemal complex protein SYCP3 and the recombinase RAD51, and counterstained with DAPI to visualise nuclei. Developmental stages are indicated at the top. These images are representative of the results obtained for three mice per genotype. Scale bar: 10 μm. (B) The number of RAD51 foci in cells from the indicated stages of prophase I were counted; see Figure 4—source data 1 for the number of cells per stage per mouse. p-values are from Welch’s two sided, two sample t-test. L: Leptotene, Z: Zygotene, P: Pachytene. n = 2 mice per genotype (Zcwpw1−/− and WT), n = 1 for Prdm9−/− (Raw data in Figure 4—source data 1).
Figure 4—figure supplement 2.
Figure 4—figure supplement 2.. RPA2 count elevation in the Zcwpw1−/− mouse.
(A) Testis chromosome spreads from 9- to 10-week-old Zcwpw1+/+ and Zcwpw1−/− mice were immunostained with antibodies against SYCP3 and RPA2, and counterstained with DAPI to visualise nuclei. Developmental stages are indicated on the side. These images are representative of the results obtained for three mice per genotype. Scale bar: 10 μm. (B) The number of RPA2 foci in cells from the indicated stages of prophase I were counted; see Figure 4—source data 1 for the number of cells per stage per mouse. p-values are from Welch’s two sided, two sample t-test. Z: Zygotene, P: Pachytene. n = 3 mice per genotype (Raw data in Figure 4—source data 1).
Figure 4—figure supplement 3.
Figure 4—figure supplement 3.. DSB repair is delayed with accumulation of DMC1 on asynapsed chromosomes in the Zcwpw1−/− mouse.
Testis chromosome spreads from 9- to 10-week-old Zcwpw1+/+ and Zcwpw1−/− mice were immunostained for DMC1, HORMAD2, and SYCP3. Representative images of two mutant pseudo-pachytene cells show accumulation of DMC1 foci on HORMAD2-positive asynapsed chromosomes. In contrast wild-type pachytene cells only show residual DMC1 foci on partially synapsed XY sex chromosomes. Note that in mutant cells, even synapsed chromosomes abnormally retain some level of DMC1. These images are representative of the results obtained for three mice per genotype. Scale bar: 10 μm.
Figure 5.
Figure 5.. Enrichment and binding profiles of ZCWPW1 and other factors.
(A) Enrichment of ZCWPW1 (with vs without PRDM9) at PRDM9-binding sites when co-transfected with PRDM9 with either Human or Chimp Zinc Finger (Materials and methods section ‘Enrichment Profiles’). Q = quartile. Human PRDM9 sites are centered and stranded by the motif. Y-axis is log10 scale (y-axis labels remaining in linear space). (B) Profiles and heatmaps of reads from cells co-transfected with human (h) or chimp (c) PRDM9 around the top 25% of individual human PRDM9-binding sites (rows). Heatmaps: log-fold change of target (indicated in column titles, Materials and methods) vs input, for various labelled target proteins, ordered by human PRDM9. ZCWPW1, H3K4me3 and H3K36me3 each become enriched at human PRDM9 sites, following (co-)transfection with human PRDM9. Profiles: Sum of all target coverage divided by sum of all input coverage for all regions shown in the heatmap, shown on a linear scale. w\o, without. (C) ChIP-seq data and annotation in a genome plot illustrate the behaviour of ZCWPW1 and other factors. ChIP-seq tracks show fragment coverage. Tracks where PRDM9 is present are labeled ‘w/PRDM9’, and below, corresponding tracks without PRDM9. ZCWPW1 binds to Alus, CpG islands and other CpG-rich sequences even in the absence of PRDM9. On addition of PRDM9, ZCWPW1 becomes strongly enriched at PRDM9 binding locations (center left peak within DIO1). mCpG, methylated CpG.
Figure 5—figure supplement 1.
Figure 5—figure supplement 1.. Correlation between PRDM9 enrichment and ZCWPW1 enrichment at sites of PRDM9 binding.
ZCWPW1 binding with vs without PRDM9 was force called at sites with PRDM9 peaks (Materials and methods). Peaks were excluded if PRDM9 input coverage was ≤10 or ZCWPW1 input coverage was ≤3. Additionally, the top 10 peaks (out of 8,373) by enrichment for each of PRDM9 and ZCWPW1 were excluded to remove outliers. The red dashed line shows the fit of a linear model (log(ZCWPW1+0.1)~a + b*log(PRDM9+0.1)) and the blue line and grey error shows a Generalised Additive Model smooth. For plotting, each axis is displayed with a log10 scale (with break values shown in linear space) and 0.1 was added to all values (x and y) to avoid infinite values.
Figure 5—figure supplement 2.
Figure 5—figure supplement 2.. Proportion of ZCWPW1 peaks, ordered by enrichment of ZCWPW1 binding over input, overlapping various other marks.
For example dark green peaks are those which overlap with ZCWPW1 peaks when transfected alone, but not overlapping Human PRDM9 peaks, and not overlapping pre-existing H3K4me3 peaks but do overlap with Alu repeats. Pre-existing H3K4me3 refers to H3K4me3 peaks found without PRDM9 or ZCWPW1 transfection. The three plots show results for peaks in HEK293T cells with ZCWPW1 transfected alone (Left), PRDM9+ZCWPW1 co-transfection (Middle), and peaks whose ZCWPW1 occupancy increases in PRDM9+ZCWPW1 vs ZCWPW1 transfected alone (Right, Materials and methods). In cells expressing ZCWPW1 in the presence (middle plot) but not in the absence (left plot) of PRDM9, the strongest peaks are dominated by PRDM9-bound sites marked by H3K4me3 (pink), while ZCWPW1 occupancy increases occur nearly exclusively at these sites, following co-transfection with PRDM9 (right plot).
Figure 5—figure supplement 3.
Figure 5—figure supplement 3.. Enrichment of ZCWPW1 when co-transfected with human or chimp PRDM9 is dependent on the ability of ZCWPW1 to bind, more weakly, in the absence of PRDM9 (there are no peaks with high co-transfected enrichment [y-axis] when the untransfected enrichment [x-axis] is close to 0) and co-transfecting with PRDM9 increases the enrichment.
Enrichment was force called in 100bp windows across all autosomes. Data is conditioned on having input coverage of >5 and enrichment >0.01 for both axes. Hexagons are coloured if at least three data points are present. Solid lines show density contours estimated by MASS::kde2d() in R.
Figure 5—figure supplement 4.
Figure 5—figure supplement 4.. Co-expression of ZCWPW1 and PRDM9 in HEK293T cells.
Cells were co-transfected with human (h) or chimp (c) PRDM9-YFP-V5 (hPRDM9-YFP-V5 or cPRDM9-YFP-V5, respectively) and ZCWPW1-HA, or mock transfected (untransfected). (A) Direct microscopic observation of transfected cells shows high and comparable levels of YFP fluorescence emitted from hPRDM9-YFP-V5 and cPRDM9-YFP-V5. (B) Immunofluorescence staining against the protein tags (HA and V5) shows high and comparable expression levels of each protein across transfected samples, and a reasonable proportion of co-expressing cells with merged overlapping signals (ranging from light green to yellow and light red depending on the expression ratio of the two proteins).
Figure 5—figure supplement 5.
Figure 5—figure supplement 5.. Profiles and heatmaps of reads at locations of either chimp PRDM9 binding or ZCWPW1 binding when co-transfected with human PRDM9.
(A) Profiles and heatmaps of reads at locations of chimp PRDM9 (cPRDM9) binding. Heatmaps show log fold change of sample (as indicated in the title of each column, Materials and methods) vs input, for the top ¼ of cPRDM9 peaks, for various samples, ordered by cPRDM9. ZCWPW1 is found at sites of cPRDM9 peaks, when co-transfected with cPRDM9, but not at human PRDM9 (hPRDM9) peaks. w\o, without. (B) Profiles and heatmaps of reads at locations of ZCWPW1 binding co-transfected with human PRDM9 (hPRDM9). Heatmaps show log fold change of sample (as indicated in the title of each column, Materials and methods) vs input, for the top ¼ of ZCWPW1 peaks when co-transfected with PRDM9, for various samples, ordered by first column. Note that H3K4me3, H3K36me3 and hPRDM9 are found at ZCWPW1 peaks when co-transfected with hPRDM9.
Figure 5—figure supplement 6.
Figure 5—figure supplement 6.. Among human PRDM9 binding sites, we identified those at which male recombination hotspots occur, defined by the presence/absence of an overlapping human DMC1 peak, and fitted a linear model to predict this hotspot status based on PRDM9 binding strength (PRDM9 Only), ZCWPW1 enrichment (with human PRDM9 vs without, referring to enrichment of ZCWPW1 co-transfected with PRDM9 relative to ZCWPW1 transfected alone), or both (see Materials and methods ‘DMC1 prediction’). We fitted a logistic regression model, and present the results in the form of standard Receiver Operating Characteristic curves (A) and Precision Recall Curves (B).
Lines with greater area under the curve (those higher up) represent greater predictive ability (models better able to classify/separate PRDM9 sites into those with DMC1 binding and those without). Black dotted lines show a baseline of random prediction. TPR: True positive rate, FPR: False positive rate. PPV: positive predictive value (proportion of predicted positives that are true positives). Estimated PRDM9-dependent ZCWPW1 enrichment (green) provides a better predictor than does PRDM9 binding strength (blue).
Figure 6.
Figure 6.. PRDM9-bound regions (H3K4me3 and H3K36me3) are a stronger recruiter of ZCWPW1 than promoters (H3K4me3 only).
For any given level of H3K4me3 (x-axis), ZCWPW1 enrichment (y-axis) is higher at PRDM9-bound regions (red) than regions with pre-existing H3K4me3 (promoters, blue). H3K4me3 and ZCWPW1 were force called in 100bp windows across all autosomes. These windows were split into two sets defined as indicated in the legend (where ‘p’ is the p-value from peak-calling required for a window to be included in the subset) with the additional constraint of requiring input fragment coverage >5 for ZCWPW1 and >15 for H3K4me3. p: p-value for non-zero level of input corrected coverage in that bin. ‘pre-existing H3K4me3’ refers to H3K4me3 that is present without transfection (of either PRDM9 or ZCWPW1), which is mainly found at promoter regions. For each subset, H3K4me3 was split into 25 bins with equal number of data points. Horizontal bars: two standard errors of the mean. Vertical dotted bars: upper and lower quartiles. Grey ribbons show two standard errors for a Generalized additive model on log(mean H3K4me3 enrichment + 0.1). Dashed black horizontal line highlights that the mean enrichment of the highest bin for promoters is similar to that of the lowest bin for PRDM9-bound sites.
Figure 6—figure supplement 1.
Figure 6—figure supplement 1.. ZCWPW1 binding is positively associated with levels of both H3K4me3 and H3K36me3 marks.
Fraction of ZCWPW1 peaks (co-transfected with PRDM9 with input coverage of at least 5) that overlap either (A) H3K4me3 or (B) H3K36me3 peaks, for different bins of ZCWPW1 enrichment (100 equal sample size bins of increasing ZCWPW1 enrichment). Error bars show ±2 s.e. of the proportion. ‘Randomised’ shows expected proportions when x-axis regions are randomly shifted within a range of 100 million bases (or the chromosome size if lower). Dotted lines show overall means for each colour.
Figure 6—figure supplement 2.
Figure 6—figure supplement 2.. Enrichment from 100-bp non-overlapping windows, genome-wide, is binned into 100 equal sample size bins by either.
(A) H3K4me3 or (B) H3K36me3 levels, and mean enrichment of ZCWPW1 co-transfected with PRDM9 is plotted for each bin (error bars show ±2 s.e. of the mean). This is in some sense opposite (but complementary) to Figure 6—figure supplement 1 in which the subject of the axis is reversed. Windows with evidence of PRDM9-independent H3K4me3 have been removed from the H3K4me3 plot. Additionally, x-axis regions were removed if input reads were <15 and y-axis regions if <5. 0.01 has been added to the x-axis values in order to display enrichment estimates of zero on the log scale.
Figure 7.
Figure 7.. DMC1 levels in the Zcwpw1−/− mouse compared to DMC1 and SPO11 levels in WT.
(A) DSBs occur at normal hotspot locations in the Zcwpw1−/− male mouse. Average coverage of reads from DMC1 SSDS ChIP-seq in a 10-week-old mouse at previously mapped regions (Materials and methods) in B6 WT (left) and Prdm9−/− (right) mice is shown, centered at the PRDM9 motif (left). DMC1 profiles from a WT mouse are shown in red, data from Brick et al., 2012. (B) Normalised DMC1 profile (both strands combined) is plotted for WT and Zcwpw1−/−, stratified by H3K4me3 (a proxy for PRDM9 binding). Low: <50th percentile cumulative enrichment, High: >75th percentile cumulative enrichment, with Medium being the remaining data. Greyed out lines show the alternative genotype for comparison. (C) Relationship between WT SPO11-oligos (measuring the number of DSBs) vs DMC1 (a measure of the number and persistence of DSBs) at each B6 hotspot for WT and Zcwpw1−/−. Unlike WT mice, DMC1 signals in Zcwpw1−/− mice are approximately linearly associated with WT SPO11. The DMC1 enrichment was force called at the positions of B6 WT hotspots. Black dashed line is y = x for reference. SPO11 and DMC1 enrichment have been scaled by dividing by the mean autosomal enrichment. Large dark blue and dark red points show mean DMC1 signal, binned into groups containing equal numbers of hotspots by WT SPO11 signal (vertical lines: corresponding 95% CIs), for X (10 bins) and autosomal data (100 bins) respectively (smaller lighter dots represent individual hotspots).
Figure 7—figure supplement 1.
Figure 7—figure supplement 1.. Fraction of wild-type (WT) hotspot locations seen in Zcwpw1−/− DMC1 ChIP-seq at different p-values.
Black bars along the top of the plot show the heat of individual hotspots relative to the hottest, according to the DMC1 data, in the WT male mouse. Y-axis values at x = 0 show the fraction of all hotspots falling into the buckets shown in the inset colour legend. As the x-axis increases the y-axis values show the same thing, but only for those hotspots with a heat greater than or equal to the x-axis value, that is those black bars further to the right. Therefore, almost all WT hotspots with activity >20% of the hottest hotspot are observed, and non-observed hotspots show only weak activity in WT, and so our power to detect them is expected to be reduced. ‘DMC1>0’ refers to the hotspot locations at which DMC1 signal is observed in Zcwpw1−/− DMC1 ChIP-seq, but with significance level (p-value) greater than or equal to 0.05, ‘p<0.05’ refers to the locations at which this significance level is less than 0.05 but greater or equal to 0.001, and ‘p<0.001’ refers to locations at which the p-value is less than 0.001.
Figure 7—figure supplement 2.
Figure 7—figure supplement 2.. DSBs in Zcwpw1−/− are positioned at WT locations within hotspots.
Hotspots relative to PRDM9 binding motif: upstream (red), downstream (black), central (green). For DMC1 hotspots with an identified PRDM9-binding motif (Materials and methods), we measured positions relative to this motif and identified hotspots in three groups according to SPO11 signal: Green: active hotspots (top 30%) with >90% of the SPO11 signal in the central 300bp region. Red: >90% upstream of the PRDM9 binding motif (position <0) and <50% central. Black: >90% downstream of the PRDM9 binding motif and <50% central. We then plotted the average profiles of DMC1 in wild-type (WT) (left), DMC1 in Zcwpw1−/− (KO) mice (middle) and SPO11 (right), normalised to have unit area. Hotspots with more upstream/downstream DSB sites (SPO11) also show more upstream/downstream DMC1 signals, in both WT and KO mice.
Figure 7—figure supplement 3.
Figure 7—figure supplement 3.. Relationship between WT SPO11-oligos (measuring the number of DSBs) vs DMC1 (a measure of the number and persistence of DSBs) at each B6 hotspot for Hop2−/− male mice (A) Zcwpw1−/− (B) and WT (C) as in Figure 7C are replotted, for comparison.
Similarly to Figure 7C, the DMC1 enrichment was force called at the positions of B6 WT hotspots, in the Hop2−/− data from GSM851661 (Khil et al., 2012). SPO11 and DMC1 enrichment have been scaled by dividing by the mean autosomal enrichment. Blue points are X chromosome data, orange points are autosomal. Large blue and black points show mean DMC1 signal binned into groups containing equal numbers of hotspots by WT SPO11 signal (vertical lines: corresponding 95% CIs), for X and autosomal data, respectively. Other details as for Figure 7C. Hop2−/− (A) and Zcwpw1−/− (B) mouse KO mutants show a similar linear relationship of DMC1 ChIP-seq vs SPO11.
Figure 7—figure supplement 4.
Figure 7—figure supplement 4.. Regression of the ratio of DMC1 signal in the Zcwpw1−/− (KO) vs wild-type (WT) male mice against H3K4me3 [a proxy of PRDM9 binding] (A), SPO11 (B), and DMC1 (C) in WT.
The DMC1 signal in the KO relative to the WT increases as H3K4me3 (~PRDM9) increases. We calculated the ratio of KO to WT DMC1 force-called enrichment at each autosomal B6 mouse hotspot not overlapping pre-existing H3K4me3. We excluded weak hotspots whose estimated SPO11 or DMC1 WT heats were in the bottom 10% (because accurate ratio estimation is not possible for these hotspots). Dots: the force-called signal strength (of either H3K4me3, SPO11 or WT DCM1), vs the ratio, for each of the resulting hotspots. Blue dashed line, linear regression line of best fit (fit in linear space, displayed in log space). Red line: Generalised Additive model (able to fit non-linear effects if present, again fit in linear space).
Figure 8.
Figure 8.. ZCWPW1 binds CpG-rich sequences such as Alu repeats.
(A) Fraction of overlap of ZCWPW1 binding peaks, , with Alusin HEK293T cells transfected with ZCWPW1 alone, ordered by enrichment in ZCWPW1 binding. ZCWPW1 peaks are binned into 25 bins with equal number of data points, and means of both enrichment and overlap are plotted. Solid ribbons: prediction from GAM logistic regression. Dotted lines: overall means. Red points show actual observed peaks, blue points the same number of peaks placed at random genomic positions. (B) Rate of overlap of Alu repeats with ZCWPW1 peaks, for Alus with different numbers of CpG dinucleotides. Other details as A. (C) The probability of a 300bp window on an autosome overlapping a ZCWPW1 peak increases with increasing CpG count in that window. Windows overlapping (by 10bp or more) Alus, other repeats, or CpG islands have been excluded. Methylated CpG regions (full colour) are those with a methylated to unmethylated reads ratio of >0.75, and unmethylated <0.25 (semi-transparent, Materials and methods). (D) Relative proportion of peaks with given numbers of CpGs (stacked bars) +/− 150bp from peak center, within peaks binned by ZCWPW1 enrichment (x-axis). ZCWPW1 peaks are enriched in CpGs compared to random peak locations (leftmost bar). ‘Meth’, methylated; ‘UnMeth’, unmethylated.
Figure 8—figure supplement 1.
Figure 8—figure supplement 1.. CpG count around ZCWPW1 peaks (+/− 150bp, for those peaks with input coverage >5) is positively associated with ZCWPW1 enrichment score (measuring the level of ZCWPW1 recruitment) in both peaks overlapping Alus and peaks not overlapping Alus, but not at L1M1-3, L1MA or L1P repeats.
Error bars show ±2 s.e. of the mean.
Author response image 1.
Author response image 2.
Author response image 2.. Black: Profile of peaks.
Blue: profile of locations 15 to 10kb downstream. Red: profile of globally (whole genome) random locations.
Author response image 3.
Author response image 4.

Comment in

References

    1. Allen JW, Latt SA. In vivo BrdU-33258 hoechst analysis of DNA replication kinetics and sister chromatid exchange formation in mouse somatic and meiotic cells. Chromosoma. 1976;58:325–340. doi: 10.1007/BF00292841. - DOI - PubMed
    1. Altemose N, Noor N, Bitoun E, Tumian A, Imbeault M, Chapman JR, Aricescu AR, Myers SR. A map of human PRDM9 binding provides evidence for novel behaviors of PRDM9 and other zinc-finger proteins in meiosis. eLife. 2017;6:e28383. doi: 10.7554/eLife.28383. - DOI - PMC - PubMed
    1. Altschul SF, Madden TL, Schäffer AA, Zhang J, Zhang Z, Miller W, Lipman DJ. Gapped BLAST and PSI-BLAST: a new generation of protein database search programs. Nucleic Acids Research. 1997;25:3389–3402. doi: 10.1093/nar/25.17.3389. - DOI - PMC - PubMed
    1. Altschul SF, Wootton JC, Gertz EM, Agarwala R, Morgulis A, Schäffer AA, Yu YK. Protein database searches using compositionally adjusted substitution matrices. FEBS Journal. 2005;272:5101–5109. doi: 10.1111/j.1742-4658.2005.04945.x. - DOI - PMC - PubMed
    1. Ashley T, Walpita D, de Rooij DG. Localization of two mammalian cyclin dependent kinases during mammalian meiosis. Journal of Cell Science. 2001;114:685–693. - PubMed

Publication types