. 2009 Nov;19(11):2028-35.
doi: 10.1101/gr.095562.109. Epub 2009 Aug 17.

Allele-specific DNA methylation in mouse strains is mainly determined by cis-acting sequences

Affiliations

Allele-specific DNA methylation in mouse strains is mainly determined by cis-acting sequences

Elmar Schilling et al. Genome Res. 2009 Nov.

Abstract

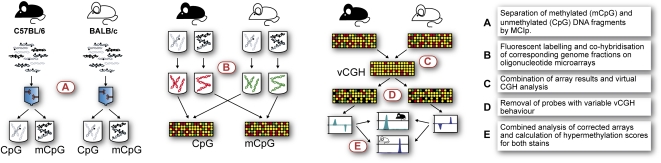
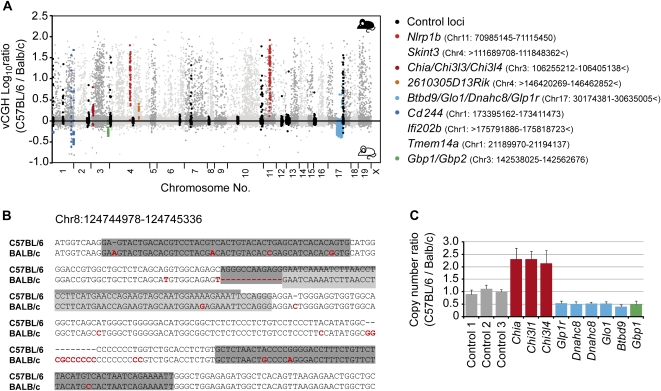
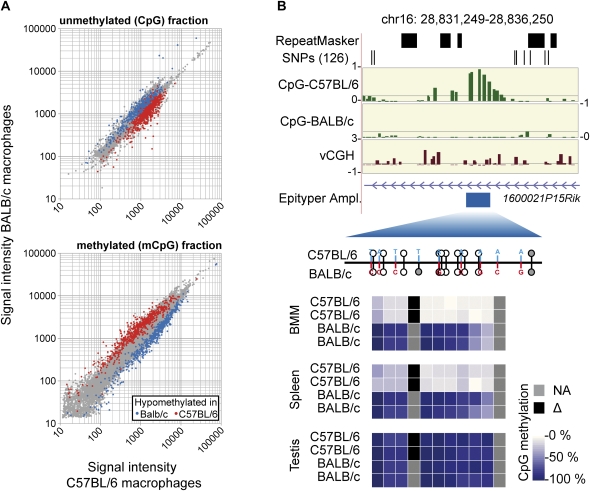
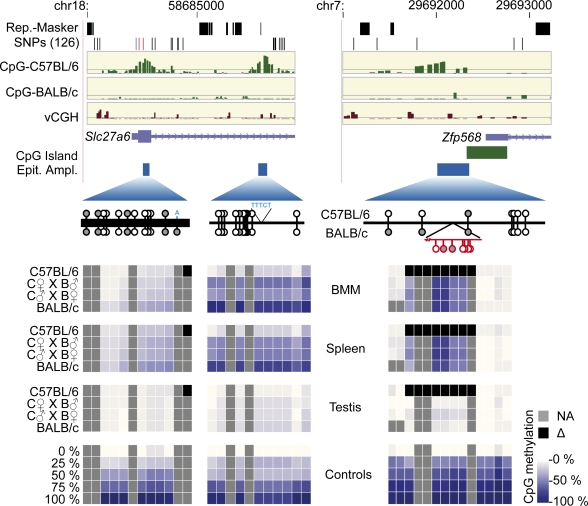
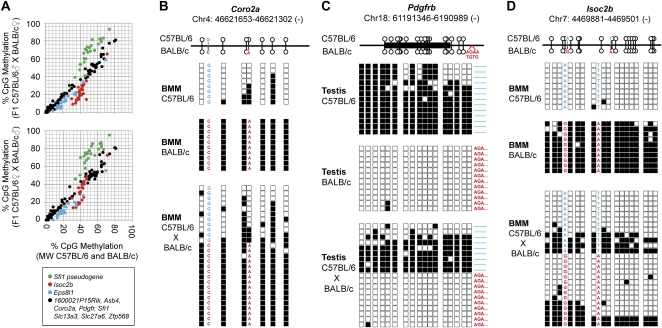
DNA methylation is a vital epigenetic mark that participates in establishing and maintaining chromatin structures and regulates gene transcription during mammalian development and cellular differentiation. Differences in epigenetic patterns between individuals may contribute to phenotypic variation and disease susceptibility; however, little is known about the extent of such variation or how different epigenetic patterns are established. Here we have compared DNA methylation profiles of macrophages from two inbred mouse strains (C57BL/6 and BALB/c) at 181 large genomic intervals that were selected based on differential gene expression patterns. Using a DNA methylation-dependent fractionation approach based on a combination of methyl-CpG immunoprecipitation and locus-wide tiling arrays, we identified several hundred differentially methylated regions, and simultaneously uncovered previously unrecognized genetic variability between both mouse strains at the studied loci. DNA sequence and methylation differences were validated by DNA sequencing and mass spectrometry analysis of bisulfite-treated DNA for a subset of regions. Importantly, we show that in F1 hybrids, the majority of strain-specific methylation patterns in somatic cells were maintained on the parental allele, regardless of their status in the male germ line. The common association of differentially methylated regions with sequence polymorphisms suggests that the genomic context determines the developmentally regulated epigenetic status at most nonimprinted regions of mammalian genomes.


Figures

Figure 1.
Figure 1.
Simultaneous detection of epigenetic and genetic differences using methyl-CpG immunoprecipitation (MCIp). The experimental workflow is presented schematically. (A) Fragmented genomic DNA from bone marrow-derived macrophages of either mouse strain was fractionated using a MBD-Fc column and separated into methylated (mCpG) and unmethylated (CpG) DNA pools. (B) Both DNA pools are fluorescently labeled and compared between mouse strains by cohybridization on a locus-specific microarray using stringent conditions. (C) Array results are combined in a virtual CGH analysis to detect CNVs and sequence polymorphic regions, that are removed (D) from further analysis. (E) Differentially methylated regions are detected by analyzing remaining array probes for diametrically opposed enrichment behavior between both hybridizations (e.g., a region that is relatively enriched in the unmethylated pool of BALB/c and shows reverse enrichment behavior in the methylated pool is considered hypomethylated in BALB/c).
Figure 2.
Figure 2.
Detection of genetic variation. (A) The histogram shows a CGH-like presentation of combined signal intensities from the separate hybridizations of methylated and unmethylated DNA pools. Control loci (in black) show relatively few C57BL/6-enriched signals. Two regions (Nlrp1b and Skint, in red) are deleted in BALB/c, two regions (Chia/Chi3l3/Chi3l4 and 2610305D13Rik; in dark red and orange, respectively) are duplicated in C57BL/6, and five regions (Btbd9/Glo1/Dnahc8/Glp1r, Cd244, Ifi202b, Tmem14a, and Gbp1/Gbp2; in blue or green) appear (at least) duplicated in BALB/c. Genomic locations are provided for individual regions. The signs > and < indicate that the affected regions extended over the analyzed area. Data represent mean values of two biological replicates. (B) Sequences of an exemplary region where several probes (boxed in gray) showed C57BL/6-enriched signals. Compared to the reference strain, BALB/c contains several nucleotide exchanges (highlighted in red). (C) QPCR validation of three CNVs (Chia/Chi3l3/Chi3l4, three amplicons; Btbd9/Glo1/Dnahc8/Glp1r, five amplicons; Gbp1/Gbp2, one amplicon) detected by vCGH.
Figure 3.
Figure 3.
Validation of strain-specific CpG methylation by MALDI-TOF MS of bisulfite treated DNA. (A) Scatter plots of normalized signal intensities from independent hybridizations of methylated (mCpG) and unmethylated (CpG) DNA pools. Probes in differentially methylated regions (colored in red and blue) show the expected intensity distribution (enriched in one pool and depleted in the other one). (B) One example of a DMR detected by the MCIp-microarray approach and validation using MALDI-TOF MS of bisulfite treated DNA (three additional examples are presented in Supplemental Fig. S4). MCIp results are presented in the upper panels. Shown are the following tracks (from top to bottom) that were generated using the UCSC Genome Browser (http://genome.ucsc.edu/): repetitive regions as identified by the RepeatMasker program, single nucleotide polymorphisms from the dbSNP (NCBI database for genomic variation) build 126 (both in black), hypomethylation scores for BMM of both mouse strains (defined as the difference product of log10 signal intensity ratios of both hybridizations; in green), vCGH signals indicating the presence of genetic variation at probe level (in brown), as well as gene structures (in purple) and the position of amplicons (Epityper Ampl., in blue) that were designed for MALDI-TOF MS analysis of bisulfite treated DNA. The relative position of CpGs within amplicons is indicated below by small lollipops (with the upward orientation representing C57BL/6, and the downward orientation representing BALB/c). Sequence variations are highlighted in red and blue, black bars mark the position of exons, and gray lollipops are not analyzed by the MS. Methylation levels of individual CpGs in the indicated cell types (two individuals for each strain) are shown color-coded. The scale ranges from pale yellow (0% methylation) to dark blue (100% methylation), strain-specifically absent CpGs are colored black, nondetectable CpGs are marked in gray.
Figure 4.
Figure 4.
Inheritance of stain-specific methylation patterns in F1 hybrids. Two examples (Slc27a6 and Zfp568) for allelic inheritance of stain-specific methylation patterns are shown. In the top panels, hypomethylation scores for BMM of both strains are displayed as described in Figure 3. Averaged methylation levels of individual CpGs were determined by MALDI-TOF analysis at the indicated DMR in BMM, spleen, and testis and are shown color-coded (as in Fig. 3) for parental strains and F1 hybrids. Data are mean values of two to four individual samples.
Figure 5.
Figure 5.
Strain-specific methylation patterns are mainly controlled in cis. (A) Averaged CpG methylation ratios of parental BMM (n = 3 for each strain) are plotted against averaged CpG methylation ratios of F1 hybrids derived from C57BL/6 (top, n = 5) or BALB/c (bottom, n = 3) sires. In eight out of 11 DMR analyzed by MALDI-TOF (marked in black), methylation patterns in F1 hybrids are almost identical to the average methylation level in parental strains (r2 > 0.97). Three DMR (Sfi1 pseudogene, Isoc2b, and Eps8l1, marked in red, green, and blue, respectively) either acquire (Sfi1 pseudogene) or lose methylation (Isoc2b, Eps8l1) in F1 hybrids relative to parental strains. (B–D) Allele-specific bisulfite sequencing of DMR in Coro2a (B, controlled in cis), Pdgfrb (C, controlled in cis), and Isoc2b (D, controlled in trans). The genomic position of CpGs within the amplicons is shown at the top. Sequence variations used to distinguish the different parental alleles are marked in blue for C57BL/6 and in red for BALB/c. Individual CpGs are represented by either white (unmethylated) or black (methylated) squares. Lines of squares represent independently sequenced clones derived from two independent sample preparations derived from reciprocal crosses. Three additional examples of DMR controlled in cis are given in Supplemental Figure S8.

References

    1. Ashe A, Morgan DK, Whitelaw NC, Bruxner TJ, Vickaryous NK, Cox LL, Butterfield NC, Wicking C, Blewitt ME, Wilkins SJ, et al. A genome-wide screen for modifiers of transgene variegation identifies genes with critical roles in development. Genome Biol. 2008;9:R182. doi: 10.1186/gb-2008-9-12-r182. - DOI - PMC - PubMed
    1. Bird A. DNA methylation patterns and epigenetic memory. Genes & Dev. 2002;16:6–21. - PubMed
    1. Blewitt ME, Vickaryous NK, Paldi A, Koseki H, Whitelaw E. Dynamic reprogramming of DNA methylation at an epigenetically sensitive allele in mice. PLoS Genet. 2006;2:e49. doi: 10.1371/journal.pgen.0020049. - DOI - PMC - PubMed
    1. Blewitt ME, Gendrel AV, Pang Z, Sparrow DB, Whitelaw N, Craig JM, Apedaile A, Hilton DJ, Dunwoodie SL, Brockdorff N, et al. SmcHD1, containing a structural-maintenance-of-chromosomes hinge domain, has a critical role in X inactivation. Nat Genet. 2008;40:663–669. - PubMed
    1. Chong S, Vickaryous N, Ashe A, Zamudio N, Youngson N, Hemley S, Stopka T, Skoultchi A, Matthews J, Scott HS, et al. Modifiers of epigenetic reprogramming show paternal effects in the mouse. Nat Genet. 2007;39:614–622. - PMC - PubMed

Publication types

MeSH terms

Associated data