

Interactions between lineage-associated transcription factors govern haematopoietic progenitor states
- PMID: 33103827
- PMCID: PMC7737608
- DOI: 10.15252/embj.2020104983
Interactions between lineage-associated transcription factors govern haematopoietic progenitor states
Abstract
Recent advances in molecular profiling provide descriptive datasets of complex differentiation landscapes including the haematopoietic system, but the molecular mechanisms defining progenitor states and lineage choice remain ill-defined. Here, we employed a cellular model of murine multipotent haematopoietic progenitors (Hoxb8-FL) to knock out 39 transcription factors (TFs) followed by RNA-Seq analysis, to functionally define a regulatory network of 16,992 regulator/target gene links. Focussed analysis of the subnetworks regulated by the B-lymphoid TF Ebf1 and T-lymphoid TF Gata3 revealed a surprising role in common activation of an early myeloid programme. Moreover, Gata3-mediated repression of Pax5 emerges as a mechanism to prevent precocious B-lymphoid differentiation, while Hox-mediated activation of Meis1 suppresses myeloid differentiation. To aid interpretation of large transcriptomics datasets, we also report a new method that visualises likely transitions that a progenitor will undergo following regulatory network perturbations. Taken together, this study reveals how molecular network wiring helps to establish a multipotent progenitor state, with experimental approaches and analysis tools applicable to dissecting a broad range of both normal and perturbed cellular differentiation landscapes.
Keywords: haematopoiesis; network; progenitors; scRNA-Seq; transcription factor.
© 2020 The Authors Published under the terms of the CC BY 4.0 license.
Conflict of interest statement
The authors declare that they have no conflict of interest.
Figures
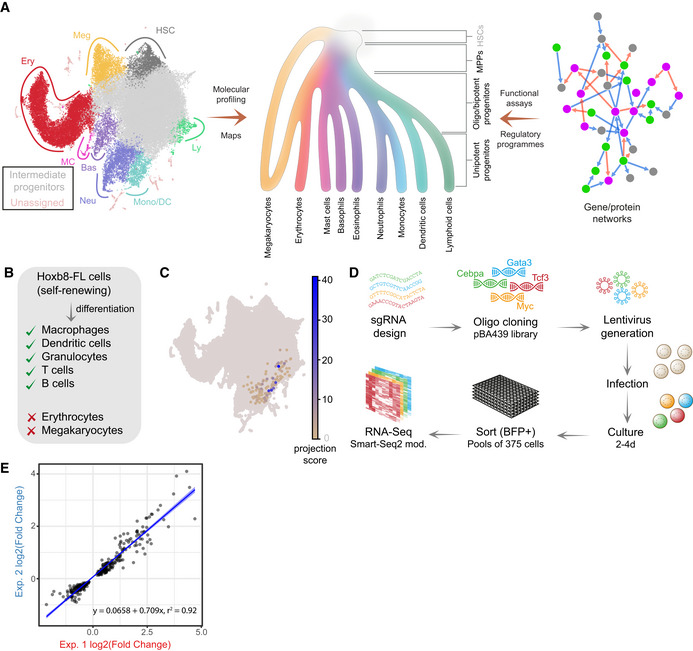
Understanding the cell state landscapes of haematopoietic progenitors. (left) Annotated UMAP projection of a scRNA‐Seq landscape—mouse LK + LSK populations (Dahlin et al, 2018) (middle) diagram representing haematopoietic hierarchy with gradual changes in cell fate potential (colour gradient) from HSCs to differentiated states (adapted from the Molecular Cell Biology, 9th edition under preparation). (right) Diagram of a molecular network.
Differentiation capacity of Hoxb8‐FL cells.
Projection of Hoxb8‐FL transcriptome onto the LK/LSK mouse landscape. The projection score (based on nearest neighbours) reflects relative transcriptional similarity to the Hoxb8‐FL state for each LK/LSK cell. For the majority of cells, no neighbours are identified (grey), some cells exhibit low similarity (yellow), and a small set of cells exhibit high similarity (blue).
Schematic of the screen layout, sgRNAs were cloned into the pBA439 backbone and introduced into Hoxb8‐FL cells via lentiviral infection. Cells were cultured for either 2 or 4 days, followed by sorting for cells carrying sgRNA constructs (BFP+) into small pools and subsequent small‐scale RNA‐Seq analysis.
Reproducibility of 2 independent experiments—correlation of observed changes in expression. Blue line indicates the linear fit with shaded areas as confidence intervals.
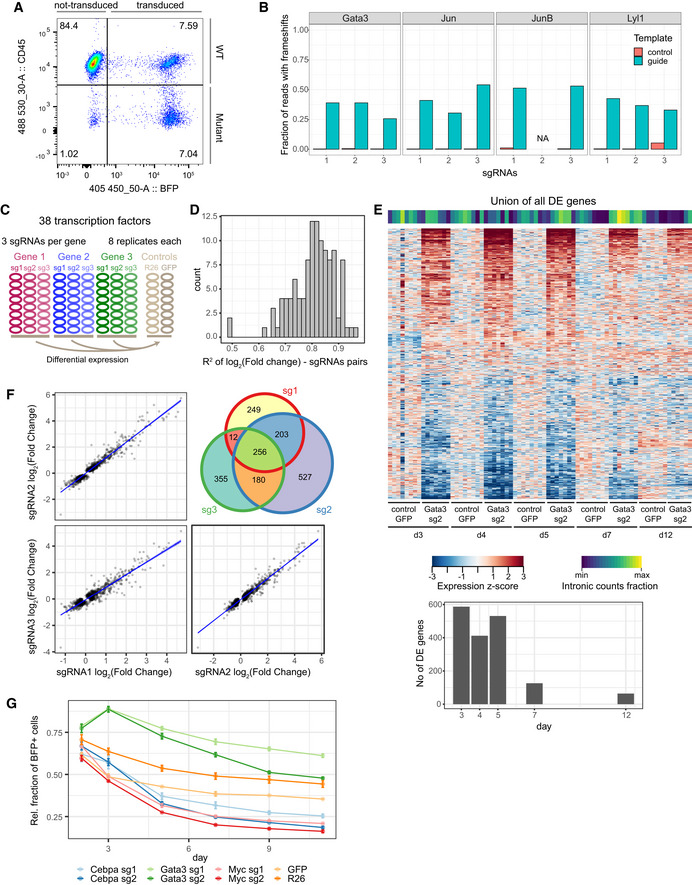
Flow cytometry analysis of Hoxb8‐FL cells transduced with sgRNA targeting CD45 (the Ptprc gene). Successfully transduced cells are BFP+, and mutant cells are BFP+, CD45−. Ptprc is successfully mutated in 48% of transduced cells, whereas almost all non‐transduced cells remain CD45+.
High‐throughput sequencing analysis of genomic DNA reads with frameshift mutations at predicted cutting sites following treatment of Hoxb8‐FL cells with 11 different sgRNAs.
Experimental design applied to screening of 38 transcription factors, each gene was targeted with 3 sgRNAs in 8 replicates. Two sets of controls were used: sgRNA targeting the Rosa26 locus and sgRNA targeting a GFP sequence (absent in the genome). Hoxb8 ectopic expression was disabled by β‐oestradiol withdrawal.
R2 values for observed changes in expression for each pair of sgRNAs targeting the same gene (using genes differentially expressed in 2 out of 3 comparisons).
A heatmap representing genes differentially expressed between the Gata3 sgRNA treated and control cells at all assayed time‐points. The signature observed in the first three time‐points disappears from 7 days onwards. Fraction of intronic reads is displayed above the heatmap. Barplot below shows the number of differentially expressed genes at each time‐point.
Related to (D), an example of correlation in gene expression changes across three sgRNAs targeting Gata3 sgRNA. Analysis performed using genes differentially expressed in at least 2 out of 3 comparisons. Blue line indicates the linear fit with shaded areas as confidence intervals.
Relative survival analysis of cells transduced with sgRNAs against Cebpa, Gata3 and Myc. Control cells treated with sgRNAs targeting GFP or Rosa26 loci indicate background fluorescent population changes, with only a small loss of the positive population. The fraction of BFP+ has been normalised to a parallel control performed in Hoxb8 cells not expressing the Cas9 protein. Error bars—standard error of the mean. R26—4 replicates, GFP—2 replicates, Cebpa, Gata3, Myc—3 replicates per condition.
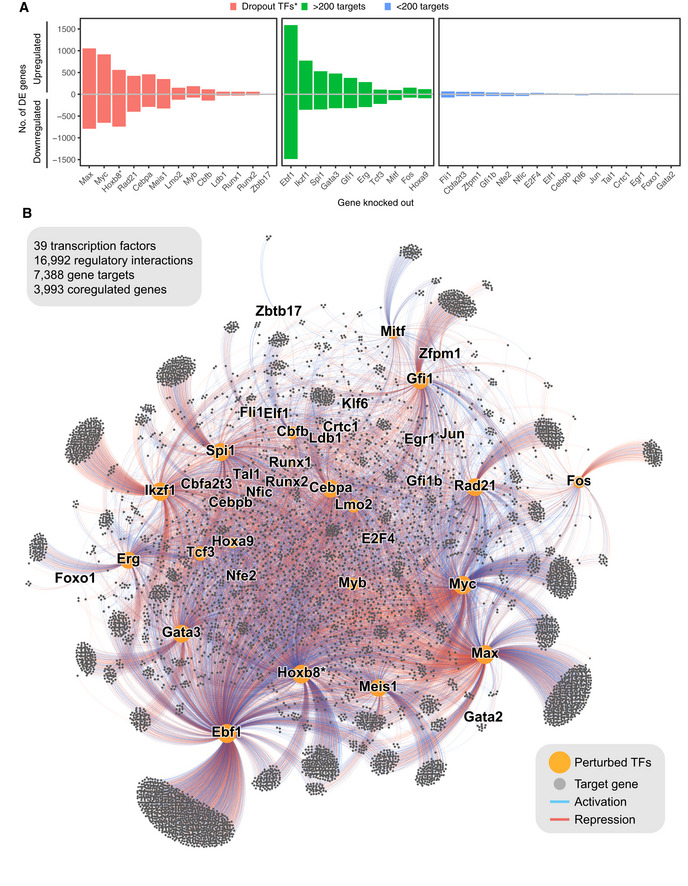
Number of target genes identified using differential expression for each assayed TF. *genes identified as essential for self‐renewal of Hoxb8‐FL cells in (Basilico et al, 2020).
A force‐directed graph displaying perturbed transcription factors (orange dots) and target genes (grey dots). Edges indicate if the target gene is differentially expressed, blue for genes downregulated and red for genes upregulated. Size of the nodes is proportional to their degrees.
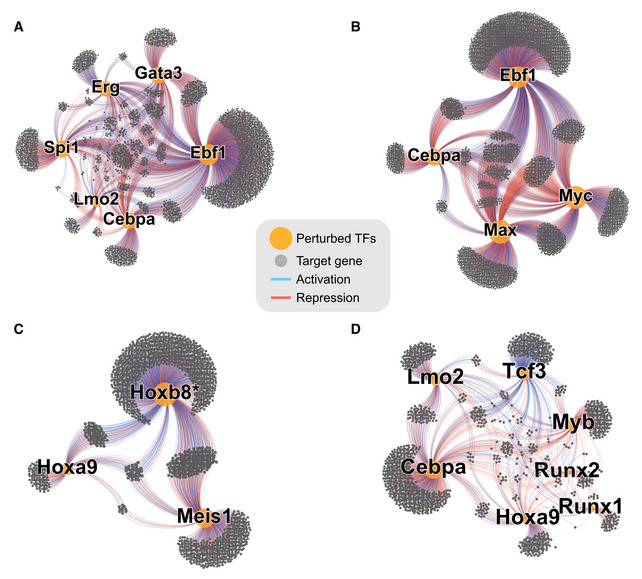
- A–D
Subgraphs isolated from Fig 2B. In each panel, the indicated TFs were isolated together with their downstream targets.
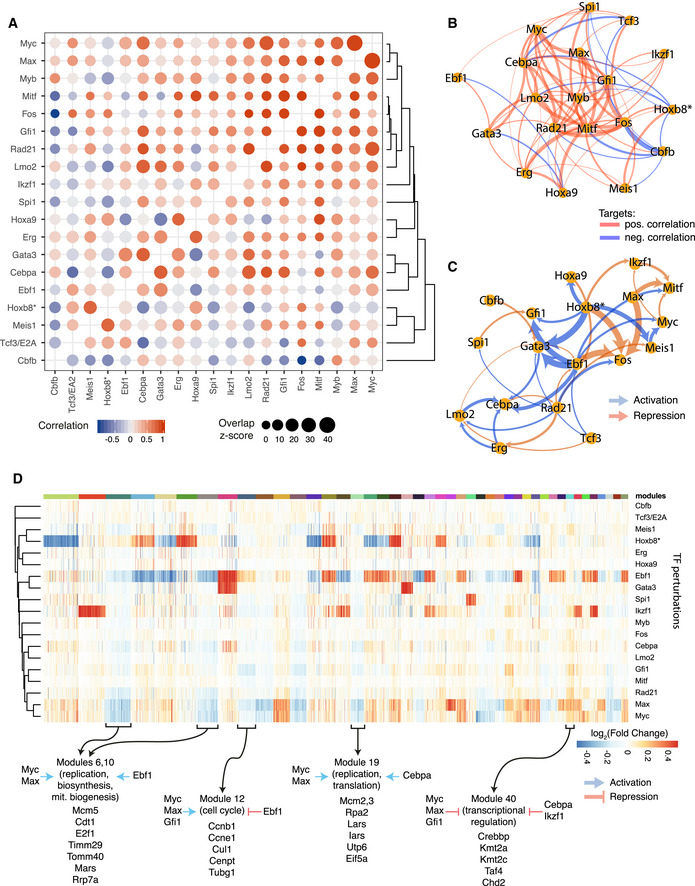
A representation of the pairwise degree of overlap in targets (size of the circle) and correlation in gene expression changes (colour) among overlapping targets for indicated TF perturbations. Red indicates positive correlations and blue negative correlations.
Network view of (A) showing relations among TFs based on their target correlation/anti-correlation. Edge width is proportional to the absolute value of the correlation. To increase readability, connections with |correlation| < 0.4 are not plotted; all correlation values are shown in A.
Network view of TF‐TF cross‐regulation. Directed edges indicate how transcription factors regulate each other's expression. Edge width is proportional to the magnitude of gene expression change (for clarity capped at a value corresponding to absolute log2(fold change) of 0.8).
Identification of target gene modules—groups of genes with common regulatory patterns by TFs. Colour indicates the fold change (adjusted for significance) of gene expression following each TF perturbation. Rows (perturbed TFs) and columns (target genes) are hierarchically clustered. Forty‐four modules for target genes are shown. Modules: 1, 2 and 3 are omitted for clarity, all modules are listed in Dataset EV3. Selected modules with highlighted overall regulation pattern and example genes listed below. Gene enrichment analysis for indicated modules is provided in Dataset EV5.
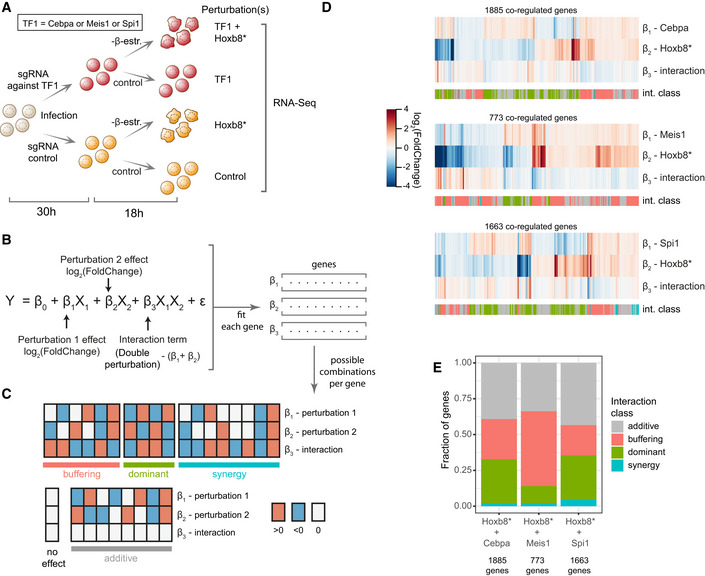
Experimental design: Hoxb8‐FL were transduced with sgRNAs targeting the indicated TF (or a control sgRNA) and subjected to β‐oestradiol withdrawal (switching off Hoxb8 ectopic expression—Hoxb8*) or cultured in normal conditions (control).
A two‐factor linear model with interaction used to fit the data. Observed expression (Y) is modelled as a sum of expression in control cells (β0), effect of perturbation 1 (binary factor X1 and coefficient β1), effect of perturbation 2 (X2 and β2), their interaction (X1X2 and β3) and the error term (σ). The interaction term can be interpreted as the difference between the expression changes in the double‐perturbed cells and the sum of coefficients of β1 and β2.
Binary combinations of directions in observed expression changes for perturbation 1, perturbation 2 and the interaction term grouped into four general classes. Based on classification implemented in Dixit et al (2016).
Changes in expression for genes coregulated by separate Cebpa/Meis1/Spi1 and Hoxb8 perturbations (FDR < 0.1 and |log2(fold change)| > 0.2). The interaction row indicates changes beyond simple additive effect (white = additive effect). Each gene was annotated with an interaction class (int. class) as explained in (C), using the |log2(fold change)| > 0.2) threshold to assign change direction.
Fractions of genes in each interaction class showed in (D).
- A, B
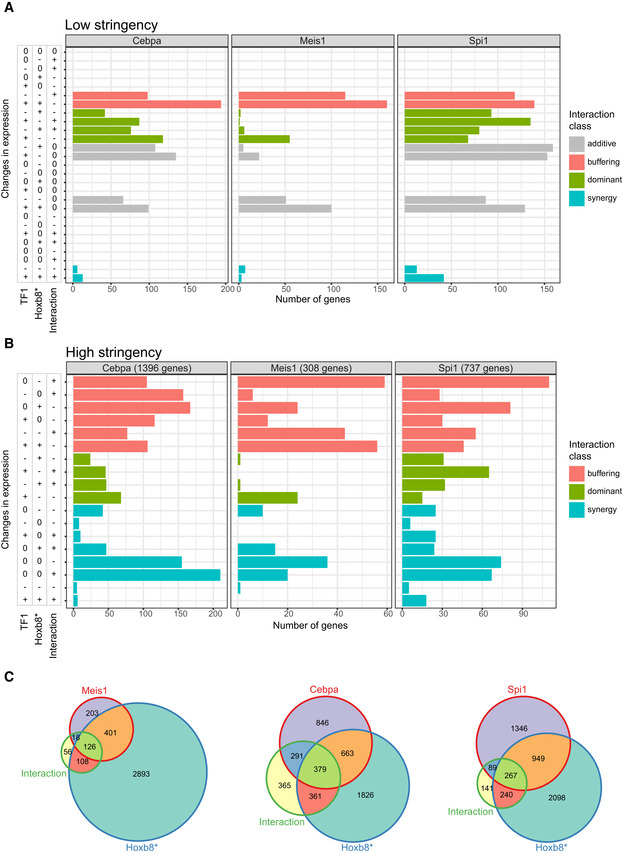
Number of genes per binary combination of expression change directions for TF1 perturbation (Cebpa, Meis1 or Spi1), Hoxb8* perturbation and their interaction. Classified as shown in Fig 4C. Low stringency (A)—only genes coregulated by separate Cebpa/Meis1/Spi1 and Hoxb8 perturbations (FDR < 0.1 and |log2(fold change)| > 0.2). Direction of expression changes was classified as |log2(fold change)| > 0.2. High stringency (B)—only genes with a significant interaction term (FDR < 0.1 and |log2(fold change)| > 0.2) and expression change directions classified as FDR < 0.1 and |log2(fold change)| > 0.2.
- C
Venn diagrams depicting number of genes with significant terms, as categorised in (B).
- A
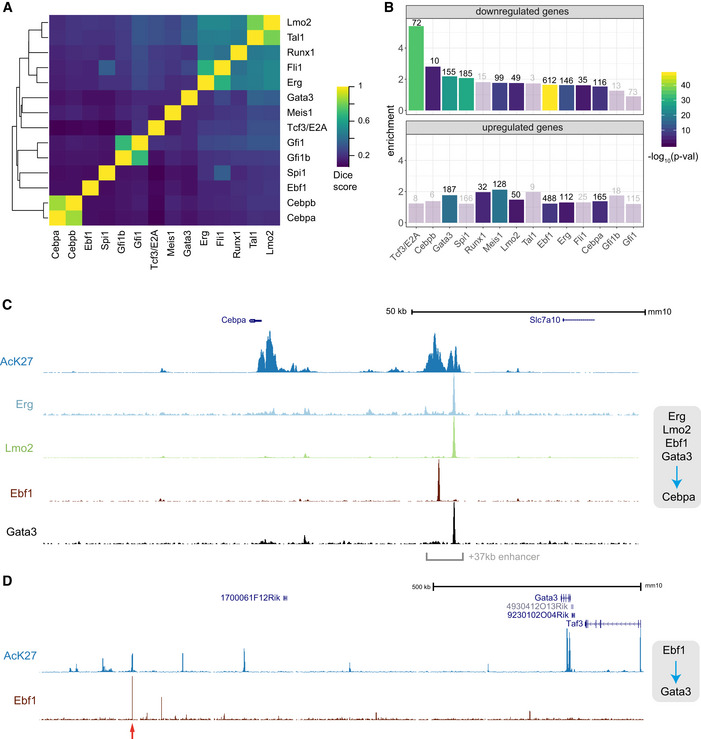
Dice scores summarising overlaps among peaks identified for 14 ChIP experiments in Hoxb8‐FL cells.
- B
Comparison of genes identified as differentially expressed following TF loss with mapped ChIP peaks in a corresponding experiment. Enrichment over a random value and the P‐value (based on the hypergeometric test) are shown (bars corresponding to non‐significant enrichment values are semi‐transparent). Analysis was performed separately for genes up‐ and downregulated.
- C, D
Genomic views of relevant TF binding to Cebpa and Gata3 loci (supporting direct regulatory interactions identified in Figs 3A–C). The red arrow indicates a putative enhancer element, which is bound by Ebf1 and flanked by AcK27‐rich regions.
- A, B
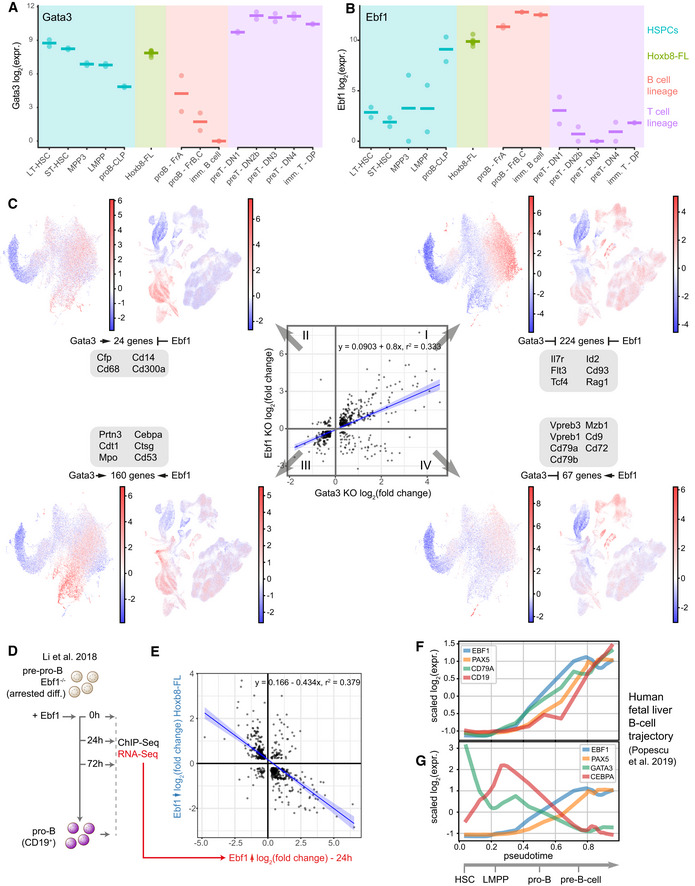
Bulk RNA‐Seq expression levels for Gata3 and Ebf1 in a set of isolated primary cells (data from Immgen (Heng & Painter, 2008)) compared to Hoxb8‐FL cells. Horizontal line indicates mean expression.
- C
Correlation in gene expression changes following Ebf1 and Gata3 loss in Hoxb8‐FL cells. Each quadrant corresponds to a set of target genes with a common regulation by Gata3/Ebf1-I—inhibition/inhibition, II—activation/inhibition, III—activation/activation, IV—inhibition/activation. For each group, the sums of scaled expression values in mouse LK/LSK or human BMMC landscapes is plotted to highlight cell types with the highest overall expression. For landscape annotation, see Fig 7B and C. Changes in expression for example genes are provided in Appendix Fig S2G–J. Blue line indicates the linear fit with shaded areas as confidence intervals.
- D
Schematic representation of the experiment performed by (Li et al, 2018). Ebf1 was re‐expressed in Ebf1 −/− pre‐pro-B cells thus resuming their differentiation.
- E
Correlation in expression changes after 24 h following Ebf1 loss in Hoxb8‐FL cells and re‐expression of Ebf1 in Ebf1 −/− pre‐pro-B cells (Li et al, 2018). Blue line indicates the linear fit with shaded areas as confidence intervals.
- F, G
Expression of the key marker genes (F) and Ebf1, Pax5, Gata3 and Cebpa factors (G) along pseudotime corresponding to the B‐cell differentiation trajectory in human foetal liver cells, data from Popescu et al (2019).
- A
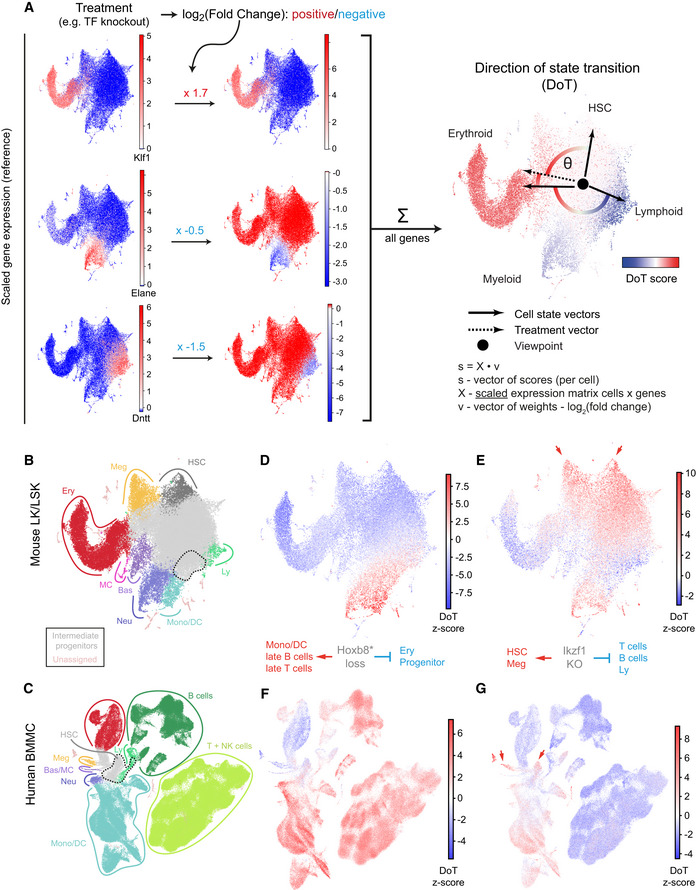
A toy example with visual explanation of the direction of state transition (DoT) calculation. Three lineage‐specific genes are used (full‐scale DoT analysis is unbiased and uses all available genes): erythroid Klf1, neutrophilic Elane and lymphoid Dntt; their scaled expression is plotted on the reference landscape (annotation in (B, C)). Upon treatment, changes in expression are observed for each gene. We calculate contributions from each gene as the product of its scaled expression and changes in expression (log2(fold change)). DoT score is the sum of these components and indicates direction of cell state transition with respect to the chosen viewpoint (point of origin).
- B, C
Annotated UMAP projections of scRNA‐Seq landscapes—mouse LK + LSK populations (Dahlin et al, 2018) and Human Cell Atlas bone marrow mononuclear cells (Regev et al, 2017). Dashed lines indicate cluster positions, which mean expression values were used to designate points of origin for the DoT score analysis.
- D, E
DoT scores calculated using genes differentially expressed after Hoxb8 or Ikzf1 loss in Hoxb8‐FL cells in the context of mouse LK/LSK landscape (Dahlin et al, 2018).
- F, G
DoT scores calculated using genes differentially expressed after Hoxb8 or Ikzf1 loss in Hoxb8‐FL cells in the context of the human BMMC landscape. Arrows indicate the HSCs and megakaryocytic trajectories.
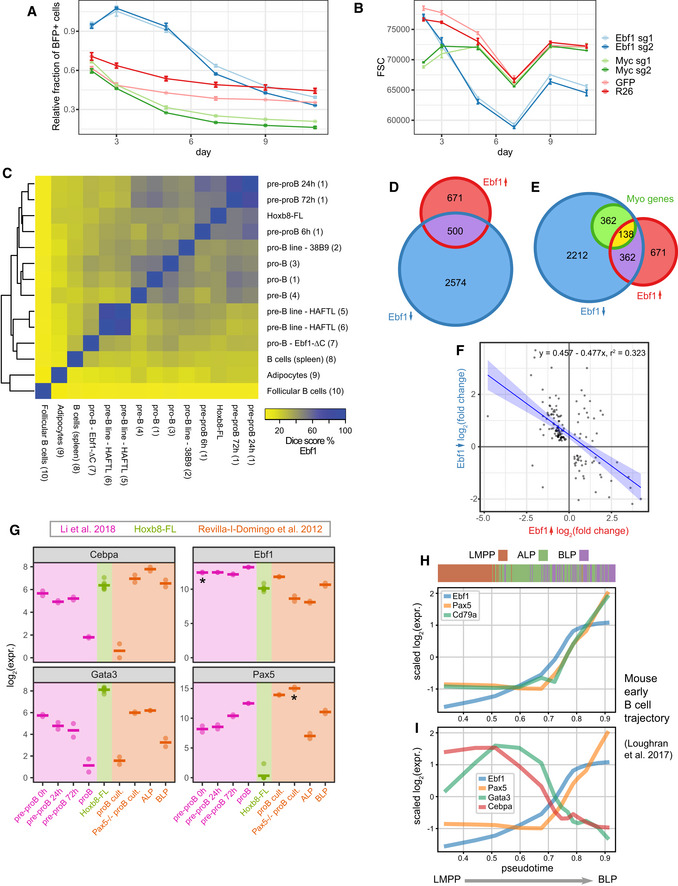
Relative survival analysis of cells transduced with sgRNAs against Ebf1 or Myc. Control cells treated with sgRNAs targeting GFP or Rosa26 loci indicate background fluorescent population changes, with only a small loss of the positive population. The fraction of BFP+ has been normalised to a parallel control performed in Hoxb8 cells not expressing the Cas9 protein. Error bars indicate standard error of the mean. R26—4 replicates, GFP—2 replicates, Myc and Ebf1—3 replicates per condition.
Cell size approximated by the FSC parameter for data in (A), error bars indicate standard error of the mean. R26—4 replicates, GFP—2 replicates, Myc and Ebf1 3 replicates per condition.
A heatmap showing relative similarity of Ebf1 binding sites across a range of other cell types, including B‐cell progenitor states. Please note a substantial similarity to the early EBf1 peaks identified in (Li et al, 2018).
Overlap of genes differentially expressed following Ebf1 loss in Hoxb8‐FL cells and genes changing expression within 24 h of re‐expression of Ebf1 in Ebf1−/− pre‐pro-B cells (Li et al, 2018).
Overlap of sets in (D) and top 500 genes contributing to the myeloid programme downstream of Ebf1 (DoT score after Ebf1 loss, see Fig EV5F) within the neutrophil progenitor cluster in the LK/LSK landscape (dark blue colour in Fig 7B).
Correlation in expression changes following Ebf1 loss in Hoxb8‐FL cells and re‐expression of Ebf1 (24 h) in Ebf1−/− pre‐pro-B cells but subset for 138 Myo genes from (E). Blue line indicates the linear fit with shaded areas as confidence intervals.
Comparison of Ebf1, Gata3, Pax5 and Cebpa expression levels among: Hoxb8‐FL cells, pre-pro‐B cells resuming differentiation (purple) (Li et al, 2018) and early lymphoid/B-cell progenitors from (Revilla‐i-Domingo et al, 2012) including Pax5‐deficient pro‐B cells. *Please note that Ebf1 and Pax5 RNA levels do not reflect functional gene products in the respective knockout setting. Horizontal line indicates average expression.
Expression of the key marker genes along pseudotime corresponding to early lymphoid/B‐cell differentiation trajectory in mouse bone marrow. Data from Loughran et al (2017). Colour bar indicates immunophenotypic identity for each cell analysed (ordered along pseudotime). LMPP—lymphoid‐primed multipotent progenitors, ALP—all‐lymphoid progenitor, BLP—B cell‐biased common lymphoid precursor.
Expression of Ebf1, Pax5, Gata3 and Cebpa along pseudotime corresponding to early lymphoid/B‐cell differentiation trajectory in mouse bone marrow. Data from Loughran et al (2017).
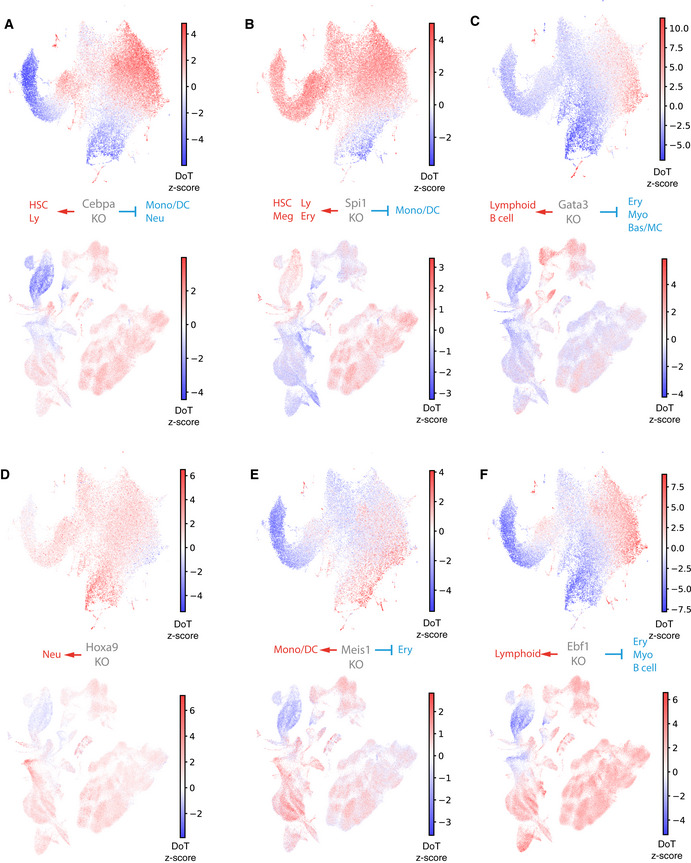
- A–F
DoT scores calculated using genes differentially expressed after loss of Cebpa, Spi1, Gata3, Ebf1, Hoxa9 and Meis1 in Hoxb8‐FL cells in the context of the mouse LK/LSK (top) or human BMMC (bottom) landscapes.
References
Publication types
MeSH terms
Substances
Associated data
- Actions
Grants and funding
LinkOut - more resources
Full Text Sources
Molecular Biology Databases
Research Materials
Miscellaneous
