

Stimulation of glycolysis promotes cardiomyocyte proliferation after injury in adult zebrafish
- PMID: 32648304
- PMCID: PMC7403660
- DOI: 10.15252/embr.201949752
Stimulation of glycolysis promotes cardiomyocyte proliferation after injury in adult zebrafish
Abstract
Cardiac metabolism plays a crucial role in producing sufficient energy to sustain cardiac function. However, the role of metabolism in different aspects of cardiomyocyte regeneration remains unclear. Working with the adult zebrafish heart regeneration model, we first find an increase in the levels of mRNAs encoding enzymes regulating glucose and pyruvate metabolism, including pyruvate kinase M1/2 (Pkm) and pyruvate dehydrogenase kinases (Pdks), especially in tissues bordering the damaged area. We further find that impaired glycolysis decreases the number of proliferating cardiomyocytes following injury. These observations are supported by analyses using loss-of-function models for the metabolic regulators Pkma2 and peroxisome proliferator-activated receptor gamma coactivator 1 alpha. Cardiomyocyte-specific loss- and gain-of-function manipulations of pyruvate metabolism using Pdk3 as well as a catalytic subunit of the pyruvate dehydrogenase complex (PDC) reveal its importance in cardiomyocyte dedifferentiation and proliferation after injury. Furthermore, we find that PDK activity can modulate cell cycle progression and protrusive activity in mammalian cardiomyocytes in culture. Our findings reveal new roles for cardiac metabolism and the PDK-PDC axis in cardiomyocyte behavior following cardiac injury.
Keywords: cardiac regeneration; cardiomyocyte proliferation; glycolysis; metabolism; zebrafish.
© 2020 The Authors. Published under the terms of the CC BY NC ND 4.0 license.
Conflict of interest statement
The authors declare no competing financial interests.
Figures

- A
30 and 150 days post fertilization (dpf) zebrafish ventricles were isolated and relative protein levels determined (n = 3 biological replicates).
- B
KEGG over‐representation analysis for selected categories of upregulated proteins in 150 dpf hearts compared to 30 dpf hearts. - C
qPCR analysis ofmRNA levels of glycolytic enzyme genes in 5 dpci remote and wound border cardiac tissue (n = 2–3 technical replicates using pooledcDNA from 10 ventricles for each condition (n = 2 for pkmb and pdk4, and n = 3 for the other genes)). - D, E
Immunostaining of heart sections for
PCNA andMEF 2 (D) or N2.261 andMEF 2 (E) in 5 dpci animals treated withPBS , 2‐DG , orDCA ; magnified view of area in white boxes shown below; white dashed lines outline the wound area; arrowheads point toPCNA + (D) or N2.261+ (E)CM s; percentage ofPCNA + or N2.261+CM s in the border zone shown on the right (n = 4–5 ventricles).

Lactate levels were measured in 5 dpci wound border cardiac tissue after treatment with PBS, 2‐DG, or DCA compared to uninjured (n = 3 biological replicates, each consisting of tissue from 10 ventricles).
Staining of heart sections for phospho histone‐3 (pHH3), MF20, and DNA (DAPI) in 5 dpci animals after treatment with PBS, 2‐DG, or DCA; magnified view of area in white boxes shown in the top right corner; arrowhead points to pHH3+ CMs; white dashed lines outline the wound area; percentage of pHH3+ CMs in the border zone shown on the right (n = 4–5 ventricles).

- A, B
Staining of heart sections for MF20, DNA (DAPI), and phalloidin (A) or MEF2, DNA (DAPI), and N2.261 (B) in uninjured WT, pkma2 −/−; pkmb +/−, and ppargc1a −/− animals; magnified view of area in white boxes shown on the right.
- C
Percentage of heart weight to body weight in adult WT, pkma2 −/−; pkmb +/−, and ppargc1a −/− animals (n = 7 animals of each genotype).
- D
Staining of heart sections for pHH3, MF20, and DNA (DAPI) in 5 dpci pkma2 +/−; pkmb +/− and pkma2 −/−; pkmb +/− animals; magnified view of area in white boxes shown in the top right corner; arrowheads point to pHH3+ CMs; white dashed lines outline the wound area; percentage of pHH3+ CMs in the border zone shown on the right (n = 4–5 ventricles of each genotype).
- E, F
Immunostaining of heart sections for PCNA and MEF2 (E) or N2.261 and MEF2 (F) in 5 dpci pkma2 +/− and pkma2 −/− animals; magnified view of area in white boxes shown in the top right corner; arrowheads point to PCNA+ (E) or N2.261+ (F) CMs; white dashed lines outline the wound area; percentage of PCNA+ or N2.261+ CMs in the border zone shown on the right (n = 3 ventricles of each genotype).
- G
Staining of heart sections for pHH3, MF20, and DNA (DAPI) in 5 dpci ppargc1a +/+, ppargc1a −/− animals; magnified view of area in white boxes shown in the top right corner; arrowheads point to pHH3+ CMs; white dashed lines outline the wound area; percentage of pHH3+ CMs in the border zone shown on the right (n = 4–5 ventricles of each genotype).
- H
qPCR analysis of ppargc1a, atp5pf, and ndufb5 mRNA levels in 5 dpci remote and wound border heart tissues (n = 3 technical replicates using pooled cDNA from 10 ventricles for each condition).
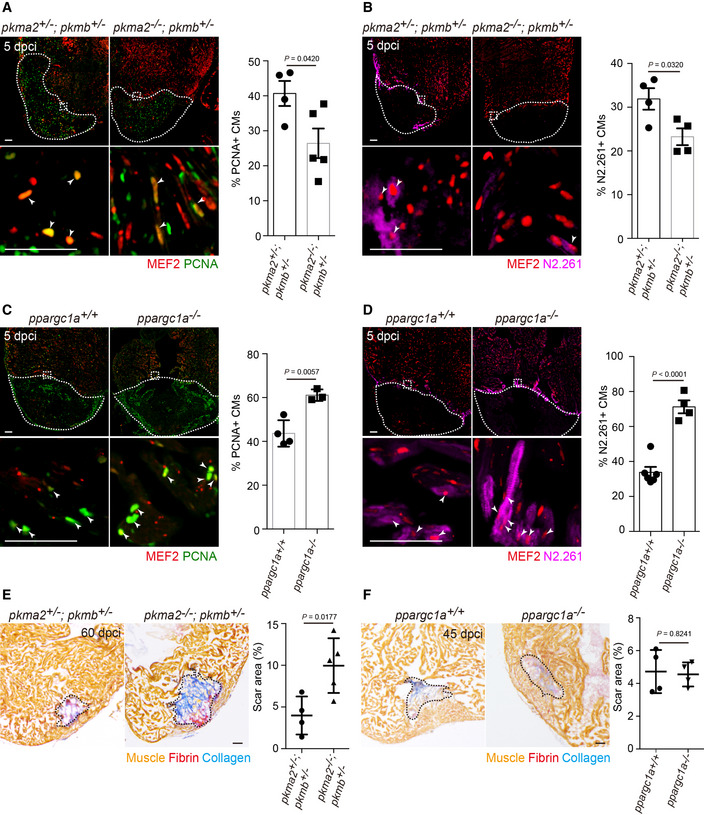
- A–D
Immunostaining of heart sections for
PCNA andMEF 2 (A, C) or N2.261 andMEF 2 (B, D) in 5 dpci pkma2 +/−; pkmb +/− and pkma2 −/−; pkmb +/− (A, B) or ppargc1a +/+ and ppargc1a −/− (C, D) animals; magnified view of area in white boxes shown below; arrowheads point toPCNA + (A, C) or N2.261+ (B, D)CM s; white dashed lines outline the wound area; percentage ofPCNA + (A, C) or N2.261+ (B, D)CM s in the border zone shown on the right (n = 4–6 ventricles of each genotype). - E, F
AFOG staining of heart sections from 60 dpci pkma2 +/−; pkmb +/− and pkma2 −/−; pkmb +/− (E) or 45 dpci ppargc1a +/+ and ppargc1a −/− (F) animals; black dashed lines outline the scar area; scar area measured on the right (n = 3–5 ventricles of each genotype).

- A, B
Staining of heart sections for MF20, mCherry, and DNA (DAPI) in Tg(myl7:Cre‐ERT2); Tg(hsp70l:LOXP‐STOP‐LOXP‐pdha1aSTA‐T2A‐mCherry) (A) and Tg(myl7:Cre‐ERT2); Tg(hsp70l:LOXP‐STOP‐LOXP‐pdk3b‐T2A‐mCherry) (B) animals with or without tamoxifen and heat‐shock treatments. TAM, tamoxifen; HS, heat shock.
- C, D
Staining of heart sections for pHH3, MF20, and DNA (DAPI) in 5 dpci animals (Tg(hsp70l:LOXP‐STOP‐LOXP‐pdha1aSTA‐T2A‐mCherry) (C) and Tg(hsp70l:LOXP‐STOP‐LOXP‐pdk3b‐T2A‐mCherry) (D) alone (control) or in combination with Tg(myl7:Cre‐ERT2), all after tamoxifen and heat‐shock treatments); magnified view of area in white boxes shown in the top right corner; arrowheads point to pHH3+ CMs; white dashed lines outline the wound area; percentage of pHH3+ CMs in the border zone shown on the right (n = 4–5 ventricles of each genotype).
- E
Staining of heart sections for PCNA, MEF2, and DNA (DAPI) in animals (Tg(hsp70l:LOXP‐STOP‐LOXP‐pdk3b‐T2A‐mCherry) alone (control) or in combination with Tg(myl7:Cre‐ERT2), all after tamoxifen and heat‐shock treatments).
- A
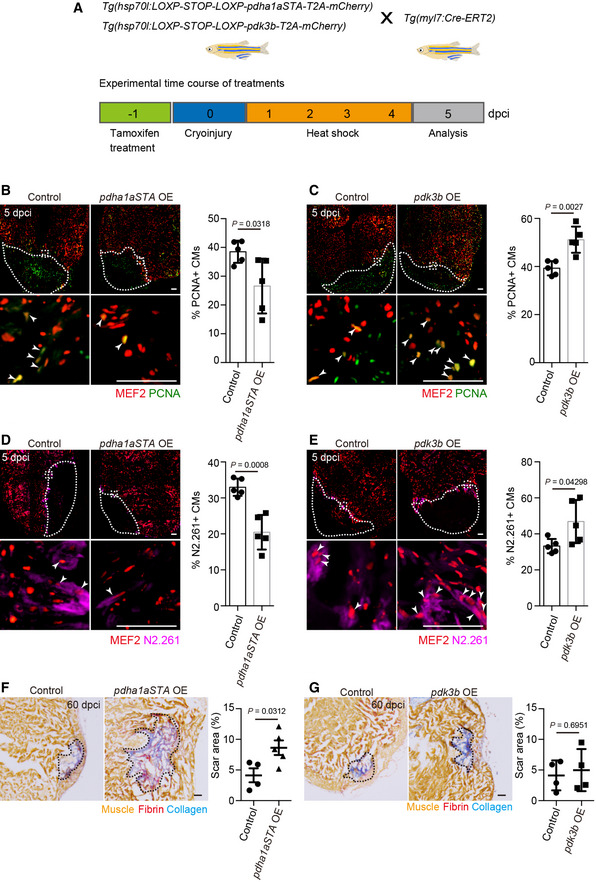
Transgenic animals and experimental time course for data shown in (B–E).
- B–E
Immunostaining of heart sections for
PCNA andMEF 2 (B, C) or N2.261 andMEF 2 (D, E) in 5 dpci animals (Tg(hsp70l:LOXP ‐STOP ‐LOXP ‐pdha1aSTA ‐T2A‐mC herry) and Tg(hsp70l:LOXP ‐STOP ‐LOXP ‐pdk3b‐T2A‐mC herry) alone (control) or in combination with Tg(myl7:Cre‐ERT 2), all after tamoxifen and heat‐shock treatments); magnified view of area in white boxes shown below; arrowheads point toPCNA + (B, C) or N2.261+ (D, E)CM s; white dashed lines outline the wound area; percentage ofPCNA + (B, C) or N2.261+ (D, E)CM s in the border zone shown on the right (n = 4–5 ventricles of each genotype). - F, G
AFOG staining of heart sections from 60 dpci animals (Tg(hsp70l:LOXP ‐STOP ‐LOXP ‐pdha1aSTA ‐T2A‐mC herry) (F) and Tg(hsp70l:LOXP ‐STOP ‐LOXP ‐pdk3b‐T2A‐mC herry) (G) alone (control) or in combination with Tg(myl7:Cre‐ERT 2), all after tamoxifen and heat‐shock treatments); black dashed lines outline the scar area; scar area measured on the right (n = 4–5 ventricles of each genotype).
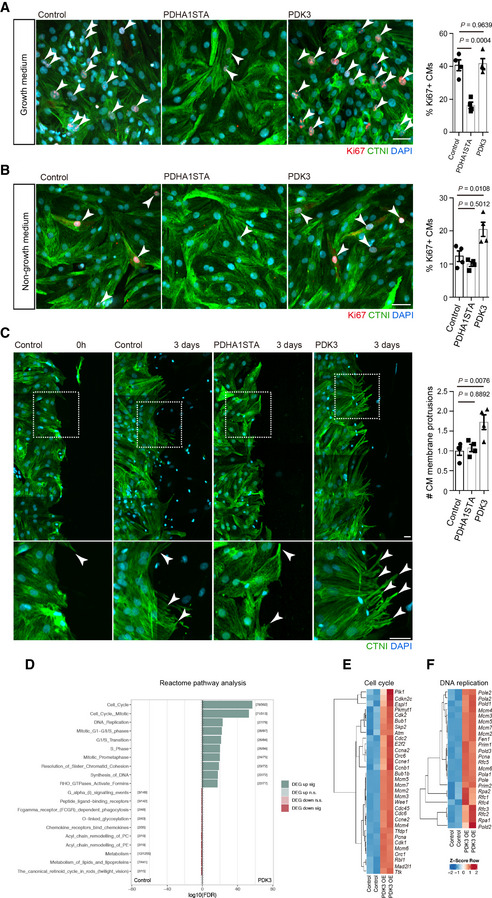
- A, B
Staining for Ki67,
CTNI , andDNA (DAPI ) in control,PDHA 1STA OE , orPDK 3OE RNCM s cultured in growth (A) or non‐growth (B) medium; arrowheads point to Ki67+RNCM s; percentage of Ki67+RNCM s shown on the right (n = 4 biological replicates for each condition). - C
Staining for
CTNI andDNA (DAPI ) in scratch assay using control,PDHA 1STA OE , orPDK 3OE RNCM s immediately or at 3 days after generating the scratch; magnified view of area in white boxes shown below; arrowheads point to membrane protrusions ofRNCM s; quantification ofCM membrane protrusions shown on the right (n = 4 biological replicates for each condition). - D
Reactome over‐representation analysis of differentially regulated genes in
PDK 3OE RNCM s compared to control. - E, F
Heat map of gene expression for key regulators of cell cycle (E) and
DNA replication (F) inPDK 3OE vs. controlRNCM s.

- A
Staining for Ki67, CTNI, and DNA (DAPI) in the scratch border and remote area; arrowheads point to Ki67+ RNCMs; and white dashed line marks the scratch border.
- B
Percentage of Ki67+ CMs in the 200 μm region adjacent to the scratch and in a remote area (n = 4 biological replicates for each condition).
- C
Staining for pHH3, CTNI, and DNA (DAPI) in control and PDK3 OE RNCMs; arrowhead points to pHH3+ RNCMs; percentage of pHH3+ RNCMs shown on the right (n = 4 biological replicates for each condition).
- D, E
Relative value of RNCM numbers (n = 3 biological replicates for each condition).
- F, G
Gene set over‐representation analysis with KOBAS 2.0 using KEGG and Gene Ontology databases based on differentially regulated genes in PDK3 OE RNCMs compared to control.
References
-
- Behal RH, Buxton DB, Robertson JG, Olson MS (1993) Regulation of the pyruvate dehydrogenase multienzyme complex. Annu Rev Nutr 13: 497–529 - PubMed
Publication types
MeSH terms
Substances
Associated data
- Actions
Grants and funding
LinkOut - more resources
Full Text Sources
Other Literature Sources
Molecular Biology Databases
Miscellaneous
