. 2024 Jan 8;15(1):270.
doi: 10.1038/s41467-023-44300-0.

Developmental basis of SHH medulloblastoma heterogeneity

Affiliations

Developmental basis of SHH medulloblastoma heterogeneity

Maxwell P Gold et al. Nat Commun. .

Abstract

Many genes that drive normal cellular development also contribute to oncogenesis. Medulloblastoma (MB) tumors likely arise from neuronal progenitors in the cerebellum, and we hypothesized that the heterogeneity observed in MBs with sonic hedgehog (SHH) activation could be due to differences in developmental pathways. To investigate this question, here we perform single-nucleus RNA sequencing on highly differentiated SHH MBs with extensively nodular histology and observed malignant cells resembling each stage of canonical granule neuron development. Through innovative computational approaches, we connect these results to published datasets and find that some established molecular subtypes of SHH MB appear arrested at different developmental stages. Additionally, using multiplexed proteomic imaging and MALDI imaging mass spectrometry, we identify distinct histological and metabolic profiles for highly differentiated tumors. Our approaches are applicable to understanding the interplay between heterogeneity and differentiation in other cancers and can provide important insights for the design of targeted therapies.


Conflict of interest statement

The authors declare no competing interests.

Figures

Fig. 1
Fig. 1. MBEN tumor cells mimic granule neuron development.
a Summary UMAP of Seven Tumors with MBEN Histology. Malignant and non-malignant cell types are labeled in the legend. b Marker Genes and Pseudotime for Malignant Cells. Tumor cells express markers for cycling GCPs (TOP2A + /GLI2 +), non-cycling progenitors (TOP2A-/GLI2 +), and differentiated neurons (NeuN +). Feature plots use blue to highlight all cells above 5th percentile of expression. Bottom right image shows pseudotime analysis rooted at cycling cells. Pseudotime increases from dark blue to white and then dark red. The black lines represent trajectories identified by monocle3. c Summary of Canonical Granule Neuron Development. Image adapted from Consales et al.. Granule cell precursors (GCPs) proliferate in the outer portion of the external granule layer (EGL), while non-cycling progenitors lie in the middle portion of the EGL. As the granule neurons (GN) differentiate, they express SEMA6A as they migrate tangentially across the inner portion of the EGL. The GN then turn and migrate radially across the molecular layer (ML), during which they express the glutamate receptor GRIN2B. Once the GN reach their final location in the internal granule layer (IGL), GRIN2C replaces GRIN2B. d MBEN Tumor Cells Resemble Stages of Granule Neuron Development. UMAP plot for malignant tumor cells along potential GCP to GN trajectory. There are tumor cells that express markers for each stage of GN development: cycling GCPs (TOP2A +), non-cycling GCPs (TOP2A-/GLI2 +), premigratory GN (SEMA6A +), migrating GN (GRIN2B +), and postmigratory GN (GRIN2C +). Feature plots use a minimum cutoff at the 90th percentile for each marker to highlight the cells with the highest expression.
Fig. 2
Fig. 2. Clustering of gene signature activation scores.
a Clustering of Gene Signature Scores Approach. The first step in this method is collecting the bulk or single-cell datasets of interest (Supplementary Fig. 4). For each dataset, clustering was used to identify relevant cell types or molecular subtypes. Then the top 100 marker genes were identified for each cluster to generate gene signatures. Those marker genes were used as gene sets for Gene Set Variation Analysis (GSVA), which was run on bulk transcriptomics data from 223 SHH tumors in the MAGIC cohort. This method converts the genes by samples matrix into a signatures by samples matrix by scoring each gene set signature for each of the 223 tumors. Consensus clustering was then run on those signature scores to identify which signatures are activated in the same SHH tumors. b Signature Score Consensus Clustering Summary. Consensus clustering results of 1000 trials using the signatures by samples output dataset. For each individual clustering, 50% of the SHH MBs were randomly chosen. Beige signifies signatures that never cluster together, and stronger red coloring indicates signatures that cluster together more often. The legend at the bottom indicates the dataset of origin, the species of the cells (human or mouse), the data type (scRNA-seq, snRNA-seq, or bulk), and material type (SHH MB tumor or healthy cerebellum). The groups of signatures on the right were manually annotated using the known cerebellar cell types from human and P14 mouse samples.
Fig. 3
Fig. 3. Genomic and transcriptomic associations between SHH MB and GN development.
a Mean Cell Type Activation Per Tumor Subtype. Each box shows the mean GSVA activation for a given consensus subtype and an MBEN cell type. Red indicates a higher GSVA score, while blue signals a lower one. b Associations Between Progenitor Score and Differentiated Cell Types. For both plots, each dot indicates a single sample from the MAGIC cohort and is colored by consensus subtype. The left figure shows the postmigratory GN score on the y axis and the progenitor score (cycling GCP + GCP) on the x axis. These two features have a significant negative correlation. The right plot uses the same x axis, but the y axis indicates the premigratory GN score and these two variables are not significantly correlated. c Boxplot of Association Between Chromosome 10q and Proliferation Score. Boxplots reflect GSVA scores for SHH MB tumors from MAGIC cohort. Y axis is the proliferation score (cycling GCP - GCP). The x axis is separated by consensus subtype and further divided by 10q status (loss in blue, WT or gain in orange). For all subtypes, samples with 10q loss show higher average proliferation score than the other tumors. The respective p values for two-sided Mann Whitney U tests from left to right are 0.027, 0.0005, 0.009, and 0.026. * and ** indicate two-sided Mann-Whitney p values less than 0.05 and 0.01 respectively. The boxplots from left to right show the following number of samples: 6, 29, 5, 42, 29, 36, 6, and 70. Each boxplot displays data quartiles, excluding outliers beyond 1.5 x IQR. d Boxplot of Association Between Chromosome 9q and Late-Stage GNs. Y axis is the late-stage GN score (migrating GN + postmigratory GN). The x axis is separated by consensus subtype and further divided by 9q status (loss in light blue, WT or gain in light orange). SHH-2 samples show a substantial difference in postmigratory GN signature based on 9q status. ** indicates two-sided Mann-Whitney p value < 0.01 (p = 6.5E-6). The boxplots from left to right show the following number of samples: 6, 29, 11, 36, 44, 21, 22, 54. Each boxplot displays data quartiles, excluding outliers beyond 1.5 x IQR.
Fig. 4
Fig. 4. SHHb proteomic subtype associated with late-stage GNs.
a Neuronal Protein Expression in SHH MB. Relative protein expression from Archer et al. data for markers of early differentiation (NEUROD1 and SEMA6A) and synapses (DLG4 and PCLO). DLG4 and PCLO are significantly different between SHHa and SHHb (two-sided t-test p values of 1.8E-6 and 1.1E-5). NEUROD1 and SEMA6A are not significantly different between subtypes. Each paired boxplot represents 10 SHHa tumors (red) and 5 SHHb tumors (purple) and shows data quartiles, excluding outliers beyond 1.5 x IQR. b SHHb Signature Scores for MBEN Nuclei. Activation scores for each MBEN nucleus using the top 100 SHHb marker proteins. Scores were filtered using a minimum cutoff of zero to highlight nuclei with the highest SHHb activation, which are the nuclei resembling migrating and postmigratory GN. c Tumor Cell Types per Sample. Five MBEN samples contain all types of cells. Two MBEN tumors do not contain late-stage GNs (migrating and postmigratory GN). d Rank Differences by Synapse and FMRP status. For each SHH tumor from Archer et al., RNA and protein data were rank normalized and a rank difference (protein rank - RNA rank) was calculated for each gene. For each gene in every SHHa tumor, the mean rank difference was calculated across samples and then the same procedure was applied to SHHb tumors. The genes were then divided into four categories: non-synaptic genes not targeted by FMRP (Non-SYN, 7392 genes), non-synaptic genes targeted by FMRP (Non-SYN FMRP, 454 genes), synaptic genes not targeted by FMRP (SYN, 628 genes) and synaptic genes targeted by FMRP (SYN FMRP, 200 genes). For SHHb tumors, SYN and SYN FMRP genes have high rank differences. For SHHa tumors, all categories show rank differences around zero. ** indicates that SYN FMRP genes have significantly different rank differences than the other gene groups. Two-sided Mann Whitney U test p values are 9.1E-7, 6.6E-13, and 8.7E-29 when comparing the SYN FMRP group to the SYN, NON-SYN FMRP, and Non-SYN groups respectively. Each boxplot shows data quartiles, excluding outliers beyond 1.5 x IQR.
Fig. 5
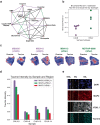
Fig. 5. SHH MB nodules recapitulate granule neuron development.
a Examples of VSNL1- and VSNL1+ Nodules. Staining for DAPI (blue), MAP2 (red), and VSNL1 (white). Each image shows a nodular region from an individual sample. The top row shows nodules with MAP2 + /VSNL1- cells resembling premigratory GN in tumors with SHHa proteomic subtype. The three tumors with the SHHb proteomic subtype are on the bottom row and contain differentiated regions that are MAP2 + /VSNL1+ mimicking the later stages of GN development. Scale bars indicate 100 μm. b Ki67 and VSNL1 Anticorrelate in CHLA-5. mIHC staining for tissue section from one sample (CHLA-5). Ki67 (yellow), MAP2 (red) and VSNL1 (white). Tissue section on bottom left is primarily composed of MAP2 + /VSNL1+ cells and has very few cycling cells. The larger tissue on the right contains many Ki67+ cells and MAP2 + /VSNL1- nodules. Scale bars indicate 1 mm. c Tumor Cells Mimic Cerebellar Structure in CHLA-10. mIHC staining for one tissue region from CHLA-10 tumor. Left image contains H&E stain from pseudo-cerebellar region in CHLA-10. Right image shows mIHC staining same region. Scale bars indicate 100 μm. d Zoomed in Region Highlights Cerebellar Layers. Left image is H&E stain from a healthy developing cerebellum. The right images contain the boxed section from Fig. 5c, which highlights one tumor region from sample CHLA-10. Outer layer resembles the EGL and contains Ki67+ cycling cells and MAP2 + /VSNL1- cells mimicking premigratory GN. The next layer is like the molecular layer (ML), which has few nuclei and CNTN1 + /VSNL1+ axons. The white interior region represents the internal granule layer (IGL) and is filled with VSNL1+ cells mimicking postmigratory GN. Scale bars indicate 100 μm.
Fig. 6
Fig. 6. Metabolic features of differentiation in SHH MBs.
a Select Edges from Joint Graphical Lasso Analysis. Purple edges appear in at least 50% of the networks from tumors with late-stage GNs, but not for the other samples. Green edges are in at least 50% of other tumor networks, but not samples with late-stage GNs. Black edges appear in networks from 50% of both groups. b Swarmplot of Bivariate Moran’s I Between Taurine and Guanine. Bivariate Moran’s I statistic was calculated between the guanine and the spatial lag of taurine for each section. Tumors with late-stage GNs (purple) have a strong negative relationship not consistently observed in the other samples (green). c Taurine and Guanine Anticorrelate in Tumors with Late-Stage GNs. For four sections, the relative expression values are plotted for guanine and taurine. Each plot shows the metabolite values, clipped at the 3rd and 97th percentiles. The tumors with late-stage GNs show clear spatial anticorrelation between guanine and taurine, which is not consistently observed in the other tumors. d Taurine Intensity by Region Type. For each of the four samples (CHLA-5, CHLA-9, CHLA-13, and CHLA-14), the imaged area was divided into three region types: MAP2 + /VSNL1 + , MAP2 + /VSNL1-, and MAP2-/VSNL1-. The height of each bar indicates the mean taurine fluorescence intensity for pixels in each region of that sample. In all four samples, the mean taurine intensity is highest in the MAP2 + /VSNL1+ regions, followed by MAP2 + /VSNL1- and then MAP2-/VSNL1-. Error bars indicate standard error. Data distributions can be found in Supplementary Fig. 24. e Vertical Layers of Pseudo-Cerebellar Structure from CHLA-10. mIHC from one tumor region from sample CHLA-10. Zoomed in region from orange box in Supplementary Fig. 25. Furthest left region resembles EGL with MAP2 + /VSNL1- cells. On the far right is a region similar the IGL that contains MAP2, VSNL1, and taurine. In between is a region divided in two, where the right section contains VSNL1+ axons and the left one stains for taurine. There appears to be a layer with high taurine levels between the pseudo-ML and pseudo-EGL. Scale bars represent 50 μm.
Fig. 7
Fig. 7. Summary of SHH MB associations with GCP development.
Image adapted from Consales et al.. Image of canonical GCP development with GCPs differentiating in the external granule layer (EGL), migrating through the molecular layer (ML) until they reach their final location in the internal granule layer (IGL). The right side shows medulloblastoma subtypes or IHC staining patterns and their associations with specific regions of the developing cerebellum.

References

    1. Kool M, et al. Molecular subgroups of medulloblastoma: An international meta-analysis of transcriptome, genetic aberrations, and clinical data of WNT, SHH, Group 3, and Group 4 medulloblastomas. Acta Neuropathol. 2012;123:473–484. doi: 10.1007/s00401-012-0958-8. - DOI - PMC - PubMed
    1. Gajjar A, et al. Outcomes by Clinical and Molecular Features in Children With Medulloblastoma Treated With Risk-Adapted Therapy: Results of an International Phase III Trial (SJMB03) J. Clin. Oncol. 2021;39:822–835. doi: 10.1200/JCO.20.01372. - DOI - PMC - PubMed
    1. Olivier TW, et al. Cognitive implications of ototoxicity in pediatric patients with embryonal brain tumors. J. Clin. Oncol. 2019;37:1566–1575. doi: 10.1200/JCO.18.01358. - DOI - PMC - PubMed
    1. Salloum R, et al. Late morbidity and mortality among medulloblastoma survivors diagnosed across three decades: A report from the Childhood Cancer Survivor Study. J. Clin. Oncol. 2019;37:731–740. doi: 10.1200/JCO.18.00969. - DOI - PMC - PubMed
    1. Cavalli F, et al. Intertumoral Heterogeneity within Medulloblastoma Subgroups. Cancer Cell. 2017;31:737–754. doi: 10.1016/j.ccell.2017.05.005. - DOI - PMC - PubMed

Publication types

Associated data