Comparative Study
. 2006 Apr 3:7:183.
doi: 10.1186/1471-2105-7-183.

Exploiting the full power of temporal gene expression profiling through a new statistical test: application to the analysis of muscular dystrophy data

Affiliations
Comparative Study

Exploiting the full power of temporal gene expression profiling through a new statistical test: application to the analysis of muscular dystrophy data

Veronica Vinciotti et al. BMC Bioinformatics. .

Abstract

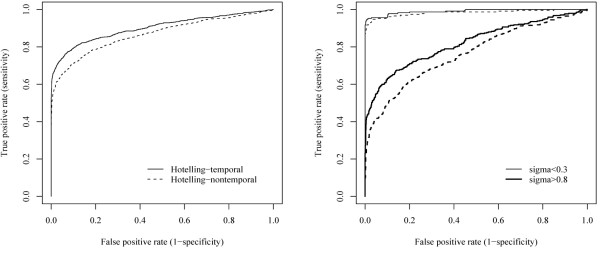
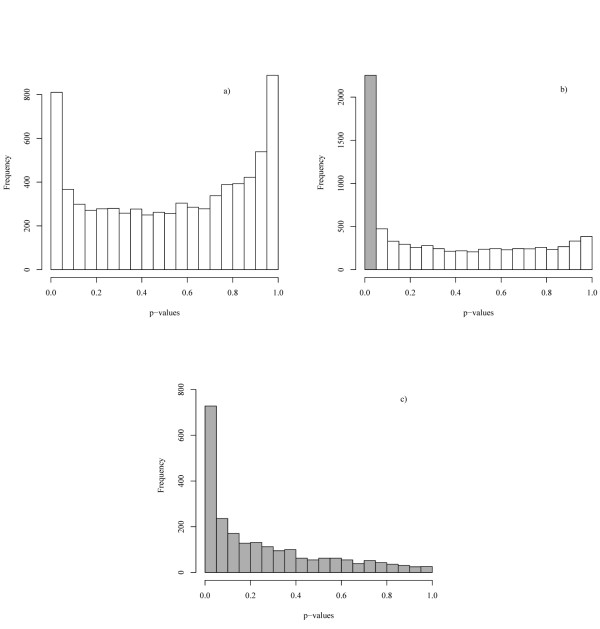
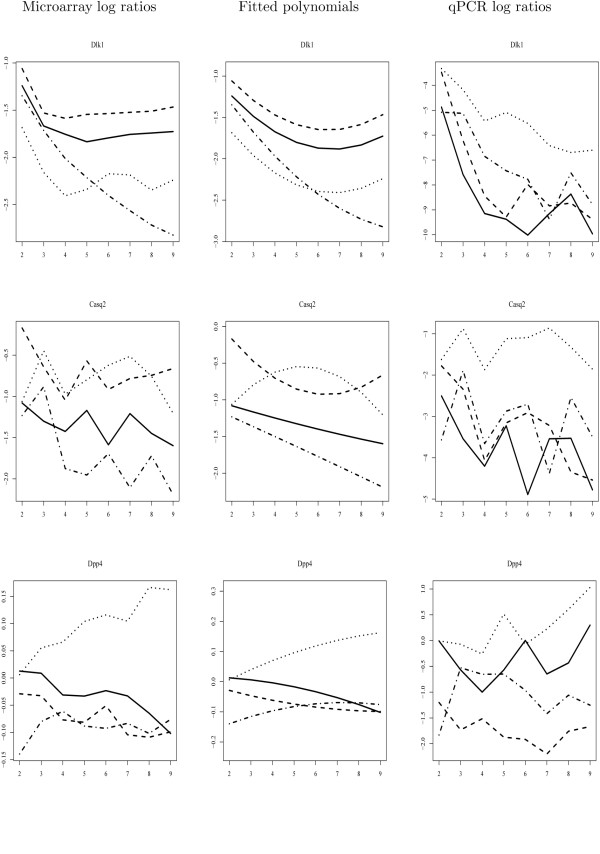
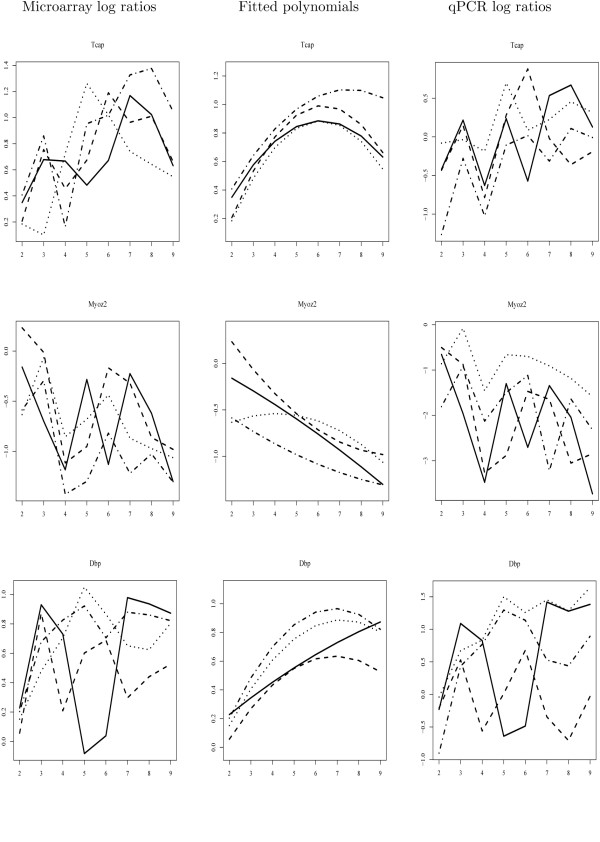
Background: The identification of biologically interesting genes in a temporal expression profiling dataset is challenging and complicated by high levels of experimental noise. Most statistical methods used in the literature do not fully exploit the temporal ordering in the dataset and are not suited to the case where temporal profiles are measured for a number of different biological conditions. We present a statistical test that makes explicit use of the temporal order in the data by fitting polynomial functions to the temporal profile of each gene and for each biological condition. A Hotelling T2-statistic is derived to detect the genes for which the parameters of these polynomials are significantly different from each other.

Results: We validate the temporal Hotelling T2-test on muscular gene expression data from four mouse strains which were profiled at different ages: dystrophin-, beta-sarcoglycan and gamma-sarcoglycan deficient mice, and wild-type mice. The first three are animal models for different muscular dystrophies. Extensive biological validation shows that the method is capable of finding genes with temporal profiles significantly different across the four strains, as well as identifying potential biomarkers for each form of the disease. The added value of the temporal test compared to an identical test which does not make use of temporal ordering is demonstrated via a simulation study, and through confirmation of the expression profiles from selected genes by quantitative PCR experiments. The proposed method maximises the detection of the biologically interesting genes, whilst minimising false detections.

Conclusion: The temporal Hotelling T2-test is capable of finding relatively small and robust sets of genes that display different temporal profiles between the conditions of interest. The test is simple, it can be used on gene expression data generated from any experimental design and for any number of conditions, and it allows fast interpretation of the temporal behaviour of genes. The R code is available from V.V. The microarray data have been submitted to GEO under series GSE1574 and GSE3523.


Figures

Figure 1
Figure 1
Simulation study. ROC curves comparing the temporal Hotelling (solid line) and the non-temporal Hotelling (dotted line) test. The temporal test outperforms the non-temporal one, especially at increasing levels of noise (bold line, right panel).
Figure 2
Figure 2
Distribution of P-values. P-value distribution: a) for temporal Hotelling test with polynomial of second degree, b) for non-temporal Hotelling test, c) for the temporal Hotelling test only for genes significant at the 5% confidence level according to the non-temporal test (shaded in grey).
Figure 3
Figure 3
Validation of the temporal Hotelling T2 -test with quantitative PCR experiments (1).The expression patterns of Dlk1 and Casq2 (significant in both temporal and non-temporal tests), and Dpp4 (significant in temporal but not in non-temporal test), as determined by microarray and qPCR assays, are plotted. The left panel shows the log-ratios with respect to time point 1 estimated from the microarray data; the middle panel shows the fitted second order polynomials; the right panel shows the log-ratios determined by quantitative PCR, as an independent confirmation method for the microarray data. X-axis represents time points. Solid lines represent WT mice; dashed lines MDX mice; dotted lines BSG mice; dashed line interrupted with dots GSG mice.
Figure 4
Figure 4
Validation of the temporal Hotelling T2-test with quantitative PCR experiments (2). The expression patterns of Tcap and Myoz2 (significant in non-temporal but not in temporal test), and Dbp (significant in non-temporal test and temporal test with higher order polynomials), as determined by microarray and qPCR assays, are plotted. The left panel shows the log-ratios with respect to time point 1 estimated from the microarray data; the middle panel shows the fitted second order polynomials; the right panel shows the log-ratios determined by quantitative PCR, as an independent confirmation method for the microarray data. X-axis represents time points. Solid lines represent WT mice; dashed lines MDX mice; dotted lines BSG mice; dashed line interrupted with dots GSG mice.

References

    1. Eisen M, Spellman P, Brown P, Botstein D. Cluster analysis and display of genome-wide expression patterns. Proc Natl Acad Sci USA. 1998;95:14863–14868. doi: 10.1073/pnas.95.25.14863. - DOI - PMC - PubMed
    1. Ramoni M, Sebastiani P, Kohane I. Cluster analysis of gene expression dynamics. Proc Natl Acad Sci USA. 2002;99:9121–9126. doi: 10.1073/pnas.132656399. - DOI - PMC - PubMed
    1. de Hoon M, Imoto S, Miyano S. Statistical analysis of a small set of time-ordered gene expression data using linear splines. Bioinformatics. 2002;18:1477–1485. doi: 10.1093/bioinformatics/18.11.1477. - DOI - PubMed
    1. Luan Y, Li H. Model-based methods for identifying periodically expressed genes based on time course microarray gene expression data. Bioinformatics. 2004;20:332–339. doi: 10.1093/bioinformatics/btg413. - DOI - PubMed
    1. Wichert S, Fokianos K, Strimmer K. Identifying periodically expressed transcripts in microarray time series data. Bioinformatics. 2004;20:5–20. doi: 10.1093/bioinformatics/btg364. - DOI - PubMed

Publication types

MeSH terms

Associated data