. 2022 May 16:11:e69571.
doi: 10.7554/eLife.69571.

Machine learning sequence prioritization for cell type-specific enhancer design

Affiliations

Machine learning sequence prioritization for cell type-specific enhancer design

Alyssa J Lawler et al. Elife. .

Abstract

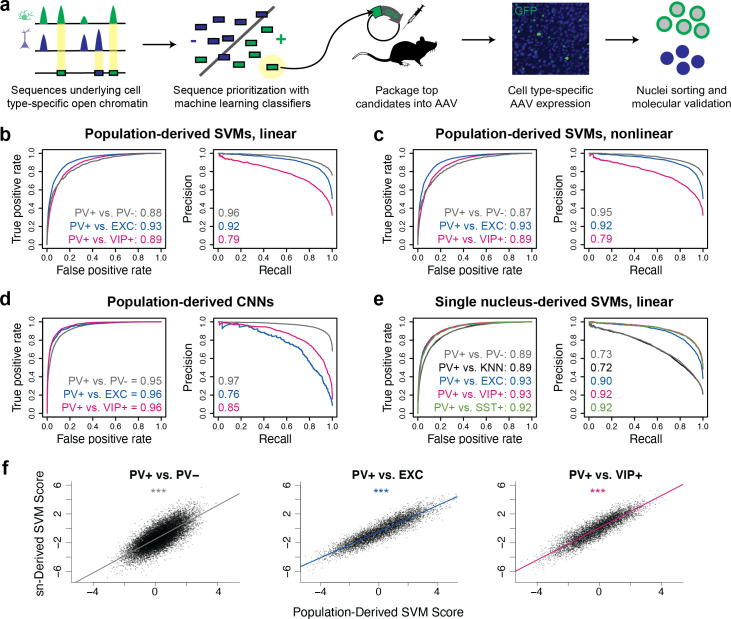
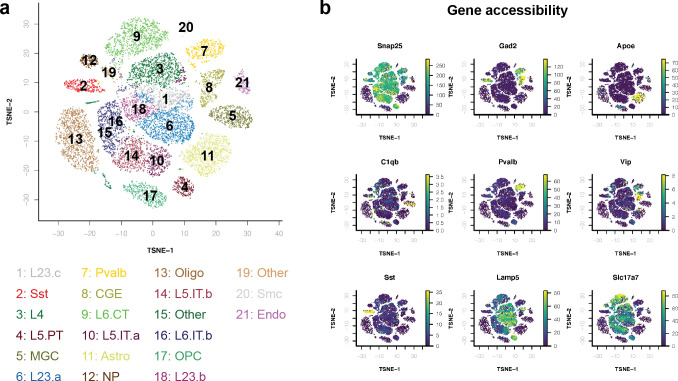
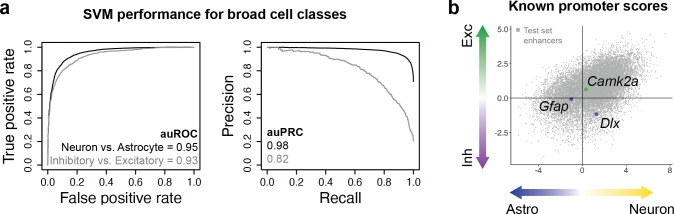
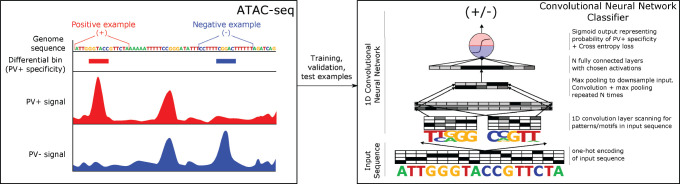
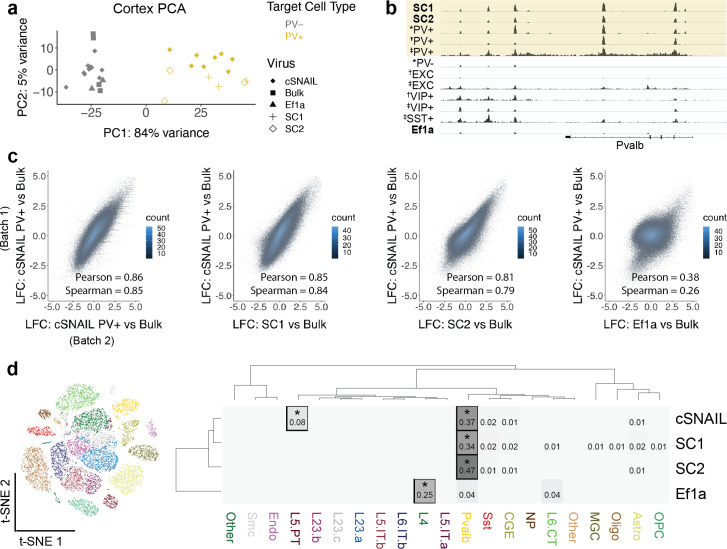
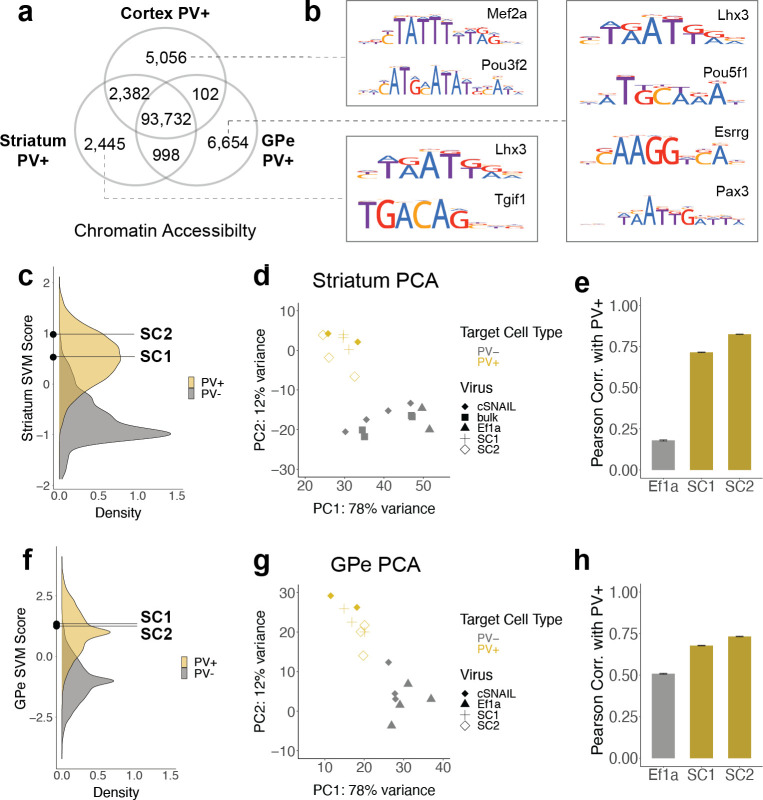
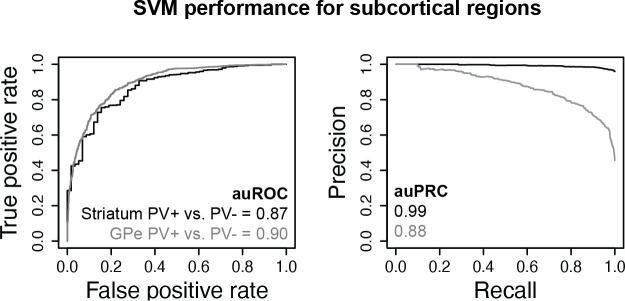
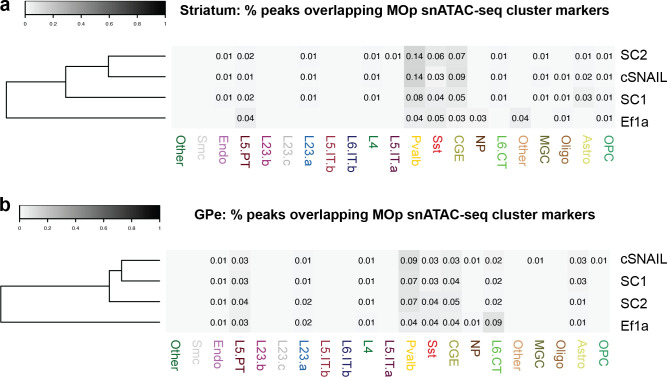
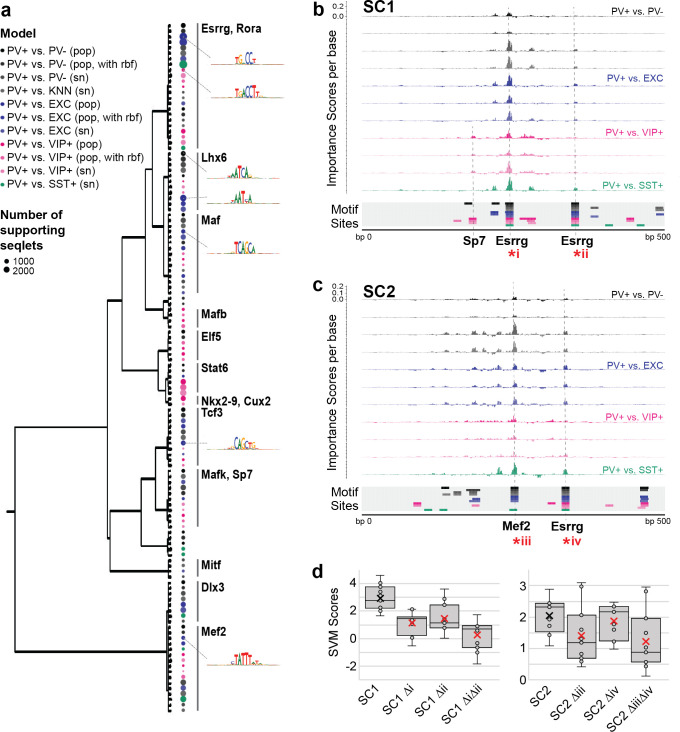
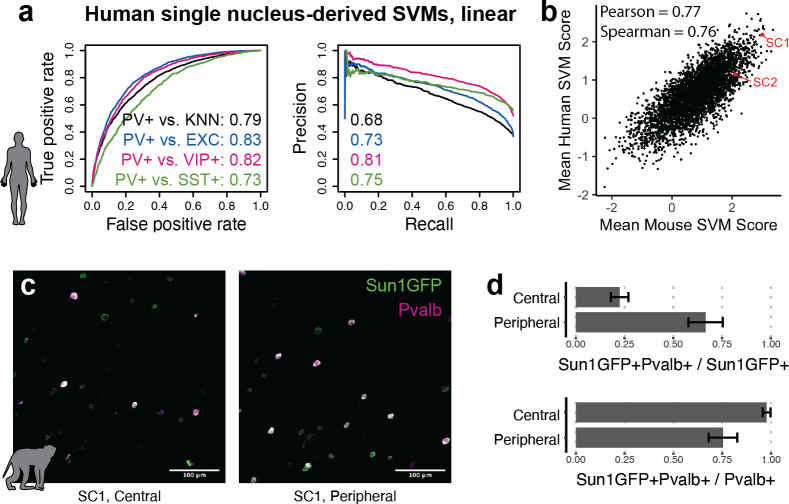
Recent discoveries of extreme cellular diversity in the brain warrant rapid development of technologies to access specific cell populations within heterogeneous tissue. Available approaches for engineering-targeted technologies for new neuron subtypes are low yield, involving intensive transgenic strain or virus screening. Here, we present Specific Nuclear-Anchored Independent Labeling (SNAIL), an improved virus-based strategy for cell labeling and nuclear isolation from heterogeneous tissue. SNAIL works by leveraging machine learning and other computational approaches to identify DNA sequence features that confer cell type-specific gene activation and then make a probe that drives an affinity purification-compatible reporter gene. As a proof of concept, we designed and validated two novel SNAIL probes that target parvalbumin-expressing (PV+) neurons. Nuclear isolation using SNAIL in wild-type mice is sufficient to capture characteristic open chromatin features of PV+ neurons in the cortex, striatum, and external globus pallidus. The SNAIL framework also has high utility for multispecies cell probe engineering; expression from a mouse PV+ SNAIL enhancer sequence was enriched in PV+ neurons of the macaque cortex. Expansion of this technology has broad applications in cell type-specific observation, manipulation, and therapeutics across species and disease models.

Keywords: cell type-specific enhancers; genetics; genomics; machine learning; mouse; neuron subtype isolation; neuroscience; parvalbumin neurons; rhesus macaque.


Conflict of interest statement

AL, ER, AP Inventor on US Patent Application 62/921,452, "Specific nuclear-anchored independent labeling system", AB, NS, YK, NT, IK, MW, XZ, BP, GF, KW, JH, BO, LB, WS, KF No competing interests declared

Figures

Figure 1.
Figure 1.. Classification of neuron subtype-specific enhancer activity from sequence.
(a) Schematic representation of the Specific Nuclear-Anchored Independent Labeling (SNAIL) workflow. (b–e) Receiver operator characteristic and precision-recall performance metrics for various cell type-specific enhancer sequence model strategies and data modalities. The reported numbers are the areas under the curves for each model. (f) Scatter plots for support vector machine (SVM) scores reported by equivalent population-derived models and single-nucleus-derived models. ***p-Value of Pearson correlation <0.001.
Figure 1—figure supplement 1.
Figure 1—figure supplement 1.. snATAC-seq cluster assignments.
(a) Cluster annotations in t-SNE space. (b) Gene body accessibility of population marker genes. Data reprocessed from Li et al., 2021.
Figure 1—figure supplement 2.
Figure 1—figure supplement 2.. Validation of modeling strategy using known promoters targeting broad cell classes.
(a) Performance metrics for support vector machines (SVMs) trained to distinguish differential open chromatin regions (OCRs) between neurons vs. astrocytes or inhibitory neurons vs. excitatory neurons. (b) Model scores for Gfap, Camk2a, and Dlx cell type-specific promoter sequences.
Figure 1—figure supplement 3.
Figure 1—figure supplement 3.. Convolutional neural network (CNN) strategy overview.
Figure 1—figure supplement 4.
Figure 1—figure supplement 4.. Pearson correlations of enhancer scores between support vector machines (SVMs).
The color and size of circles are proportional to the correlation coefficients, which are also listed in the lower triangle. Scores were evaluated on 33 enhancer sequences from Vormstein-Schneider et al., 2020.
Figure 1—figure supplement 5.
Figure 1—figure supplement 5.. Comparison to alternative enhancer prioritization strategies.
(a) Previously reported experimental parvalbumin-expressing (PV+) neuron specificity of enhancer adeno-associated viruses (AAVs) E1–E34 grouped into low-specificity (gray, < 70%) or high-specificity (gold, > 70%) sets. (b) Distributions of phyloP conservation scores across EuarchontoGlires for nucleotides within enhancer regions. The median score per enhancer is shown by the red point. The bottom of the panel shows presence (+) or absence (-) of an overlapping human open chromatin region (OCR) from human Snare-seq data (Bakken et al., 2020). (c, d) Log2(FoldDifference) or mean support vector machine (SVM) scores of enhancers in the high-specificity and low-specificity groups. Panel (c) contains data from all enhancers in each set, while panel (d) shows the subset of enhancers with log 2 fold difference > 1. The p-values are from one-sided t-tests. The black arrow points to two outlier examples of false-positive probe candidates.
Figure 1—figure supplement 6.
Figure 1—figure supplement 6.. Interpretation of top external parvalbumin-expressing (PV+) adeno-associated virus (AAV) enhancer sequences.
Normalized importance scores per base of PV+ enhancer candidates E29 and E22 across linear, population-derived support vector machines (SVMs). The locations of TF-MoDISco motif sites are shown at the bottom of each panel.
Figure 2.
Figure 2.. Two sequence candidates selectively activate adeno-associated virus (AAV) expression in parvalbumin-expressing (PV+) neurons.
(a) Genome browser visualization of PV+-specific ATAC-seq signal at sequence candidates SC1 and SC2. * cSNAIL data, † INTACT data from Mo et al., 2015, ‡ snATAC-seq from Li et al., 2021. (b) Percentile rank of support vector machine (SVM) scores among 1755 true PV+-specific enhancer sequence candidates that scored positively across all models. Linear population-derived models are denoted with ‘pop,’ nonlinear population-derived models are denoted with ‘pop, rbf,’ and linear single-nucleus-derived models are denoted with ‘sn.’ (c) Example images of AAV Sun1GFP expression against parvalbumin (Pvalb) antibody staining. (d, e) Quantification of AAV Sun1GFP or Pvalb-2A-Cre/Ai14 reporter overlap with Pvalb+ cells. Bar heights represent the mean among images, and the error of the mean is shown. N cells = 1322 (SC1), 2570 (SC2), 1340 (Ai14), 2013 (Ef1a), and 504 (N.C.). N.C., negative control.
Figure 3.
Figure 3.. Cortical SC1 and SC2 Specific Nuclear-Anchored Independent Labeling (SNAIL)-isolated nuclei recapitulate parvalbumin-expressing (PV+) GABAergic interneuron ATAC-seq signatures.
(a) Principal component analysis (PCA) of ATAC-seq counts across samples. (b) Genome browser visualization of ATAC-seq signal at the Pvalb gene locus. Tracks represent the pooled sample p-value signal. Each track of similar data type is normalized to the same scale: SNAIL data range 0–335, *cSNAIL data range 0–93, †INTACT data range 0–200, ‡snATAC-seq data range 0–2. (c) Scatter plots of ATAC-seq log2 fold difference relative to bulk tissue ATAC-seq, comparing PV+ cSNAIL to other adeno-associated viruses (AAVs). The density of overlapping points is shown by the plot color. (d) snATAC-seq nuclei clusters as visualized by t-SNE. The dendrograms show hierarchical clustering of Euclidean sample distances by Ward’s minimum variance method D2. The heatmap shows the percentage of population open chromatin regions (OCRs) enriched relative to bulk that are also cluster-specific marker OCRs. *Hypergeometric enrichment p<0.01.
Figure 4.
Figure 4.. SC1 and SC2 generalize to parvalbumin-expressing (PV+) neurons in the striatum and external globus pallidus (GPe).
(a) Numbers of differential open chromatin regions (OCRs) between PV+ neuron populations in three brain regions (DESeq2 padj<0.01 and |log2FoldDifference| > 1). Brain region-specific OCRs are those that were significantly enriched in that tissue relative to each of the other two tissues. OCRs shared between two brain regions on the Venn diagram are those that were significantly enriched in each of those tissues relative to the excluded tissue. The shared center of the Venn diagram shows all remaining OCRs that have ambiguous or no tissue preference. (b) Examples of enriched motifs in brain region-specific PV+ open chromatin relative to all PV+ open chromatin. (c, f) Distributions of validation data support vector machine (SVM) scores and SC1 and SC2 scores within striatum and GPe PV+ vs. PV- models. (d, g) Principal component analysis (PCA) visualization of ATAC-seq counts in each sample. (e, h) Pearson correlation coefficients when comparing the log2 fold difference of cSNAIL PV+ ATAC-seq relative to bulk tissue ATAC-seq and the log2 fold difference of SNAIL ATAC-seq relative to bulk tissue ATAC-seq. Error bars show the 95% confidence intervals.
Figure 4—figure supplement 1.
Figure 4—figure supplement 1.. Subcortical parvalbumin (PV)+ vs. PV- support vector machines (SVMs).
Receiver operator curve (ROC) and precision-recall curve (PRC) performance metrics on held-out test sequences are shown.
Figure 4—figure supplement 2.
Figure 4—figure supplement 2.. Comparison of subcortical SC1 and SC2-labeled populations with cortical snATAC-seq cluster markers.
Figure 5.
Figure 5.. Motif interpretation of parvalbumin-expressing (PV+) neuron-specific open chromatin region (OCR) activity.
(a) Motifs with high contributions to PV+ scores in each support vector machine (SVM), clustered by sequence similarity. The bubble color at each node shows the model that motif was discovered in and the size of the bubble shows the number of seqlets supporting that motif. Clusters are labeled by the clade majority best match for known transcription factor binding motifs. The full list of matches can be found in Figure 5—source data 1. (b, c) Normalized importance of each base in SC1 (b) and SC2 (c) sequences for their PV+-specific scores in each SVM. Locations with sequence matches for identified motifs in each SVM (from panel a) are shown at the bottom. (d) Predicted impacts of motif scrambling on PV+ specificity. Motif mutation sites are shown with asterisks in panels (a) and (b). Each point is the sequence score from one SVM and ‘x’ is the mean.
Figure 6.
Figure 6.. Extensions of Specific Nuclear-Anchored Independent Labeling (SNAIL) technologies in primates.
(a) Receiver operator characteristic and precision-recall performance metrics for parvalbumin-expressing (PV+) support vector machines (SVMs) derived from single-nucleus chromatin accessibility assays of human cortical tissue. The reported numbers are the areas under the curve for each model. (b) Comparison of mouse PV+ open chromatin sequences scored by mouse and human SVMs. Axes are the mean SVM scores among the 11 mouse SVMs or 4 human SVMs. (c) Images of SC1 AAV activation in the rhesus macaque cortex. (d) Quantification of SC1 and Pvalb antibody staining in the macaque cortex. Image sets near the center or peripheral of the injection site were quantified separately.

References

    1. Al-Rfou R, Alain G, Almahairi A, Angermueller C, Bahdanau D, Ballas N, The Theano Development Team Theano: A Python Framework for Fast Computation of Mathematical Expressions. arXiv. 2016 https://arxiv.org/abs/1605.02688
    1. Amemiya HM, Kundaje A, Boyle AP. The ENCODE Blacklist: Identification of Problematic Regions of the Genome. Scientific Reports. 2019;9:9354. doi: 10.1038/s41598-019-45839-z. - DOI - PMC - PubMed
    1. Arvey A, Agius P, Noble WS, Leslie C. Sequence and chromatin determinants of cell-type-specific transcription factor binding. Genome Research. 2012;22:1723–1734. doi: 10.1101/gr.127712.111. - DOI - PMC - PubMed
    1. Bakken TE, Jorstad NL, Hu Q, Lake BB, Tian W, Kalmbach BE, Crow M, Hodge RD, Krienen FM, Sorensen SA, Eggermont J, Yao Z, Aevermann BD, Aldridge AI, Bartlett A, Bertagnolli D, Casper T, Castanon RG, Crichton K, Daigle TL, Dalley R, Dee N, Dembrow N, Diep D, Ding SL, Dong W, Fang R, Fischer S, Goldman M, Goldy J, Graybuck LT, Herb BR, Hou X, Kancherla J, Kroll M, Lathia K, van Lew B, Li YE, Liu CS, Liu H, Lucero JD, Mahurkar A, McMillen D, Miller JA, Moussa M, Nery JR, Nicovich PR, Orvis J, Osteen JK, Owen S, Palmer CR, Pham T, Plongthongkum N, Poirion O, Reed NM, Rimorin C, Rivkin A, Romanow WJ, Sedeño-Cortés AE, Siletti K, Somasundaram S, Sulc J, Tieu M, Torkelson A, Tung H, Wang X, Xie F, Yanny AM, Zhang R, Ament SA, Behrens MM, Bravo HC, Chun J, Dobin A, Gillis J, Hertzano R, Hof PR, Höllt T, Horwitz GD, Keene CD, Kharchenko PV, Ko AL, Lelieveldt BP, Luo C, Mukamel EA, Preissl S, Regev A, Ren B, Scheuermann RH, Smith K, Spain WJ, White OR, Koch C, Hawrylycz M, Tasic B, Macosko EZ, McCarroll SA, Ting JT, Zeng H, Zhang K, Feng G, Ecker JR, Linnarsson S, Lein ES. Evolution of Cellular Diversity in Primary Motor Cortex of Human, Marmoset Monkey, and Mouse. bioRxiv. 2020 doi: 10.1101/2020.03.31.016972. - DOI
    1. Buenrostro JD, Giresi PG, Zaba LC, Chang HY, Greenleaf WJ. Transposition of native chromatin for fast and sensitive epigenomic profiling of open chromatin, DNA-binding proteins and nucleosome position. Nature Methods. 2013;10:1213–1218. doi: 10.1038/nmeth.2688. - DOI - PMC - PubMed

Publication types

Associated data