. 2024 Nov 16;15(1):9950.
doi: 10.1038/s41467-024-54251-9.

GPRC5A promotes lung colonization of esophageal squamous cell carcinoma

Affiliations

GPRC5A promotes lung colonization of esophageal squamous cell carcinoma

Hongyu Zhou et al. Nat Commun. .

Abstract

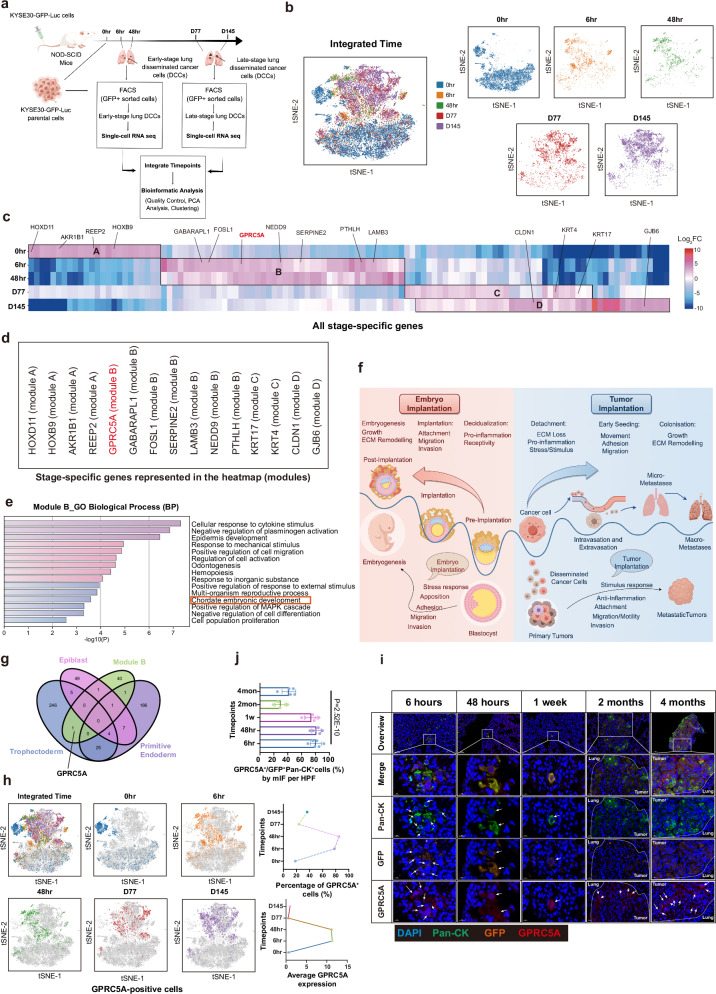
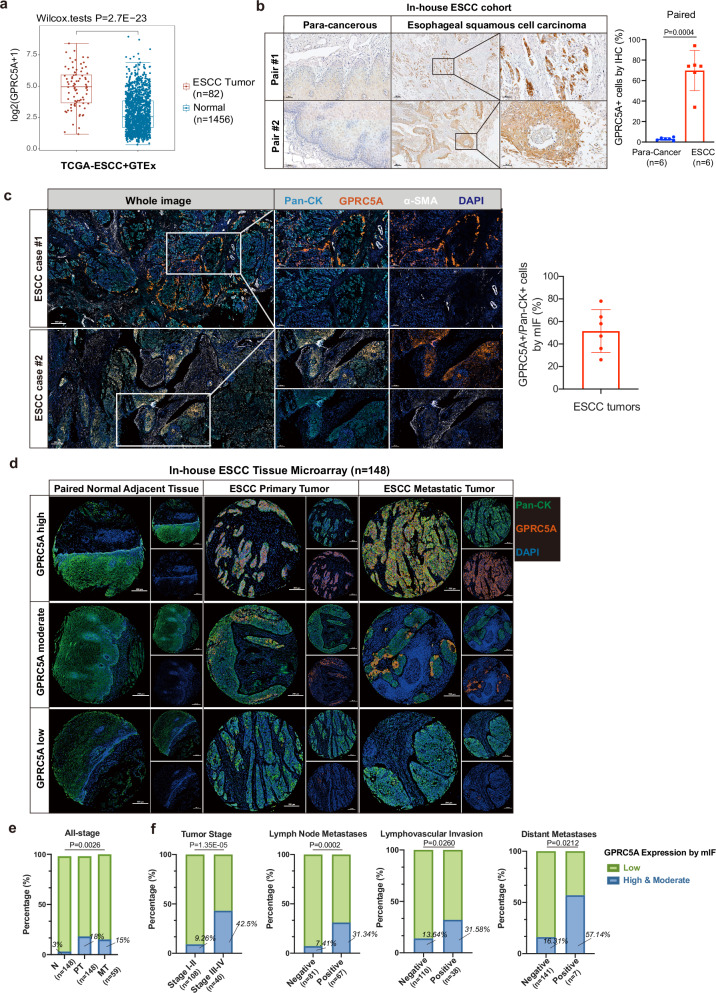
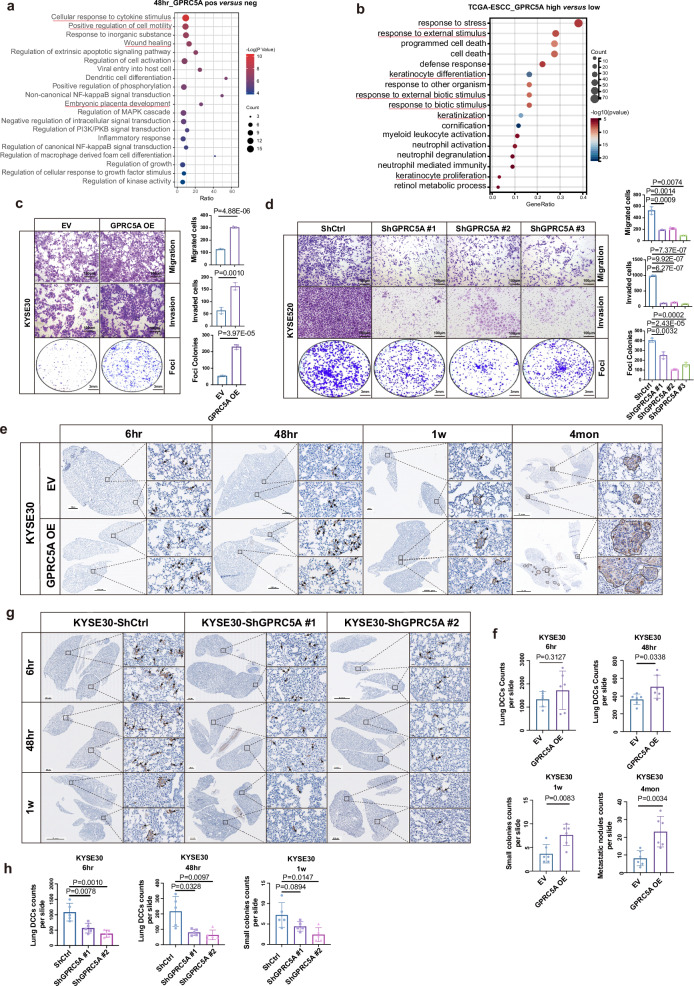
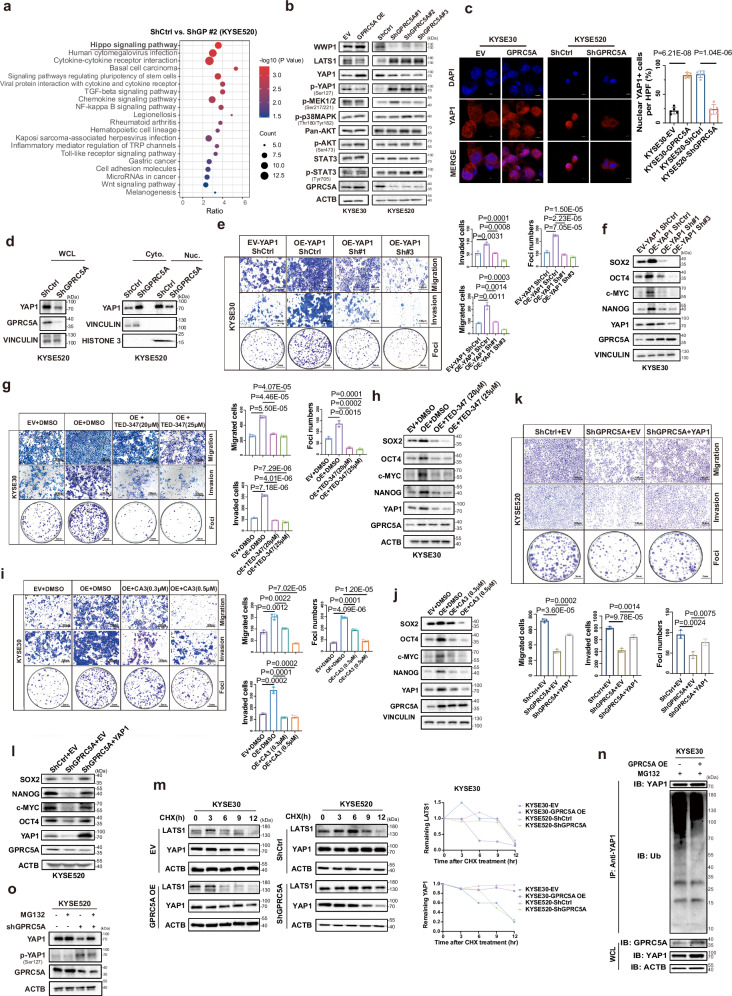
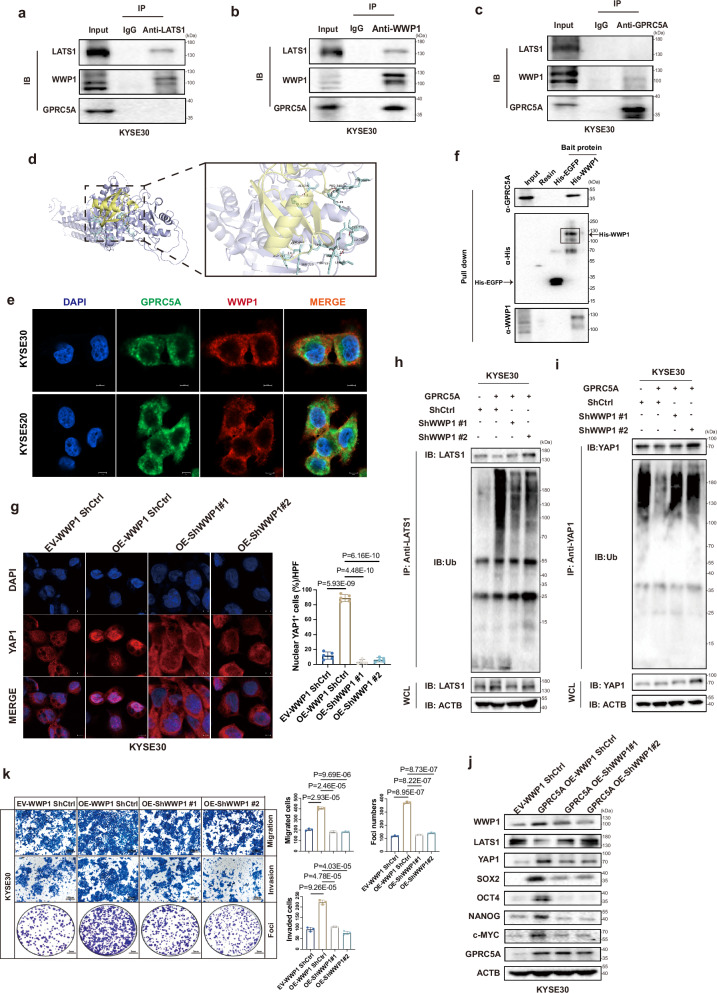
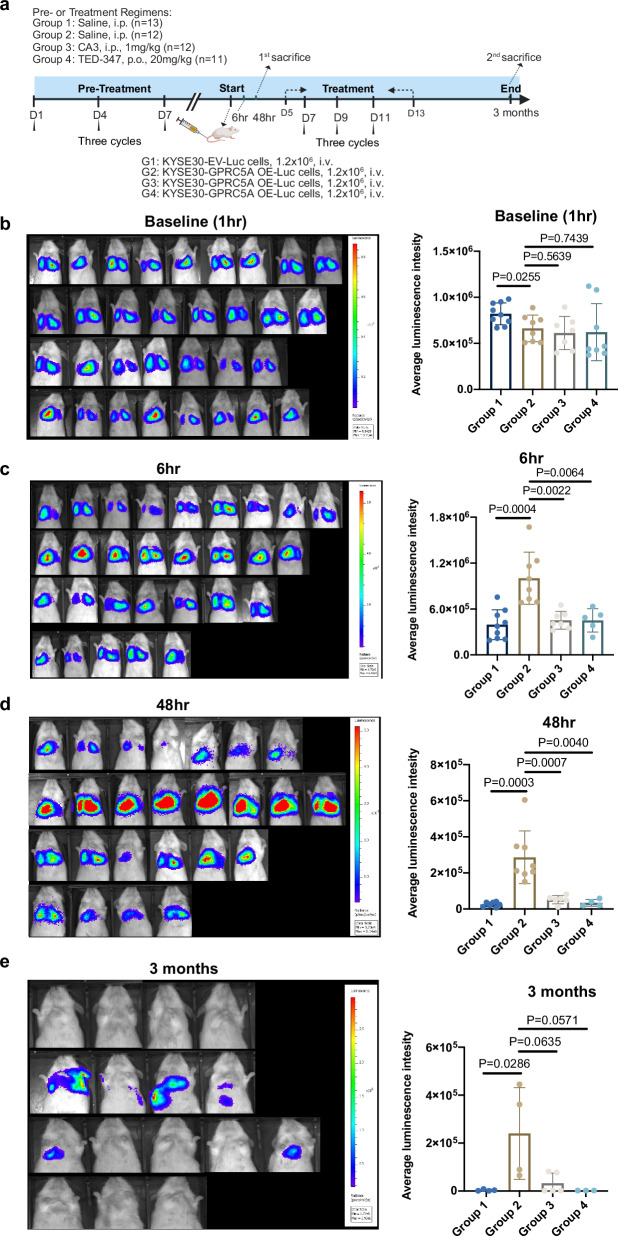
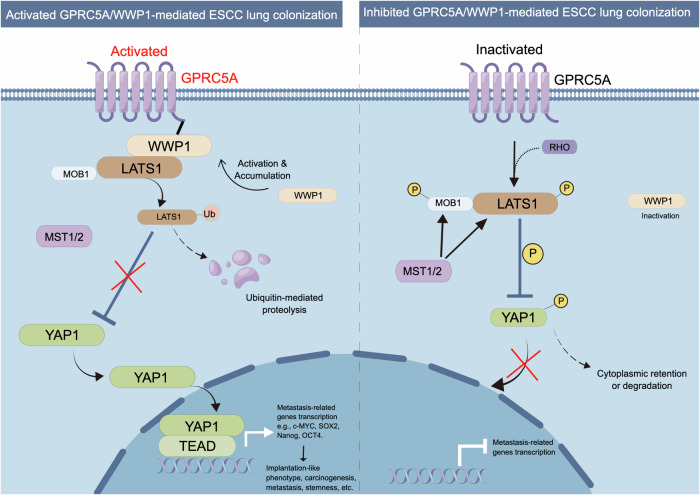
Emerging evidence suggests that cancer cells may disseminate early, prior to the formation of traditional macro-metastases. However, the mechanisms underlying the seeding and transition of early disseminated cancer cells (DCCs) into metastatic tumors remain poorly understood. Through single-cell RNA sequencing, we show that early lung DCCs from esophageal squamous cell carcinoma (ESCC) exhibit a trophoblast-like 'tumor implantation' phenotype, which enhances their dissemination and supports metastatic growth. Notably, ESCC cells overexpressing GPRC5A demonstrate improved implantation and persistence, resulting in macro-metastases in the lungs. Clinically, elevated GPRC5A level is associated with poorer outcomes in a cohort of 148 ESCC patients. Mechanistically, GPRC5A is found to potentially interact with WWP1, facilitating the polyubiquitination and degradation of LATS1, thereby activating YAP1 signaling pathways essential for metastasis. Importantly, targeting YAP1 axis with CA3 or TED-347 significantly diminishes early implantation and macro-metastases. Thus, the GPRC5A/WWP1/LATS1/YAP1 pathway represents a crucial target for therapeutic intervention in ESCC lung metastases.


Conflict of interest statement

Competing interests The authors declare no competing interests.

Figures

Fig. 1
Fig. 1. GPRC5A overexpression in early lung DCCs confers a trophoblast-like tumor implantation phenotype.
a The experimental timeline outlines the isolation of metastatic cancer cells from the lungs of mice following intravenous injection at specified timepoints: 6 hours (n = 3), 48 hours (n = 16), 77 days (n = 6), and 145 days (n = 1), for subsequent single-cell RNA sequencing. This figure is drawn by figdraw.com. b t-SNE plots reveal the distribution of isolated lung metastatic cancer cells across various timepoints: 0 hour, 6 hours, 48 hours, 77 days, and 145 days (n = 9059, 1957, 1149, 3322, 4499, respectively). c A heatmap illustrates 116 significant stage-specific genes identified across the five timepoints, based on fold change (FC) in expression (P value < 0.05), determined by a two-sided Wilcoxon signed-rank test. d Selected representative genes from Modules A, B, C, and D are shown. e Gene Ontology (GO) Biological Process (BP) analysis highlights top-level items enriched in Module B genes, utilizing a two-sided permutation test (P value < 0.05). f A schematic diagram compares embryo implantation and tumor implantation, underscoring shared subprocesses such as attachment, migration, invasion, and response to stimuli, which are essential for both processes. This figure is drawn by figdraw.com. g A Venn diagram depicts overlapping genes between Module B (n = 44) and stage-specific genes from trophectoderm (n = 281), primitive endoderm (n = 224), and epiblast (n = 67) during the pre-implantation, implantation, and post-implantation phases. h t-SNE plots illustrate the distribution of GPRC5A+ cells at five timepoints (n = 1667, 1527, 977, 786, 1635, respectively). i Representative mIF staining images depict Pan-Cytokeratin (Pan-CK, green), Green Fluorescent Protein (GFP, orange), GPRC5A (red) and DAPI (blue) from lung samples at different timepoints: 6 hours (n = 6), 48 hours (n = 6), 1 week (n = 6), 2 months (n = 5), and 4 months (n = 5). j The bar plot presents the percentages of GPRC5A+/Pan-CK+GFP+ lung DCCs per high power field (HPF), analyzed via two-sided one-way ANOVA test. Data are presented as mean ± SD (bar plots) and the n number represents n biologically independent spots/samples/genes in each group. Source data are provided as a Source Data file.
Fig. 2
Fig. 2. Upregulation of GPRC5A in ESCC tumors and its association with aggressive tumor behaviors.
a Analysis of GPRC5A expression levels in ESCC tumors (n = 82) obtained from the TCGA-ESCC database compared to normal esophageal tissues (n = 1456) from the GTEx database, evaluated using a two-sided Wilcoxon signed-rank test. b Representative images of IHC GPRC5A staining demonstrating GPRC5A expression and the proportion of GPRC5A-positive cells in ESCC tumors versus paired adjacent tissues (n = 6), analyzed using a two-sided paired t-test. c Representative images of multi-channel immunofluorescence (mIF) staining showcasing Pan-Cytokeratin (Pan-CK, a tumor cell marker, shown in light blue), GPRC5A (shown in orange), alpha-smooth muscle actin (α-SMA, a stromal cell marker, shown in white), and DAPI (shown in dark blue) in primary tumors from ESCC patients (n = 6) in our in-house cohort. The bar plot illustrates the percentage of GPRC5A-positive/Pan-CK-positive cells by mIF staining in ESCC tumors. d Overview of GPRC5A expression stratified into high/moderate, and low categories within an ESCC tissue microarray (TMA) comprising paired normal adjacent esophageal epithelium (n = 148), ESCC primary tumors (n = 148), and lymph node metastatic tumors (n = 59), analyzed via mIF staining using Pan-CK (green), GPRC5A (orange), and DAPI (blue). e Proportion of high or moderate (green) and low (blue) GPRC5A expression levels across the ESCC TMA, including normal tissues (n = 148), primary tumors (n = 148), and metastatic tumors (n = 59). Two-sided Chi-Squared test is used for statistical analysis. f Correlation analysis of GPRC5A expression (high/moderate in green vs. low in blue) with clinical parameters, including tumor stage (I-II, n = 108 vs. III-IV, n = 40), lymph node metastasis (negative, n = 81 vs. positive, n = 67), lymphovascular invasion (negative, n = 110 vs. positive, n = 38), and distant metastasis (negative, n = 141 vs. positive, n = 7), determined using two-sided Chi-squared or Fisher’s exact tests. The data are presented as the mean ± SD (bar plots) and median ± IQR (whiskers = 1.5 × IQR, box & whiskers plots). The n number represents n biologically independent samples/patients in each group. Source data are provided as a Source Data file.
Fig. 3
Fig. 3. GPRC5A overexpression promotes tumor growth, early implantation, and progression.
a The top 20 GO BP terms associated with DEGs are identified between GPRC5A-positive and GPRC5A-negative lung DCCs at 48 hours from scRNA-seq data, using a two-sided permutation test. b GO BP analysis of DEGs comparing patients with high GPRC5A expression (upper 25%, n = 21) to those with low expression (lower 25%, n = 21) from the TCGA-ESCC database, also employing a two-sided permutation test. c, d Assays to assess migration, invasion, and foci colonies in KYSE30 cells overexpressing GPRC5A versus control cells (c, n = 3, two-sided unpaired t-test). Similarly, KYSE520 cells with GPRC5A knockdown are compared to control cells (d, n = 3, two-sided unpaired t-test). e, f Representative IHC images of Pan-Cytokeratin staining in the lungs of NOD-SCID mice at multiple timepoints (6 hours, 48 hours, 1 week, 4 months) following intravenous injection of KYSE30 cells overexpressing GPRC5A or control cells in a lung metastasis model (e, n = 6 per group per timepoint). Black arrows indicate disseminated cancer cells at early stages and metastatic nodules at late stages (e). The counts of lung DCCs at 6 hours and 48 hours, small colonies (2-5 cells) at 1 week, and metastatic nodules (>10 cells) at 4 months are presented in bar plot (f), analyzed using a two-sided unpaired t-test. g, h Representative images of IHC Pan-Cytokeratin staining in the lungs of NOD-SCID mice at 6 hours, 48 hours, and 1 week post-injection of KYSE30 GPRC5A-knockdown or control cells (g, n = 5 per group per timepoint). Black arrows indicate disseminated cancer cells at early stages. The counts of lung DCCs at 6 hours and 48 hours and small colonies (2-5 cells) at 1 week are displayed in bar plots (h), analyzed using a two-sided unpaired t-test. Data are presented as mean ± SD (bar plots), and the n number represents n biologically independent samples/experiments in each group. Source data are provided as a Source Data file.
Fig. 4
Fig. 4. The pro-metastatic and oncogenic role of GPRC5A mediated by YAP1 nuclear translocation.
a Enriched KEGG pathways derived from differentially expressed genes (DEGs) identified through transcriptome sequencing comparing KYSE520-Control (ShCtrl) and shGPRC5A cells, analyzed using a two-sided permutation test. b Western blot analysis revealing expression levels of key components in the Hippo signaling pathway (LATS1, YAP1, phosphorylated YAP1), PI3K/AKT pathway (pan-AKT, phosphorylated AKT, STAT3, phosphorylated STAT3), and MAPK pathway (phosphorylated MEK1/2, phosphorylated p38MAPK), as well as WWP1, following modulation of GPRC5A expression in KYSE30 and KYSE520 cells (n = 3). c Representative ICC staining images illustrating YAP1 (red) localization alongside DAPI (blue) in GPRC5A-overexpressing KYSE30 cells and GPRC5A-silenced KYSE520 cells treated with the proteasome inhibitor MG132 (10 µM) (n = 5; two-sided unpaired t-test). d Immunoblot analysis of YAP1 in whole cell lysates (WCL), cytoplasmic (Cyto.), and nuclear (Nuc.) fractions from KYSE520 cells with either GPRC5A silencing or control (n = 3). Vinculin and Histone 3 serve as markers for cytoplasmic and nuclear proteins, respectively. ej Transwell migration, invasion, foci formation assays, and immunoblotting of YAP1 downstream genes following knockdown via shRNAs targeting YAP1 or treatment with two pharmacological YAP-TEAD inhibitors (CA3 and TED-347) in GPRC5A-overexpressing KYSE30 cells (n = 3; two-sided unpaired t-test). k, l Transwell migration, invasion, foci formation assays, and immunoblotting of downstream genes following YAP1 rescue in GPRC5A-silenced KYSE520 cells (n = 3; two-sided unpaired t-test). m Pulse-chase assay tracking YAP1 and LATS1 protein levels at various timepoints (0, 3, 6, 9, 12 hours) upon cycloheximide (CHX, 50 µg/mL) treatment (n = 3). n Ubiquitination levels of YAP1 precipitated with an anti-YAP1 antibody in GPRC5A-overexpressing KYSE30 cells and controls treated with MG132 (10 µM) (n = 3). o Expression levels of YAP1 and phosphorylated YAP1 in GPRC5A-silenced or control KYSE520 cells following treatment with or without MG132 (10 µM) (n = 3). For western blots, the samples derive from the same experiment but different gels for all tested antibodies were processed in parallel in Fig. 4b, d, f, h, j, l, m, n, o. Data are presented as mean ± SD (bar plots), and the n number represents n biologically independent samples/experiments in each group. Source data are provided as a Source Data file.
Fig. 5
Fig. 5. Interaction of GPRC5A and WWP1 induces LATS1 degradation and activates YAP1.
a–c Co-immunoprecipitation (co-Ip) assays to illustrate the interaction between GPRC5A, WWP1, and LATS1, utilizing anti-LATS1 (a), anti-WWP1 (b), and anti-GPRC5A antibodies (c) in whole cell lysates from KYSE30 parental cells (n = 3). The samples derive from the same experiment but different gels for anti-GPRC5A, another for anti-WWP1, another for anti-LATS1 were processed in parallel. d The predicted 3D structure of the GPRC5A (yellow) and WWP1 (purple) complex, along with the potential binding sites indicated by light blue chemical bonds, is generated through molecular docking analysis and visualized using PyMOL software. e Immunofluorescence co-localization staining of GPRC5A (green), WWP1 (red), and DAPI (blue) is conducted in KYSE30 and KYSE520 parental cells to further confirm their potential interaction (n = 3). f Protein pull-down assays were executed using recombinant His-tagged WWP1 and EGFP proteins in KYSE520 cell lysates (n = 3). The samples derive from the same experiment but different gels for anti-GPRC5A, another for anti-His, another for anti-WWP1 were processed in parallel. g Representative ICC staining images of YAP1 (red) and DAPI (blue) in WWP1-silenced KYSE30 cells overexpressing GPRC5A, treated with MG132 (10 µM), is presented along with a bar plot illustrating the percentage of nuclear YAP1-positive cells per HPF (n = 5, two-sided unpaired t-test). h–i Immunoblotting was performed to assess the ubiquitination levels of YAP1 and LATS1, which were precipitated using respective antibodies in WWP1-knockdown KYSE30 cells overexpressing GPRC5A, following pretreatment with MG132 (10 µM) (n = 3). WCL, whole cell lysates. The samples derive from the same experiment but different gels for anti-LATS1, another for anti-ubiquitin, another for anti-ACTB were processed in parallel. j, k Transwell assays for migration, invasion, and foci formation (n = 3, two-sided unpaired t-test) are conducted, alongside an evaluation of YAP1 downstream gene expression (n = 3) in WWP1-silenced KYSE30 cells with GPRC5A overexpression. The samples derive from the same experiment but different gels for all tested antibodies were processed in parallel. Data are presented as mean ± SD (bar plots), and the n number represents n biologically independent samples/experiments in each group. Source data are provided as a Source Data file.
Fig. 6
Fig. 6. Inhibition of YAP1 impedes early implantation and metastatic tumor outgrowth in ESCC.
a Experimental design illustrating the use of YAP1-TEAD inhibitors (CA3 and TED-347) in a murine model to evaluate their effects on both lung micro-metastases and macro-metastases associated with ESCC. This figure is created in BioRender. Bella, liub1128@outlook.com. (2024) BioRender.com/g35e219. b–d Bioluminescence imaging is employed to assess and quantify the average luminescence intensity in the lungs of mice at baseline (b, 1 hour post-injection; Group 1 n = 9, Group 2 n = 8, Group 3 n = 7, Group 4 n = 8), at 6 hours (c, Group 1 n = 9, Group 2 n = 8, Group 3 n = 7, Group 4 n = 5), and at 48 hours (d, Group 1 n = 7, Group 2 n = 8, Group 3 n = 6, Group 4 n = 4) following pre-treatment with or without YAP1-TEAD inhibitors over three cycles. Statistical analysis is performed using a two-sided unpaired t-test for baseline and 6 hours and a two-sided Wilcoxon signed-rank test for 48 hours. e Long-term outcomes are evaluated at 3 months post-injection, with BLI and quantification of average luminescence intensity in the lungs of mice treated with or without YAP1-TEAD inhibitors over six cycles (Group 1 n = 4, Group 2 n = 4, Group 3 n = 5, Group 4 n = 3). Statistical analysis was performed using a two-sided Wilcoxon signed-rank test. Average luminescence intensity is calculated as photons/second/cm²/steradian. Data are presented as mean ± SD (bar plots), and the n number represents n biologically independent samples in each group. Source data are provided as a Source Data file.
Fig. 7
Fig. 7. Schematic diagram of the mechanisms by which GPRC5A facilitates the implantation and colonization of ESCC cells, mediated through the WWP1-LATS1-YAP1 signaling axis.
Activated GPRC5A interacts with WWP1, which promotes the polyubiquitination and degradation of LATS1. This process eliminates LATS1’s inhibitory effects on YAP1 nuclear translocation, thereby enhancing the activation of downstream metastasis-related genes. This figure is drawn by figdraw.com.

References

    1. Klein, C. A. Cancer progression and the invisible phase of metastatic colonization. Nat Rev Cancer20, 681–694 (2020). - PubMed
    1. Valastyan, S. & Weinberg, R. A. Tumor metastasis: molecular insights and evolving paradigms. Cell147, 275–292 (2011). - PMC - PubMed
    1. Pantel, K., Alix-Panabières, C. & Riethdorf, S. Cancer micrometastases. Nat Rev Clin Oncol6, 339–351 (2009). - PubMed
    1. Hosseini, H. et al. Early dissemination seeds metastasis in breast cancer. Nature540, 552–558 (2016). - PMC - PubMed
    1. Siegel, R. L., Giaquinto, A. N. & Jemal, A. Cancer statistics, 2024. CA Cancer J Clin74, 12–49 (2024). - PubMed

Publication types

MeSH terms

Associated data