Comparative Study
. 2010 Apr 15;184(8):4557-67.
doi: 10.4049/jimmunol.0902336. Epub 2010 Mar 10.

Cell-specific gene expression in Langerhans cell histiocytosis lesions reveals a distinct profile compared with epidermal Langerhans cells

Affiliations
Comparative Study

Cell-specific gene expression in Langerhans cell histiocytosis lesions reveals a distinct profile compared with epidermal Langerhans cells

Carl E Allen et al. J Immunol. .

Abstract

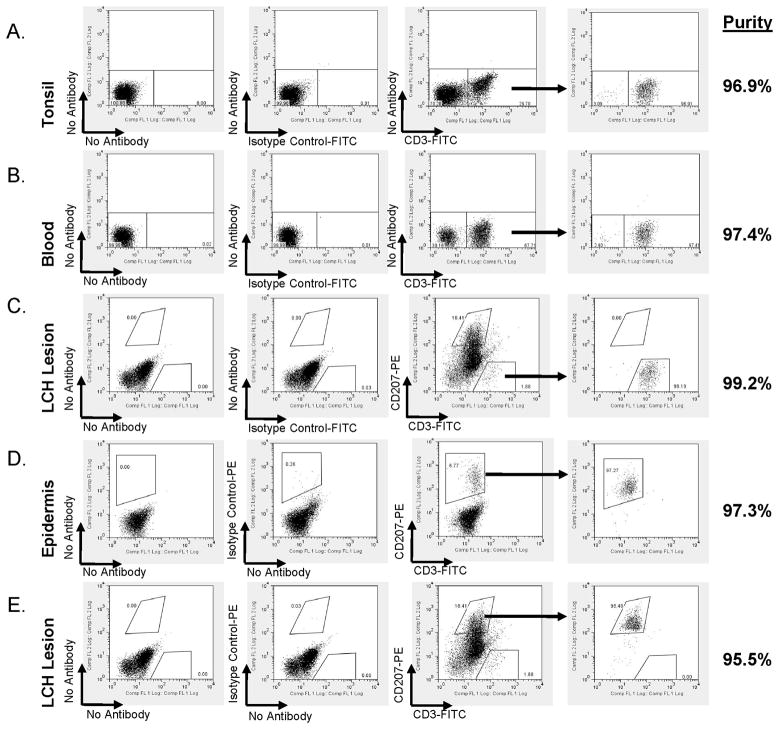
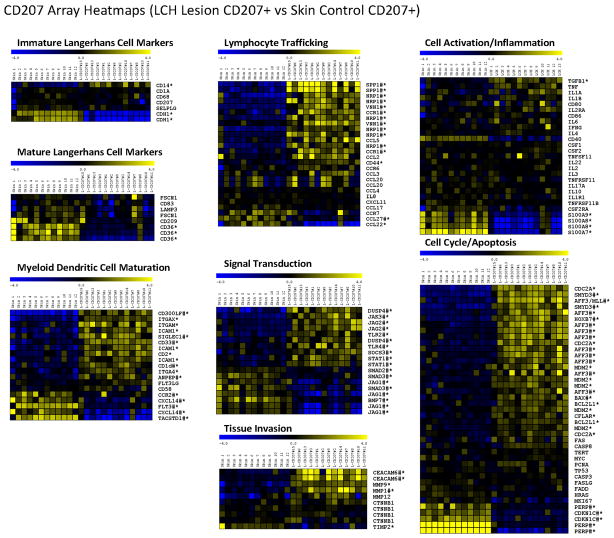
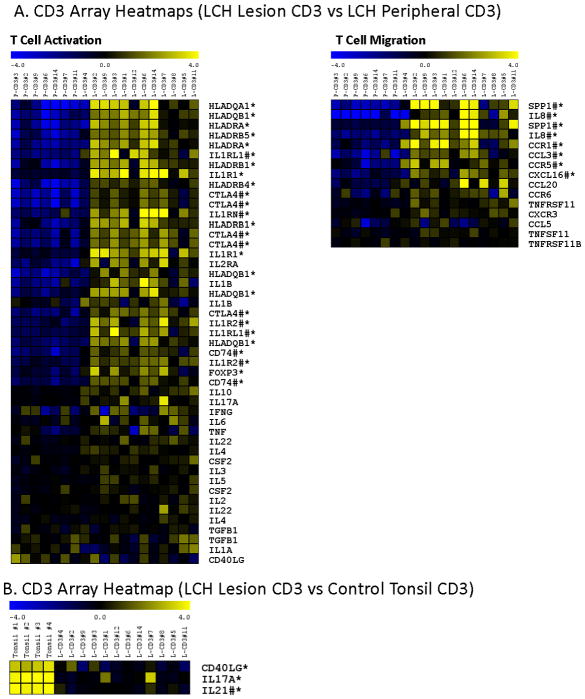
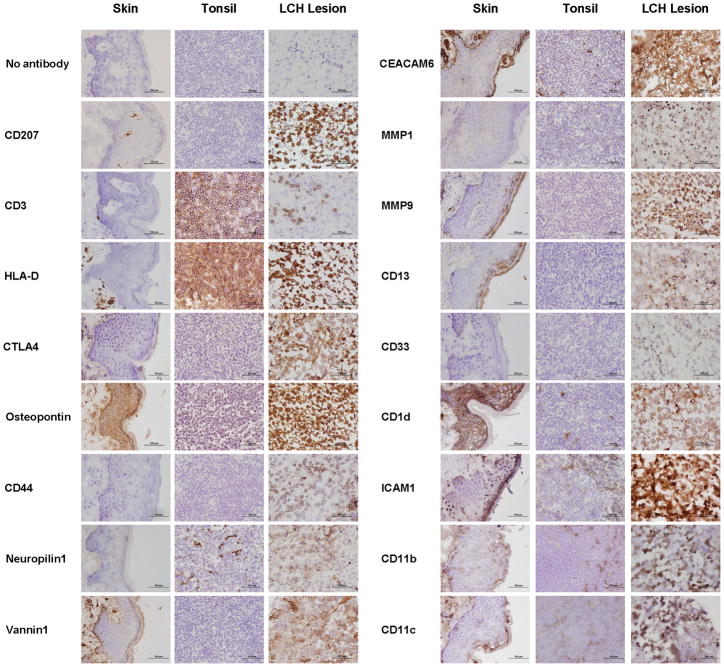
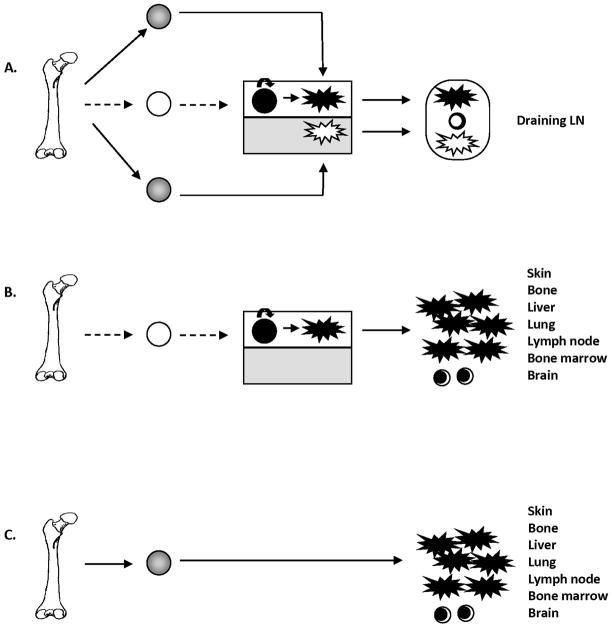
Langerhans cell histiocytosis (LCH) is a rare disease characterized by heterogeneous lesions containing CD207(+) Langerhans cells (LCs) and lymphocytes that can arise in almost any tissue and cause significant morbidity and mortality. After decades of research, the cause of LCH remains speculative. A prevailing model suggests that LCH arises from malignant transformation and metastasis of epidermal LCs. In this study, CD207(+) cells and CD3(+) T cells were isolated from LCH lesions to determine cell-specific gene expression. Compared with control epidermal CD207(+) cells, the LCH CD207(+) cells yielded 2113 differentially expressed genes (false discovery rate < 0.01). Surprisingly, the expression of many genes previously associated with LCH, including cell-cycle regulators, proinflammatory cytokines, and chemokines, were not significantly different from control LCs in our study. However, several novel genes whose products activate and recruit T cells to sites of inflammation, including SPP1 (osteopontin), were highly overexpressed in LCH CD207(+) cells. Furthermore, several genes associated with immature myeloid dendritic cells were overexpressed in LCH CD207(+) cells. Compared with the peripheral CD3(+) cells from LCH patients, the LCH lesion CD3(+) cells yielded only 162 differentially regulated genes (false discovery rate < 0.01), and the expression profile of the LCH lesion CD3(+) cells was consistent with an activated regulatory T cell phenotype with increased expression of FOXP3, CTLA4, and SPP1. Results from this study support a model of LCH pathogenesis in which lesions do not arise from epidermal LCs but from accumulation of bone marrow-derived immature myeloid dendritic cells that recruit activated lymphocytes.


Figures

Figure 1
Figure 1. Scatter Plot of Cells Isolated Cells
Tissue samples were prepared as described in Methods. These images represents typical FACS studies from (A) control tonsil, (B) peripheral blood from LCH patients, (C)(E) LCH lesions, and (D) control skin (epidermis). The scanner was gated on PI-negative cells (living cells), and then CD207+ and CD3+ cells were purified with fluorescent conjugated antibodies. The scatter plots show results (right-to-left) with no antibody staining, isotype control, CD3+ and CD207+, then re-analysis of the sorted cells in a purity check. Sorted cell purity ranged from 95.5%–99.2% in these experiments. For the LCH lesions, CD3:CD207 ratio varies considerably from sample to sample (Supplemental Table IB), but the plot shown in (C) and (E) is a typical result and demonstrates the ability to obtain specific cell fractions from LCH lesions.
Figure 2
Figure 2. LCH-Associated Genes: CD207+
CD207+ (LCH Lesion CD207+ vs Skin CD207) Gene Heatmap Literature was reviewed for genes associated with LCH, and tested for LCH CD207+-specific gene expression in our study. Genes with significant differential gene expression as determined by SAM analysis are identified in the heatmap with (*). Repeated sample names represent genes with multiple probes on the Affymetrix gene chip with significant results in the expression array experiments. Control skin sample CD207+ cells are listed on the left half of the figure. LCH CD207+ samples are listed on the right. Yellow boxes indicate increased expression in an individual sample. Blue indicates decreased expression. Some genes were not differentially expressed because expression was consistently high in both sets (example, IL1B). Some genes were not differentially expressed because expression was absent in both sets (example, IL17A). Some genes were not indicated as differentially expressed due to variability within the sets (example, CCL20). The categorical gene list indicates genes with significant increased (yellow) or decreased (blue) expression that may be relevant to LCH pathology and represent potential targets for diagnosis, prognosis and therapy. Several new genes not previously identified with LCH were identified (#), including genes involved in lymphocyte trafficking and myeloid dendritic cell-related integrins. Genes/proteins previously associated with LCH LCH CD207+ Array BCL2L1 (48,49), CASP3 (48), CASP8 (50), CCL2 (10), CCL20/MIP-3α (51), CD44 (52), CCL22 (10,53,54), CCR6 (51), CCR7 (55), CD11b/ITGAM (,,–58), CD11c/ITGAX (25,38,52,57), CD14 (39), CD1a (Reviewed in 3,4,10), CD2 (25,52,58,59), CD36 (60), CD40 (39,61), CD49d/ITGA4 (25), CD54/ICAM1 (25,52), CD58 (25,52), CD68 (57), CD80 (39), CD83 (39,62), CD86 (39), cdc2a/p16 (49), CD-SIGN/CD209 (63), CFLAR (50), CLA/SELPLG (64), c-myc (65), CXCL11/I-TAC (51), CXCL8/IL-8 (10), DC-LAMP/CD208 (39), E-cadherin/CDH1 (25,26), FADD (50), FAS (66), Fascin/FSCN1 (67,68), FASLG (66), FLT3LG (38), GMCSF/CSF2 (10,69,70), GM-CSFR/CSF2RA (70), H-ras (65), hTERT (71,72), IFNγ (10,23,24), IL-10 (10,32,39), IL-17A (22), IL1R1 (73), IL-1α (10,23,24), IL-1β (10,23,24), IL-2 (10,24), IL-22 (22), IL2Rα/CD25 (58,74,75), IL-3 (10,24), IL-4 (10,23,24), IL-6 (10), Ki67 (49,59), Langerin/CD207 (Reviewed in 3,4,10), M-CSF/CSF1 (38), MDM2 (49), MIP-1α/CCL3 (10), MIP-1β/CCL4 (10), MMP12 (22,53), MMP9 (22,27,28), Osteoprotegerin/TNFRSF11B (74,75), p53 (49,76,77), RANKL/TNFSF11 (22,23,74), RANK/TNFRSF11 (32), RANTES/CCL5 (51), S100A7 (78), S100A8 (78), S100A9 (78), TARC/CCL17 (10,53), TGF-β (10,23,24), TIMP2 (28), TNFα (10,24,25,79).
Figure 3
Figure 3. LCH-Associated Genes: CD3+
Figure 3A: LCH CD3+ (LCH Lesion CD3 vs LCH Peripheral CD3) Gene Heatmap Expression profile results of CD3+ cells isolated from LCH lesions (LCH tumor CD3) (right) and CD3+ cells isolated from peripheral blood of patients with active LCH (LCH peripheral CD3) (left). The results from this comparison shows that genes associated with lymphocyte migration and activation have increased expression in tumor-infiltrating lymphocytes. This suggests that lymphocytes may play an active role in tumor formation and progression in LCH. Increased expression of FOXP3 and CTLA-4 specifically suggests over-representation of regulatory CD3+CD4+ T cells, which are thought to arise from antigen-driven activation. Osteopontin (SPP1) showed the highest relative expression in both LCH CD207+ cells and LCH lesion CD3+ cells. Figure 3B: CD3+ (LCH Lesion CD3 vs Tonsil CD3) Gene Heatmap Expression profile results of CD3+ cells isolated from LCH lesions (LCH tumor CD3) (right) and control CD3+ cells isolated from tonsils (left). These results suggest that, while LCH lesion T cells may be activated, they have significantly less expression of IL17 and IL21, associated with acute inflammation, compared to control tonsil T cells. Genes/proteins previously associated with LCH LCH CD3+ Arrays CCL20/MIP3α (51), CCL5/RANTES (51), CCR6 (51), CD40LG (39,61,74), CXCR3 (10), FOXP3 (32), GMCSF/CSF2 (10,69,70), HLA-DR/DQ (10,39,80), IFN-γ (10,23,24), IL-10 (10,32,39), IL-17A (22), IL-1R1 (75), IL-1α (10,23,24), IL-1β (10,23,24), IL-2 (10,23,24), IL-22 (22), IL2Rα/CD25 (32,74), IL-3 (10,24), IL-4 (10,23,24), IL-5 (10,24), (IL-6) 10, TGF-β (10,23,24), TNFRSF11B (74,75), TNFSF11/RANKL (22,74), TNFα (10,24,25,79).
Figure 4
Figure 4. Immunohistochemistry of LCH-associated proteins
Immunohistochemistry with horseradish peroxidase-conjugated secondary antibodies was used to identify protein products of genes identified by the array experiments as overexpressed in LCH lesions. Normal skin and tonsil samples were used as controls for antibody staining. Images were magnified using the Olympus BX51 microscope, 40Xobjective. The black bar represents 100 μm. Immunohistochemistry images for each antibody are from a single LCH biopsy specimen, a single tonsil sample and a single skin sample and are representative of a series of 4 LCH lesions, 3 tonsil samples and 3 skin samples that were stained in the same manner.
Figure 5
Figure 5. Models of Langerhans Cell Function and LCH
Figure 5A. Epidermal Langerhans Cells and Dermal CD207+ Dendritic Cells Two CD207+ dendritic cell populations have been described: epidermal LCs and dermal dendritic cells 36. Langerhans cells (black star) are derived from self-renewing radio-resistant precursors (black circle) that migrate to epidermis (white box) during fetal life(white sphere, dashed arrow). In order to maintain homeostasis after injury or inflammation, monocytes (gray circle) may migrate to the epidermis where they differentiate into LCs. Epidermal LCs are thought to process antigen, then undergo activation via pro-inflammatory cytokines, down-regulate adhesion molecules, and migrate to draining lymph nodes where they present antigen to effector T cells (black/white circles). CD207+ dermal dendritic cells (white star) are a transitory cell population derived from myeloid dendritic cell precursors that migrate through the dermis (gray box) and, like LCs, present antigen to effector T cells. Figure 5B. The Immature-Activated Model of LCH LCH is currently thought to arise from pathologic epidermal LCs (black star) that either undergo malignant transformation or proliferate due to immune dysregulation and form lesions in skin, bone, liver, lung, lymph node, bone marrow or brain. T cells are present in LCH lesions (black/white circles), but do not have functional interactions with the pathologic LCs. Figure 5C. The Misguided Myeloid Dendritic Cell Precursor Model Based on results from our study, we hypothesize that LCH lesions may arise directly from bone marrow-derived myeloid dendritic cell precursors (gray circle). Pathologic dendritic cells acquire CD207 antigen expression as they home to sites of disease. The CD207+ LCH cells express factors that attract T cells to the lesions, with enrichment of a regulatory T cell population.

References

    1. Carstensen H, Ornvold K. Langerhans-cell histiocytosis (histiocytosis X) in children. Ugeskr Laeger. 1993;155:1779–1783. - PubMed
    1. Arico M, Girschikofsky M, Genereau T, Klersy C, McClain K, Grois N, Emile JF, Lukina E, De JE, Danesino C. Langerhans cell histiocytosis in adults. Report from the International Registry of the Histiocyte Society. Eur J Cancer. 2003;39:2341–2348. - PubMed
    1. Arceci RJ. The histiocytoses: the fall of the Tower of Babel. Eur J Cancer. 1999;35:747–767. - PubMed
    1. McClain KL, Natkunam Y, Swerdlow SH. Atypical cellular disorders. Hematology Am Soc Hematol Educ Program. 2004:283–296. - PubMed
    1. Gadner H, Grois N, Potschger U, Minkov M, Arico M, Braier J, Broadbent V, Donadieu J, Henter JI, McCarter R, Ladisch S. Improved outcome in multisystem Langerhans cell histiocytosis is associated with therapy intensification. Blood. 2008;111:2556–2562. - PubMed

Publication types

MeSH terms

Associated data