Comparative Study
. 2021 Apr 22:10:e65435.
doi: 10.7554/eLife.65435.

T cell self-reactivity during thymic development dictates the timing of positive selection

Affiliations
Comparative Study

T cell self-reactivity during thymic development dictates the timing of positive selection

Lydia K Lutes et al. Elife. .

Abstract

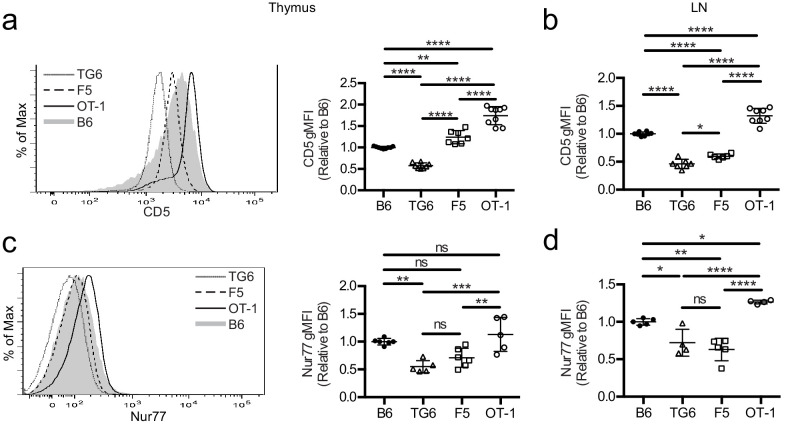
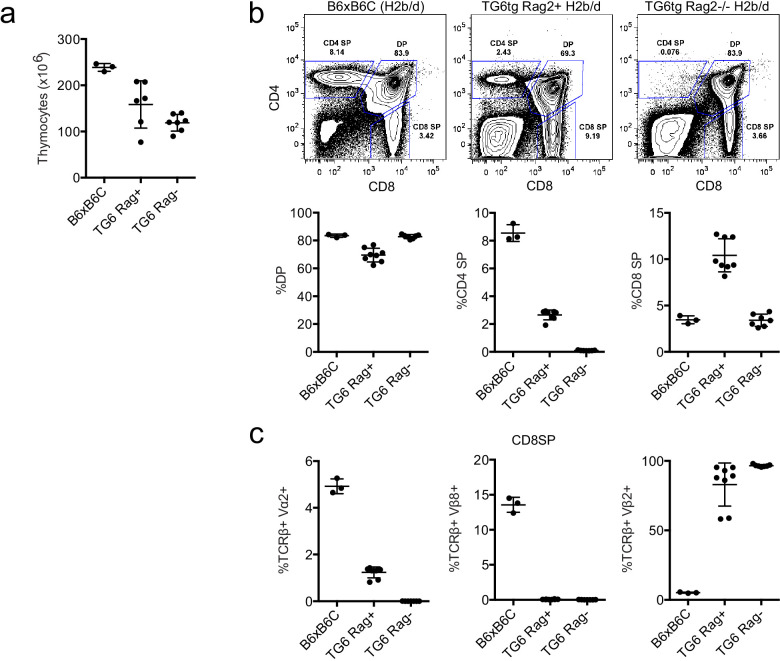
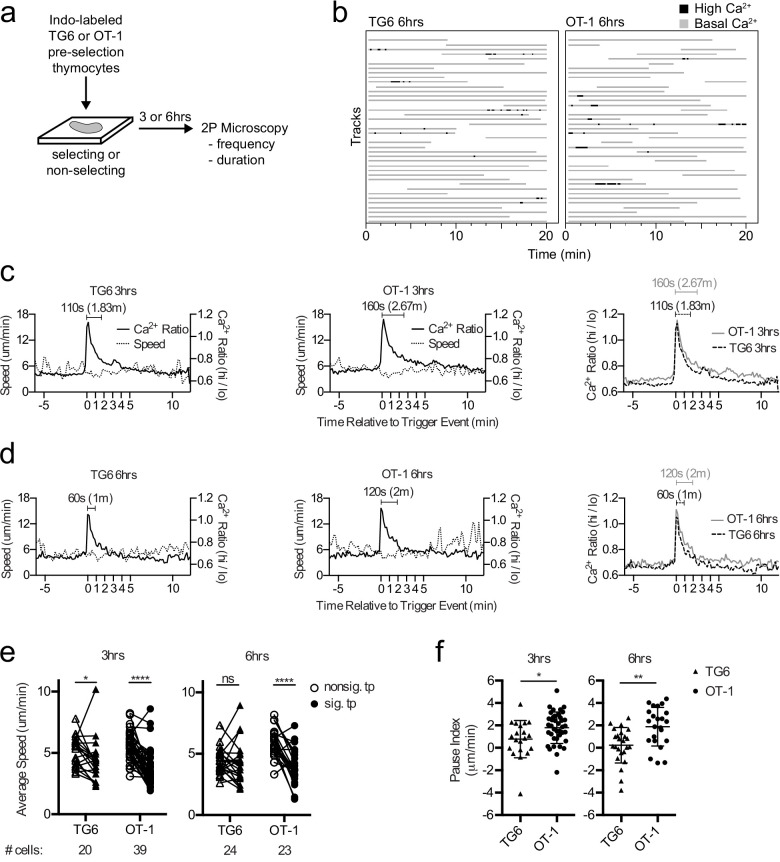
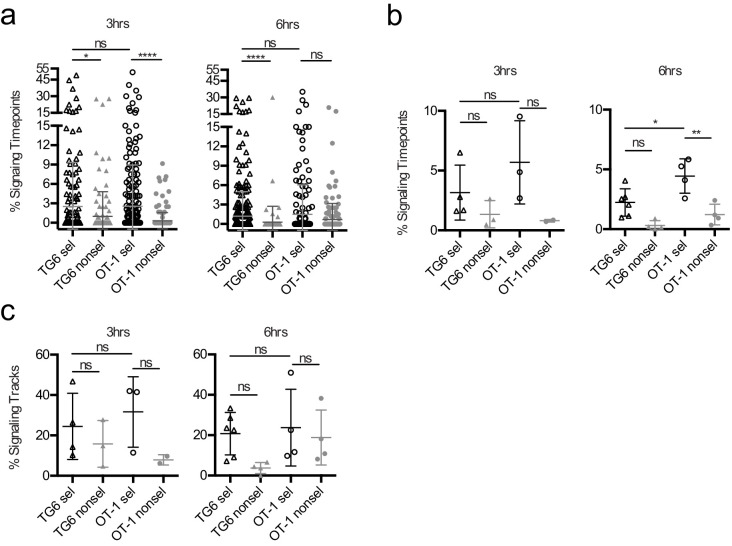
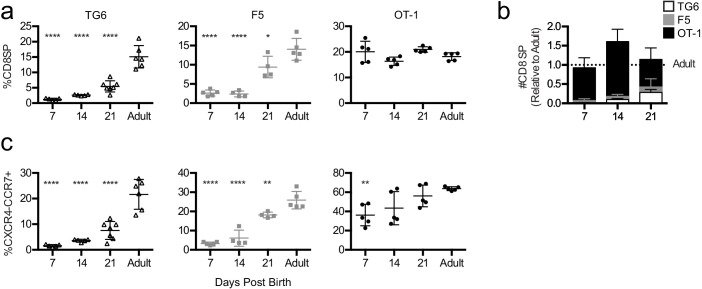
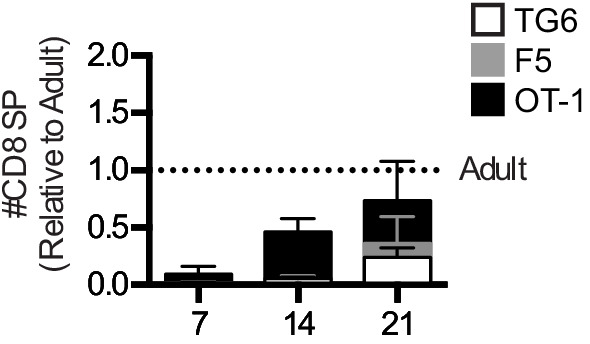
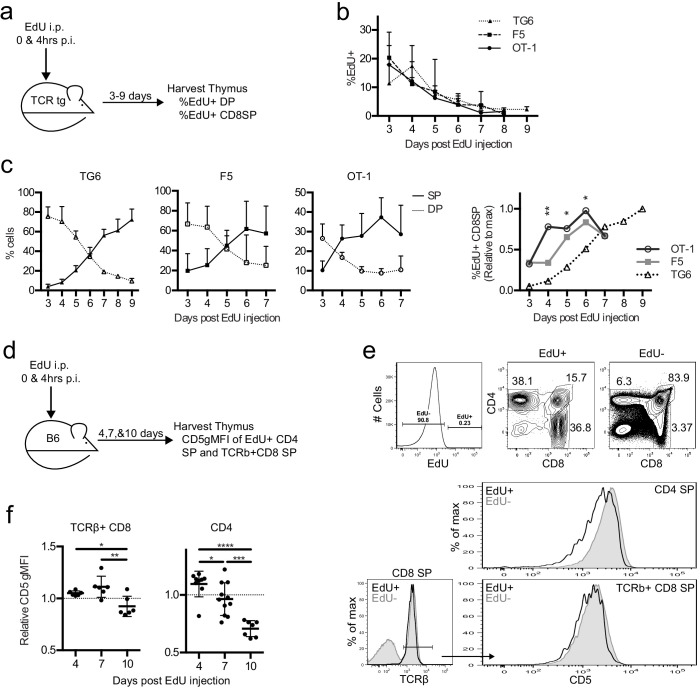
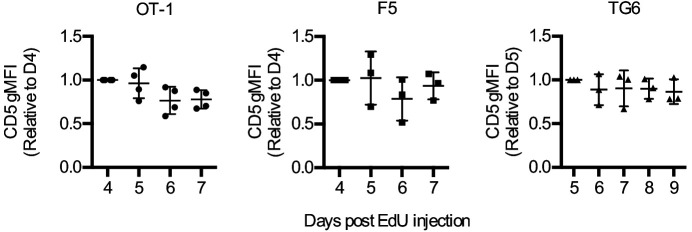
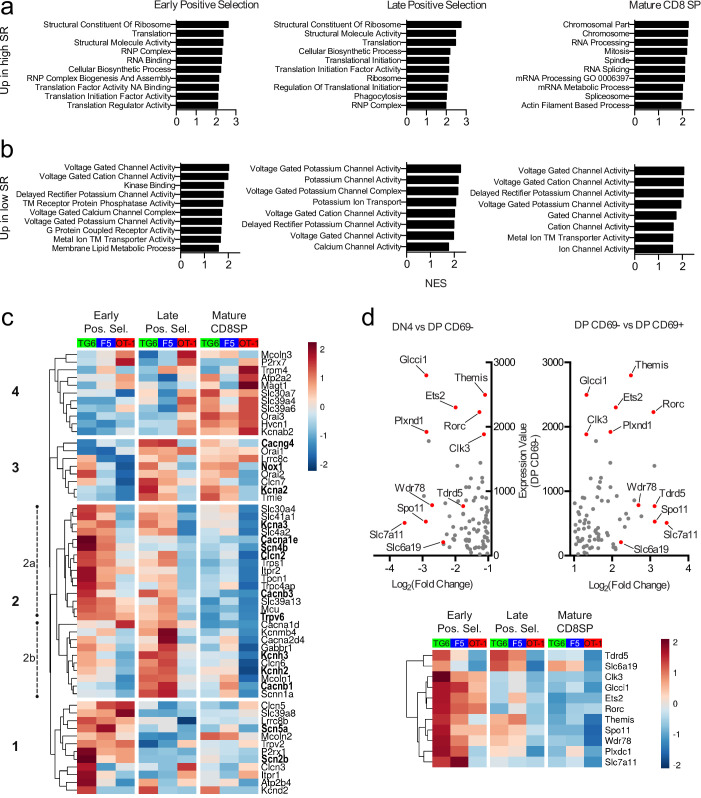
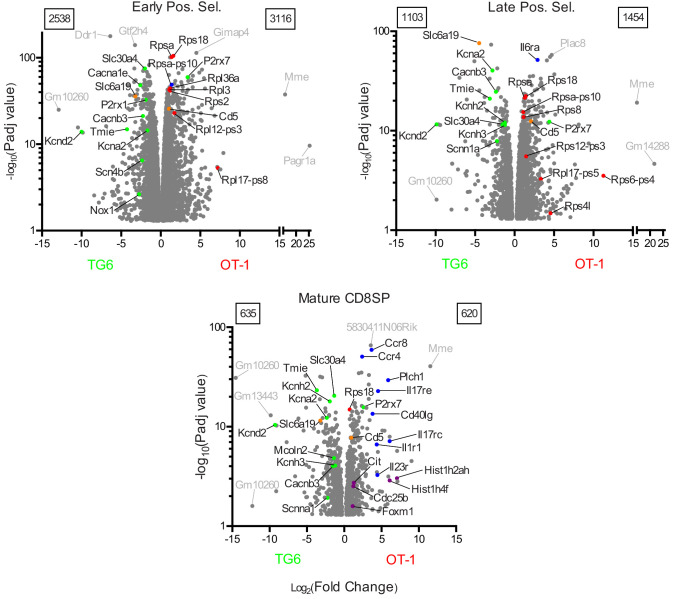
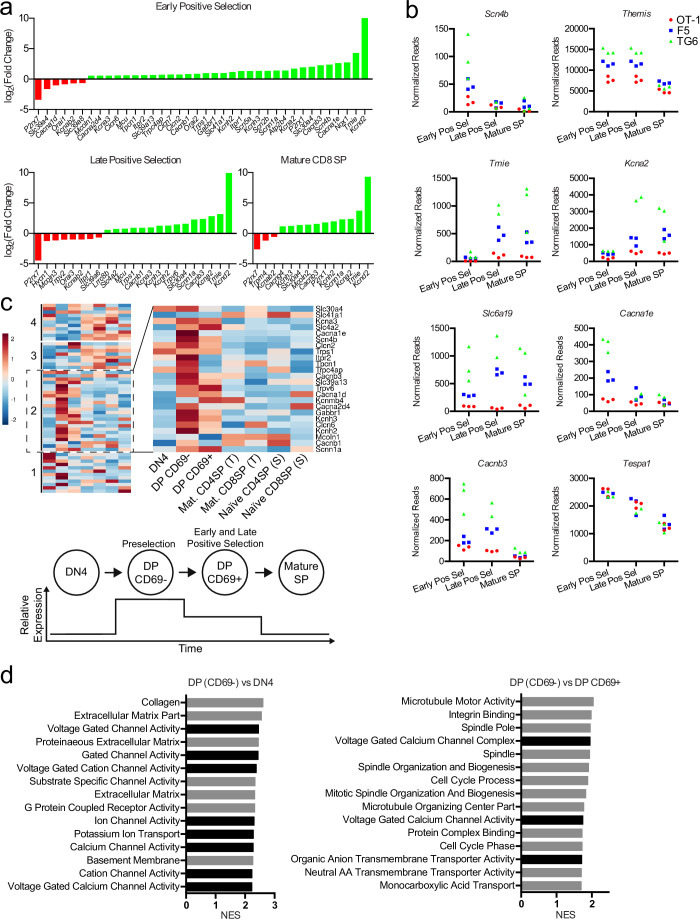
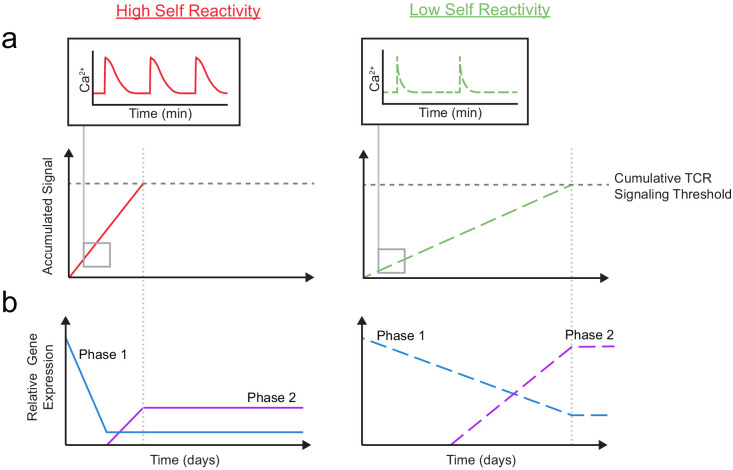
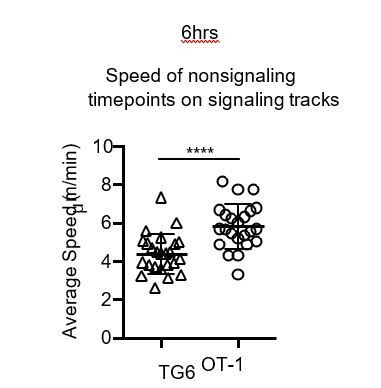
Functional tuning of T cells based on their degree of self-reactivity is established during positive selection in the thymus, although how positive selection differs for thymocytes with relatively low versus high self-reactivity is unclear. In addition, preselection thymocytes are highly sensitive to low-affinity ligands, but the mechanism underlying their enhanced T cell receptor (TCR) sensitivity is not fully understood. Here we show that murine thymocytes with low self-reactivity experience briefer TCR signals and complete positive selection more slowly than those with high self-reactivity. Additionally, we provide evidence that cells with low self-reactivity retain a preselection gene expression signature as they mature, including genes previously implicated in modulating TCR sensitivity and a novel group of ion channel genes. Our results imply that thymocytes with low self-reactivity downregulate TCR sensitivity more slowly during positive selection, and associate membrane ion channel expression with thymocyte self-reactivity and progress through positive selection.

Keywords: TCR; developmental biology; immunology; inflammation; ion channels; mouse; positive selection; self-reactivity; thymocyte.


Conflict of interest statement

LL, ZS, LM, SP, JK, AH, SA, AS, NY, ER No competing interests declared

Figures

Figure 1.
Figure 1.. TG6, F5, and OT-1 CD8SP cells express CD5 and Nur77 across the polyclonal spectrum.
CD8SP cells were harvested from the thymus and lymph nodes of wild-type (B6), TG6, F5, and OT-1 TCRtg mice and analyzed by flow cytometry. (a, b) Representative (left) and quantified by geometric mean fluorescence intensity (right) CD5 surface expression on (a) CD8SP thymocytes and (b) CD8SP lymph node cells. (c, d) Representative (left) and quantified (right) intracellular Nurr77 expression gated on (c) CD8SP thymocytes and (d) CD8SP lymph node cells. Data are presented as average ± SD and analyzed using an ordinary one-way ANOVA followed by a Tukey’s multiple comparisons (*p<0.05, **p<0.01, ***p<0.001, ****p<0.0001). All data are compiled from three or more experiments.
Figure 1—figure supplement 1.
Figure 1—figure supplement 1.. TG6 mice have efficient positive selection and allelic exclusion in the thymus.
Thymuses from B6xB6C (H2b/d), TG6 H2b/d Rag+/+, and TG6 H2b/d Rag−/− mice were harvested and analyzed via flow cytometry. (a) Total thymocyte numbers. (b) Representative flow plots and quantification of the percent of DP, CD4SP, and CD8SP thymocytes for the indicated genotypes. (c) Allelic exclusion measured by percent TCRβ and Vα2, Vβ8, or Vβ2 double-positive out of CD8SP thymocytes from the indicated genotypes. Data are compiled from two experiments.
Figure 2.
Figure 2.. TG6 thymocytes experience briefer TCR signals and a less pronounced signal-associated migratory pause compared to OT-1 during positive selection.
(a) Experimental schematic. Nonselecting slices were β2M−/− for OT-1 experiments and either B6 (H2b/b) or β2M−/− for TG6 experiments. (b) Individual tracks (one track = 1 cell; each track is a horizontal line) over time from TG6 (left) and OT-1 (right) representative runs (movies) 6 hr post-addition to the slice. Gray indicates low Ca2+ time points; black indicates high Ca2+ time points. (c, d) For each of the indicated conditions, multiple signaling cell tracks were aligned by the beginning of the signaling event (defined by the initial rise in Ca2+, time = 0), and the average calcium (Ca2+) ratio and speed at each time point relative to the beginning of the signaling event are displayed. Left and center panels show overlays of Ca2+ ratio and speed for each TCRtg, and right plots show overlay of Ca2+ ratio for both TCRtg for comparison. (c) Average Ca2+ ratio and speed 3 hr post-addition to the slice (TG6 n = 27 cells, OT-1 n = 37 cells). (d) Average Ca2+ ratio and speed 6 hr post-addition to the slice (TG6 n = 25 cells, OT-1 n = 23 cells). (e) Average speed of signaling (sig) portion and nonsignaling (nonsig) portion of all tracks containing at least one signaling event. An open symbol represents the nonsignaling portion, and the closed symbols represent the signaling portion of a single track and the lines connect data from the same track. (f) The pause index for each cell in (c) was calculated by subtracting the average speed of the signaling portion of a track from the average speed of the nonsignaling portion of the same cell track. All data are compiled from two or more experiments, except OT-1 3 hr data, which is from one experiment. Preselection thymocyte populations were obtained from TG6 Rag2−/− H2b mice and irradiated β2M−/− mice reconstituted with OT-1 Rag2−/− bone marrow. Data are presented as average ± SD and analyzed using (e) a two-way ANOVA with Sidak’s multiple comparisons or (f) a Student’s T-test (*p<0.05, **p<0.01, ****p<0.0001).
Figure 2—figure supplement 1.
Figure 2—figure supplement 1.. Percentage of signaling tracks and signaling time points in TG6 versus OT1 thymocytes at 3 and 6 hr post-addition to thymic slices.
(a) Percentage of signaling time points (high Ca2+ ratio) per track for the indicated conditions. Each dot represents a single cell. (b) The same data as in (a) but the percentage of signaling time points (high Ca2+ ratio) is out of total time points for each run, with each dot representing a single run. (c) Same data as in (a, b) but expressed as the percentage of signaling tracks (i.e. tracks with at least one signaling time point) out of total tracks for each run. Each dot represents an individual imaging run. All data are compiled from two or more experiments, except OT-1 3 hr data, which is from one experiment. Preselection thymocyte populations were obtained from TG6 Rag2−/− H2b mice and irradiated β2M−/− mice reconstituted with OT-1 Rag2−/− bone marrow. Data are presented as average ± SD. Data were analyzed using (a) a Kruskal–Wallis test with Dunn’s multiple comparisons (ns = not significant, *p<0.05, ****p<0.0001) or (b, c) an ordinary one-way ANOVA with Tukey’s multiple comparisons (ns = not significant, *p<0.05, **p<0.01, ***p<0.001).
Figure 2—figure supplement 2.
Figure 2—figure supplement 2.. TG6 thymocytes have a less pronounced pause while TCR signaling compared to OT-1 thymocytes.
Average instantaneous speed of signaling (sig.) and nonsignaling (nonsig.) time points for runs with at least one signaling track. In each column, a dot represents a single run. Between columns, lines connect data from the same run. All data are compiled from two or more experiments, except OT-1 3 hr data, which is from one experiment. Data are presented as average ± SD and analyzed using an ordinary two-way ANOVA with Sidak’s multiple comparisons (*p<0.05, **p<0.01).
Figure 3.
Figure 3.. Thymocytes with lower self-reactivity exhibit delayed in situ positive selection kinetics relative to those with high self-reactivity.
(a) Expression of CD5 on CXCR4−CCR7 + CD4 CD8+TG6 (96 hr), F5 (72 hr and 96 hr), and OT-1 (72 hr and 96 hr) donor cells developed in thymic slices. Values for each experiment are normalized to the average CD5 expression of the CXCR4−CCR7 + CD4 CD8+polyclonal slice resident (SR) population at the same time points. (b–d) Preselection TG6 (white bars, triangle), F5 (gray bars, square), or OT-1 (dark grey bars, circle) thymocytes were overlaid onto selecting or nonselecting thymic slices, harvested at 2, 24, 48, 72, or 96 hr post-thymocyte overlay, and analyzed using flow cytometry. Left three graphs show individual values for each transgenic. Horizontal lines in (a) and (b) indicate the average value for nonselecting slices. Right line graph shows the average for all three transgenics overlaid. (b) Percent of CD69+ cells within the CD4+CD8+ and CD4−CD8+populations. (c) Percentage of CXCR4−CCR7 + cells within CD4+CD8+ and CD4−CD8+populations. (d) Percentage of CXCR4−CCR7 + CD4 CD8+ cells out of the donor population. Values for each experiment are normalized to the average at the time point with the maximum CD8SP development (72 hr or 96 hr). For (a), data are presented as average ± SD and analyzed using an ordinary one-way ANOVA with Tukey’s multiple comparisons (****p<0.000). For (b–d), data are presented as average ± SD and analyzed using an ordinary one-way ANOVA with Dunnett’s multiple comparisons (**p<0.01, ***p<0.001, and ****p<0.0001) comparing to 2 hr time point. All data are compiled from three or more experiments. Preselection thymocyte populations were obtained from TG6tg Rag2−/− H2b mice, irradiated β2M−/− mice reconstituted with F5tg Rag1−/− bone marrow, and OT-1tg Rag2−/− β2M−/− mice. See also Figure 3—figure supplements 1 and 2.
Figure 3—figure supplement 1.
Figure 3—figure supplement 1.. TG6 thymocytes exhibit delayed development in thymic slices.
(a) Representative flow plots illustrating the gating strategy for thymic slice experiments. (b) Representative CD4 vs CD8 flow plots of TG6, F5, and OT-1 live donor thymocytes (bolded red gate in a). (c) CD4 vs CD8 representative flow plots for TG6, F5, and OT-1 live donor CXCR4-CCR7 + thymocytes (bolded blue gate in a). Bolded numbers within plots indicate the percentage of cells within a given gate.
Figure 3—figure supplement 2.
Figure 3—figure supplement 2.. TG6 thymocytes have delayed expression of positive selection markers in thymic slices.
Representative flow plots for TG6, F5, and OT-1 thymocytes developing in slices at the indicated time points post-addition to the slice (time point indicated above each column) for (a) CD69 expression and (b) CXCR4 and CCR7 expression. Numbers within plots indicate the percentage of cells within a given gate.
Figure 4.
Figure 4.. Mature thymocytes with lower self-reactivity appear later post-birth than those with higher self-reactivity.
Thymuses were harvested from TG6 (triangle, white bar), F5 (square, gray bar), or OT-1 (circle, black bar) transgenic neonatal mice at 7, 14, and 21 days post-birth and from adult mice (6–9 weeks old), and analyzed using flow cytometry. (a) Percentage of CD4−CD8+ cells. (b) Total number of CD4−CD8+ thymocytes at the indicated time point post-birth, relative to adult, for each transgenic. (c) Percentage of CXCR4−CCR7+ cells within CD4+CD8+ and CD4−CD8+ populations. Data are presented as average ± SD and analyzed using an ordinary one-way ANOVA, Dunnett’s multiple comparisons (*p<0.05, **p<0.01, and ****p<0.0001) comparing to adult. All data are compiled from three or more experiments.
Figure 4—figure supplement 1.
Figure 4—figure supplement 1.. T cells with lower self-reactivity appear later post-birth than those with higher self-reactivity in the spleen.
Total number of CD4−CD8+ splenocytes relative to adult for each transgenic. Data compiled from three or more experiments.
Figure 5.
Figure 5.. Thymocytes with lower self-reactivity have delayed development in steady state TCRtg and wild-type mice.
TG6, F5, or OT-1 (a–c) or B6 (d–f) mice were injected with two doses of 1 mg of EdU intraperitoneally (i.p.) at 0 and 4 hr post-injection (p.i.). (a) TCRtg experimental schematic. (b) EdU incorporation into TCRtg thymuses. (c) (Left three graphs) Percent CD8SP and DP thymocytes out of gated EdU+ cells at various days p.i. in TG6, F5, and OT-1 tg thymuses. (Right) The percent of EdU+CD8 SP relative to max within each experiment. Data are presented as the average within each transgenic and analyzed using an ordinary one-way ANOVA at each time point (*p<0.05, **p<0.01). Tukey’s multiple comparisons showed significant differences between OT-1 and TG6 at day 4 (**), day 5 (*), and day 6 (*); OT-1 and F5 at day 4 (*); and a difference between F5 vs TG6 at Day 6 (p=0.069). (d) B6 experimental schematic. (e) Representative gating strategy and histograms showing B6 day 10 p.i. CD5 expression on EdU+ and EdU− mature SP cells. (f) CD5 expression of EdU+TCRβ+CD8 SP and EdU+CD4 SP thymocytes at 4, 7, and 10 days p.i. CD5 expression shown relative to total TCRb+CD8 SP or CD4SP CD5 expression. In (f), data are presented as average ± SD and analyzed using an ordinary one-way ANOVA, Tukey’s multiple comparisons (*p<0.05, **p<0.01, ***p<0.001, ****p<0.0001). All data are compiled from three or more experiments.
Figure 5—figure supplement 1.
Figure 5—figure supplement 1.. CD5 expression does not change in TCRtg EdU+CD8 SP, regardless of day post-EdU injection.
CD5 gMFI of OT-1, F5, and TG6 EdU+CD8 SP thymocytes at the indicated time point post-EdU injection. Data is normalized to day 4 for OT-1 and F5, and to day 5 for TG6. CD5 gMFI is not significantly different within each transgenic regardless of the day post-injection. Data are presented as average ± SD and analyzed using an ordinary one-way ANOVA, Tukey’s multiple comparisons. All data are compiled from three or more experiments.
Figure 6.
Figure 6.. Thymocytes with low self-reactivity retain a preselection gene expression program marked by elevated expression of ion channel genes.
RNA-seq of OT-1, F5, and TG6 thymocytes at the early positive selection, late positive selection, and mature CD8SP stages. All samples have three biological replicates except for TG6 late positive selection, which has two biological replicates. (a, b) Gene set enrichment analysis (GSEA) was performed on all pairwise combinations of TCRtg samples, and the gene sets were filtered for enrichment in the order of self-reactivity (OT-1>F5>TG6) (a) or in the inverse order of self-reactivity (TG6>F5>OT-1) (b). Normalized enrichment scores (NES) are from the OT-1 vs TG6 (a) or TG6 vs OT-1 (b) comparison. Abbreviations: self-reactive (SR), ribonucleoprotein (RNP), nucleic acid (NA), transmembrane (TM). (c) Heatmap of differentially expressed (padj<0.05 for OT-1 vs TG6 comparison) ion channel genes (see Materials and methods) across all three stages and all three transgenic models. Gene expression values normalized by the DESeq2 variance stabilizing transformation were averaged over biological replicates and scaled per row. Heatmap is hierarchically clustered into four groups, numbered in the order of expression during development. Leading-edge genes from GSEA are in bold. (d) (Top) Plot of expression level in DP CD69− thymocytes versus fold difference for DN4 versus DP CD69− (left side of X-axis) or DP CD69− versus DP CD69+ (right side of X-axis) for ImmGen microarray data. The 11 genes chosen to represent the ‘preselection DP’ gene signature are indicated with red dots. (Bottom) Heatmap of normalized expression (as in (c)) of the 11 representative preselection DP genes in TG6, F5, and OT-1 thymocytes at the indicated stage of development.
Figure 6—figure supplement 1.
Figure 6—figure supplement 1.. Gene expression differences between TG6 and OT-1 thymocytes at different stages of development.
Plots of significance versus fold change for the OT-1 vs TG6 comparison at the early positive selection, late positive selection, and mature SP stages of development. The numbers in boxes denote the number of genes significantly upregulated for TG6 (upper left) and for OT-1 (upper right). Genes discussed in this study are indicated in color: green (ion channel genes), red (translation and ribosome genes), blue (T cell activation/effector function genes), purple (cell division genes), and orange (other). Other genes with very significant p-values and/or high fold change are labeled in gray.
Figure 6—figure supplement 2.
Figure 6—figure supplement 2.. Thymocytes with low self-reactivity retain a preselection gene expression program marked by elevated expression of ion channel genes.
(a) Ion channel genes from the manually curated list in Figure 6b that exhibit significantly different (padj<0.05, fold change>0.5) expression between OT1 versus TG6 thymocytes at the indicated stages of development. Positive values (green) indicate genes enriched in TG6; negative values (red) indicate genes enriched in OT-1. (b) Normalized read counts (see Materials and methods) for the indicated genes at each stage of development. Red circles: OT-1; blue squares: F5; green triangles: TG6. (c) (Left) Heatmap of normalized expression of the ion transport genes (Group 2 genes from Figure 6d) in wild thymocytes at the indicated stages of development (scaled per row). Data are from the ImmGen microarray database. (Bottom) Graphic representation of the average gene expression pattern. (d) Normalized enrichment score (NES) for the top 15 gene sets enriched in DP CD69− cells compared to DN4 and DP CD69+thymocytes, using gene set enrichment analysis (GSEA) and the Gene Ontology database. Black bars indicate gene sets relating to ion channels.
Figure 7.
Figure 7.. A model for temporal signal accumulation and gene expression changes during development in cells with relatively high and low self-reactivity.
(a) (Left) Positively selected cells with relatively high self-reactivity (SR) (solid, red lines) receive serial, brief (minutes) TCR signals, allowing for signal accumulation over a period of days, to eventually complete positive selection. (Right) Those with relatively low self-reactivity (dashed, green lines) experience even briefer TCR signals leading to slower signal accumulation and a longer time to achieve the cumulative TCR signaling threshold required for positive selection. (b) High (left) and low (right) self-reactive thymocytes have distinct temporal regulation of early (phase 1: blue lines) and a late (phase 2: purple lines) gene expression during positive selection. Elevated expression of phase one genes (including Themis, Scn4b, and Cacna1e) in preselection DP thymocytes may contribute to their high TCR sensitivity for self-ligands. We propose that phase 1 genes are downregulated more slowly in thymocytes with low self-reactivity, allowing them to retain high TCR sensitivity later into development, and aiding in signal accumulation from weak ligands. We also suggest that, later in positive selection, phase 2 genes (including Kcna2 and Tmie) are upregulated to a greater extent in thymocytes with low self-reactivity and could help to increase sensitivity to self-ligands late in development and in the periphery.
Author response image 1.
Author response image 1.. Average speed of nonsignaling (nonsig) timepoints in tracks with at least one signaling event.
Each dot represents a single track. Data are presented as average ± SD and analyzed using a Student’s T-test (****P<0.0001). All data are compiled from two or more experiments.

References

    1. Au-Yeung BB, Melichar HJ, Ross JO, Cheng DA, Zikherman J, Shokat KM, Robey EA, Weiss A. Quantitative and temporal requirements revealed for Zap70 catalytic activity during T cell development. Nature Immunology. 2014;15:687–694. doi: 10.1038/ni.2918. - DOI - PMC - PubMed
    1. Azzam HS, Grinberg A, Lui K, Shen H, Shores EW, Love PE. CD5 expression is developmentally regulated by T cell receptor (TCR) signals and TCR avidity. Journal of Experimental Medicine. 1998;188:2301–2311. doi: 10.1084/jem.188.12.2301. - DOI - PMC - PubMed
    1. Azzam HS, DeJarnette JB, Huang K, Emmons R, Park CS, Sommers CL, El-Khoury D, Shores EW, Love PE. Fine tuning of TCR signaling by CD5. The Journal of Immunology. 2001;166:5464–5472. doi: 10.4049/jimmunol.166.9.5464. - DOI - PubMed
    1. Barrett T, Wilhite SE, Ledoux P, Evangelista C, Kim IF, Tomashevsky M, Marshall KA, Phillippy KH, Sherman PM, Holko M, Yefanov A, Lee H, Zhang N, Robertson CL, Serova N, Davis S, Soboleva A. “NCBI GEO: Archive for Functional Genomics Data Sets - Update.”. Nucleic Acids Research. 2013;41:gks1193. doi: 10.1093/nar/gks1193. - DOI - PMC - PubMed
    1. Bhakta NR, Oh DY, Lewis RS. Calcium oscillations regulate thymocyte motility during positive selection in the three-dimensional thymic environment. Nature Immunology. 2005;6:143–151. doi: 10.1038/ni1161. - DOI - PubMed

Publication types

MeSH terms

Substances

Associated data