. 2024 Nov 27;15(1):10277.
doi: 10.1038/s41467-024-54385-w.

Vasculogenic skin reprogramming requires TET-mediated gene demethylation in fibroblasts for rescuing impaired perfusion in diabetes

Affiliations

Vasculogenic skin reprogramming requires TET-mediated gene demethylation in fibroblasts for rescuing impaired perfusion in diabetes

Sujit K Mohanty et al. Nat Commun. .

Abstract

Tissue nanotransfection (TNT) topically delivers Etv2, Foxc2, and Fli1 (EFF) plasmids increasing vasculogenic fibroblasts (VF) and promoting vascularization in ischemic murine skin. Human dermal fibroblasts respond to EFF nanoelectroporation with elevated expression of endothelial genes in vitro, which is linked to increased ten-eleven translocase 1/2/3 (TET) expression. Single cell RNA sequencing dependent validation of VF induction reveals a TET-dependent transcript signature. TNTEFF also induces TET expression in vivo, and fibroblast-specific EFF overexpression leads to VF-transition, with TET-activation correlating with higher 5-hydroxymethylcytosine (5-hmC) levels in VF. VF emergence requires TET-dependent demethylation of endothelial genes in vivo, enhancing VF abundance and restoring perfusion in diabetic ischemic limbs. TNTEFF improves perfusion and wound closure in diabetic mice, while increasing VF in cultured human skin explants. Suppressed in diabetes, TET1/2/3 play a critical role in TNT-mediated VF formation which supports de novo blood vessel development to rescue diabetic ischemic tissue.


Conflict of interest statement

Competing interests: The authors declare no competing interests.

Figures
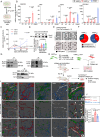
Fig. 1
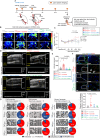
Fig. 1. The vasculogenic state of human adult dermal fibroblast is TET-dependent.
A Schematic diagram of ETV2, FLI1 and FOXC2 (EFF) plasmids delivery in HADF (HADFEFF) and empty plasmid (EP) control. Positive control = HMEC cells. B VEGFR2 [d0(n = 6, 6); d3(n = 6, 6); d5(n = 5, 5); d7(n = 6, 5); HMEC, n = 4)], VWF(d0, n = 6, 6; d3,n = 6, 4; d5,n = 8, 10; d7,n = 5, 5; HMEC, n = 4), CDH5(d0,n = 6, 6; d3,n = 6, 6; d5,n = 6, 8; d7,n = 5, 12; HMEC, n = 9), and PECAM1 (d0,n = 6, 6; d3,n = 5, 6; d5,n = 5, 5; d7,n = 5, 5; HMEC, n = 4) transcript abundance in HADFEFF and HADFEP treated cells at days 0, 3, 5, and 7 post-transfection. Results represent mean ± S.D (Student t test, two-sided). C TET1, TET2, and TET3 transcript abundance in EFF treated HADF cells at days 0 (n = 5, 6, 7), 3(n = 6, 6, 6), 5 (n = 6, 6, 10) and 7 (n = 8, 7, 10) post-transfection. Results represent mean ± S.D. One-way ANOVA, Tukey HSD post-hoc-test (D) Dot blot (top) and its intensity analysis (below) of 5-hydroxymethylcytosine (5-hmC) analyzed in EFF treated HADF cells at days 0, 3, 5, and 7 post-transfection. Results represent mean ± S.D (n = 3; Student t test, two-sided). E CDH5 promoter methylation status in HADFEP and HADFEFF treated HADF cells at d7. Clones analyzed = 6. F Venn diagram shows CDH5 methylation in HADFEP (Left) and HADFEFF (Right) at d7. G Co-immunoprecipitation experiments performed with anti-ETV2 and anti-TET1 (left) and TET2 (right) antibodies on HADF cells treated with Flag-ETV2. A different set of interaction was assessed using Flag-Fli1 transfected in HADF cells using antibodies against FLI1 and TET2. H Experimental design for in vivo collagen gel assay. I, J Immunofluorescence confocal images and analysis I of in vivo collagen gel assay showing more prevalence of lectin (white) perfused vessels of HADF (green) origin treated with EFF+scramble siRNA at day 28 as compared to EP + scramble. ECFC cells are shown in red. I Such perfused vessels were absent in EFF + TET1/2/3 siRNA group where HADF cells were treated with TET1/2/3-siRNA in presence of EFF. Scale, 50 µm. J The rightmost panel represents the colocalization of HADF-GFP, lectin, and ECFC-tdTomato in the 3D cross-sectional view rendered by IMARIS. Results represent mean ± S.D. (n = 7, 5, 6; one-way ANOVA, Tukey HSD post-hoc-test). Source data are provided as a Source Data file. n = biological replicates in (B, C, D, J). A, H are created in BioRender. Mohanty, S. (2024) BioRender.com/o24n391. indicates Supplementary Movie 1–3.
Fig. 2
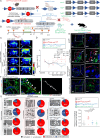
Fig. 2. Single-cell RNA sequencing analysis reveals TET-dependent gain of a vasculogenic cluster in dermal fibroblasts in response to Etv2, Foxc2 and Fli1 transfection.
A t-SNE plots for HADF cells at day 5 post EFF transfection in the presence or absence of TET1/2/3 siRNA. Parent HADF cells were used as d0 control. Unsupervised clustering identified 4 cell clusters (0, 1, 2, 3). The abundance of clusters 1 (P < 0.00001) and 3 (P < 0.00001) increased at d5 post-EFF transfection. Chi-Square test, two sided. Cluster 3 was identified as TET1-3 dependent cluster which was lost after treatment with TET1/2/3 siRNA. P < 0.00001, Chi-Square test, two sided. B Violin plots expression of pan-fibroblast markers representing clusters 1 and 3 retained their fibroblast gene signature (C) Intersection of DEG (log2FC ≥ 0.58, adj. p ≤ 0.01, Wilcoxon Rank Sum Test, two-sided) identified in individual clusters compared to others were illustrated in Venn diagram. D Differential connectome analysis using CellChat between fibroblast clusters post-EFF transfection in the presence or absence of TET1/2/3 siRNA. Diagram showing communication network where the blue indicates less while red indicates more signals between fibroblast clusters post-TET1/2/3 siRNA inhibition. Overall cell-cell communication between HADF clusters were diminished in EFF transfected HADFs post-TET1/2/3 siRNA inhibition as marked by the presence of more blue lines. E Degree of functional similarity of the contributing signaling pathways (weighted senders and receivers) or ligand-receptor pairs identified between fibroblast clusters post-EFF transfection in the presence or absence of TET1/2/3 siRNA. Due to the enrichment of VEGF, PDGF, and SEMA pathways Clusters 1 and 3 were identified as vasculogenic cluster out of which cluster 3 was TET1/2/3 siRNA dependent. F Dot plot representing different membrane receptors specific to identified clusters in (A). G Flow sorting of vasculogenic clusters (1 and 3; B2MhiCAVlo) and rest of other clusters (0 and 2; B2MloCAVhi). Results represent mean ± SD. (n = 3). P < 0.05 (oneway ANOVA, Tukey HSD post hoc test) (H) CDH5 and PECAM1 transcript abundance in B2MhiCAVlo and B2MloCAVhi sorted cells. Results represent mean ± SD. (n = 4). n = biological replicates in (G, H). Oneway ANOVA, Tukey HSD post hoc test. Source data are provided as a Source Data file.
Fig. 3
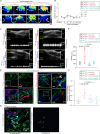
Fig. 3. TET-dependent vasculogenic state of fibroblasts require demethylation of fibroblast-borne endothelial genes in vivo.
A Study design showing TNT2.0 procedure and related vascular imaging in hind-limb ischemia model in C57BL/6 mice. Created in BioRender. Mohanty, S. (2024) BioRender.com/f78e778. Representative PeriMed laser speckle–assisted limb perfusion images (B) and quantification (C) of hind limb perfusion at different time points post-surgery in C57BL/6 mice treated with TNTEP+scramble, TNTEFF+scramble, TNTEFF+Tet1/2/3 shRNA or TNTscramble+Tet1/2/3 shRNA post hind-limb surgery (n = 7). *TNTEFF + scramble vs TNTEP+scramble; **TNTEP + scramble vs TNTEP + Tet1/2/3 shRNA, §TNTEFF + scramble vs TNTEFF + Tet1/2/3 shRN, #TNTEFF + scramble vs TNTEP + Tet1/2/3 shRNA (one-way ANOVA, Tukey HSD post-hoc-test). One-way ANOVA, followed by Tukey HSD post-hoc-test. Representative ultrasound and flow velocity images (D) and quantification (E) of flow velocity of hind limb in C57BL/6 mice treated with combinations mentioned in (B). (n = 7). Results represent mean ± S.D. One-way ANOVA, followed by Tukey HSD post-hoc-test. F Immunofluorescence images of hind-limb ischemic skin (left) and colocalization quantification (right) of COL1A2 (green) and VWF (red) staining of 4 groups in (B) determined by Pearson correlation coefficient (r). The white arrow represents the area of colocalization. Data expressed as mean ± S.D (n = 7, 7, 6, 6). One-way ANOVA, followed by Tukey HSD post-hoc-test. G Bisulfite sequencing analyses of endothelial specific gene [Cdh5 (left), Vwf (middle), and Pecam1 (right)] promoter methylation in laser capture microdissection (LCM) captured COL1A2+ elements at d14 hind-limb ischemic skin of C57BL/6 mice treated with combinations mentioned in (D) (methylated CpG, black; unmethylated CpG, white). Number of clones = 6. Venn diagram shows the distribution of methylated and unmethylated CpGs in promoter of each gene. AU, arbitrary unit. Source data are provided as a Source Data file.
Fig. 4
Fig. 4. Fibroblast-specific inducible overexpression of EFF causes induction of TET, which is followed by transition of fibroblast to vasculogenic fibroblast in vivo.
A pTARGATT-CAG-L4SL-Fli IRES-Etv2-T2A-Foxc2-PolyA was constructed for the generation of Foxc2, Etv2, and Fli1 knock-in (EFFfl/fl) mouse model. The EFFfl/fl mice were crossed with Col1a2CreER mice (EFFfl/flCol1a2CreER) to specifically induce EFF expression in Col1a2 expressing cells upon tamoxifen application. EFFfl/flCol1a2CreER mice were also crossed with Tet1/2/3fl/fl to generate EFFfl/flTet1/2/3fl/flCol1a2CreER mice. Additional mouse colony Tet1/2/3fl/fl Col1a2CreER was generated. Model characterization is provided in Figs S9, 10. B Schematic diagram of hind-limb experiment and vascular imaging in: (i) EFFfl/fl, (ii) EFFfl/flCol1a2CreER, (iii) EFFfl/flTet1/2/3fl/fl Col1a2CreER and (iv) Tet1/2/3fl/flCol1a2CreER. Tamoxifen treatment was done for 5 days post-surgery. Representative PeriMed laser speckle–assisted limb perfusion images (C) and quantification (D) of hind limb perfusion at different time points in abovementioned 4 groups (n = 8, 8, 4, 4). *EFFfl/flCOL1A2creER vs EFFfl/fl; §EFFfl/flCOL1A2creER vs EFFfl/flTet1/2/3fl/flCOL1A2creER; #EFFfl/flCOL1A2creER vs Tet1/2/3fl/flCOL1A2creER(one-way ANOVA, Tukey HSD post-hoc-test). E Immunofluorescence images of hind-limb ischemic skin (top) and colocalization quantification (bottom) of COL1A2 (green) and VWF (red) staining of the abovementioned groups (B) was determined by Pearson correlation coefficient (r). White arrow represents colocalization. Data expressed as mean ± S.D (n = 6, 7, 4, 4). (one-way ANOVA, Tukey HSD post-hoc-test). F Immunofluorescence image of day 14 hind limb ischemic tissue in EFFfl/flCOL1A2creER mice stained for COL1A2 and VWF. The left panel shows the 3D-reconstruction image of the colocalized COL1A2 and VWF rendered by IMARIS (inset). The middle panel shows the magnified inset. The right panel shows the colocalized area for COL1A2 and VWF. Scale, 30 µm. G Bisulfite sequencing analyses of endothelial specific gene {Cdh5 (left), Vwf (middle) and Pecam1 (right)} promoter methylation in LCM captured COL1A2+ elements for at d14 hind-limb ischemic skin of abovementioned (B) groups (methylated CpG, black; unmethylated CpG, white). Number of clones = 6. Venn diagram shows the distribution of methylated and unmethylated CpGs in promoter of each gene. AU, arbitrary unit. Source data are provided as a Source Data file. n = biological replicates in (D, E). A, B are created in BioRender. Mohanty, S. (2024) BioRender.com/e89c803.
Fig. 5
Fig. 5. TET-dependent demethylation of fibroblast-borne endothelial genes in dermal fibroblast causes the formation of vasculogenic fibroblast and rescues perfusion in diabetic ischemic limbs.
Representative PeriMed laser speckle–assisted limb perfusion images at d14 (A) and its quantification (B) of hind limb perfusion at different time points post-surgery in db/db mice treated with TNTEP+scramble, TNTEFF + scramble, TNTEFF + Tet1/2/3 shRNA and TNTEP + Tet1/2/3 shRNA post hind-limb surgery (n = 7). *TNTEFF + scramble vs TNTEP+scramble; §TNTEFF + scramble vs TNTEFF + Tet1/2/3 shRN, #TNTEFF + scramble vs TNTEP + Tet1/2/3 shRNA (one-way ANOVA, Tukey HSD post-hoc-test). One-way ANOVA, followed by Tukey HSD post-hoc-test). The study design and time points are similar to Fig. 3A. C Representative ultrasound and flow velocity images and quantification (D) of the flow velocity of the hind limb in db/db mice treated with combinations mentioned in (B) (n = 7, 6, 7, 6). One-way ANOVA, Tukey HSD post-hoc-test. Results represent mean ± S.D. E Immunofluorescence images of hind-limb ischemic skin and colocalization quantification (F) of COL1A2 (green) and VWF (red) staining of the abovementioned groups (B) were determined by Pearson correlation coefficient (r). The white arrow represents the area of colocalization. Data expressed as mean ± S.D (n = 6, 6, 7, 6). One-way ANOVA, Tukey HSD post-hoc-test). AU, arbitrary unit. G Immunofluorescence confocal image of day 14 hind limb ischemic tissue in TNTEFF+scramble db/db mice stained for COL1A2 and VWF. The left panel shows the 3D-reconstruction image of the colocalized COL1A2 and VWF rendered by IMARIS software (inset). The middle panel shows the magnified inset. The right panel shows the colocalized area for COL1A2 and VWF. Scale, 20 µm. Source data are provided as a Source Data file.

References

    1. Srivastava, D. & DeWitt, N. In vivo cellular reprogramming: the next generation. Cell166, 1386–1396 (2016). - PMC - PubMed
    1. Larouche, J. & Aguilar, C. A. New technologies to enhance in vivo reprogramming for regenerative medicine. Trends Biotechnol.37, 604–617 (2019). - PubMed
    1. Kelaini, S., Cochrane, A. & Margariti, A. Direct reprogramming of adult cells: avoiding the pluripotent state. Stem Cells Cloning7, 19–29 (2014). - PMC - PubMed
    1. Graf, T. & Enver, T. Forcing cells to change lineages. Nature462, 587–594 (2009). - PubMed
    1. Wingo, M. & Rafii, S. Endothelial reprogramming for vascular regeneration: past milestones and future directions. Semin. Cell Dev. Biol.122, 50–55 (2022). - PubMed

Publication types

MeSH terms