. 2021 Jun 18:10:e68662.
doi: 10.7554/eLife.68662.

Protective function and durability of mouse lymph node-resident memory CD8+ T cells

Affiliations

Protective function and durability of mouse lymph node-resident memory CD8+ T cells

Scott M Anthony et al. Elife. .

Abstract

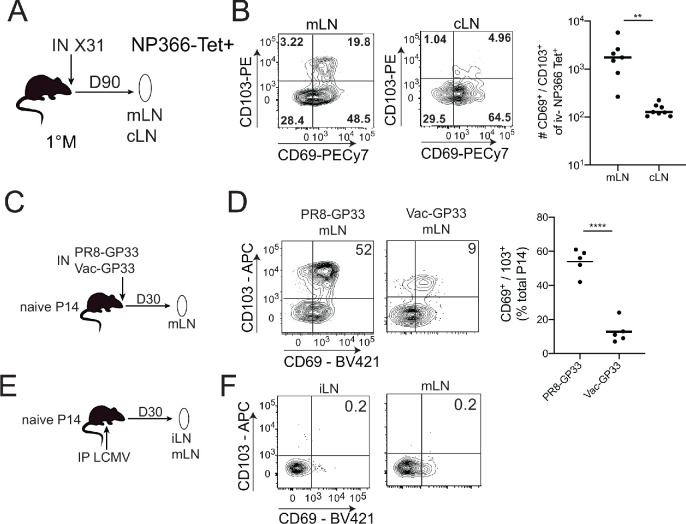
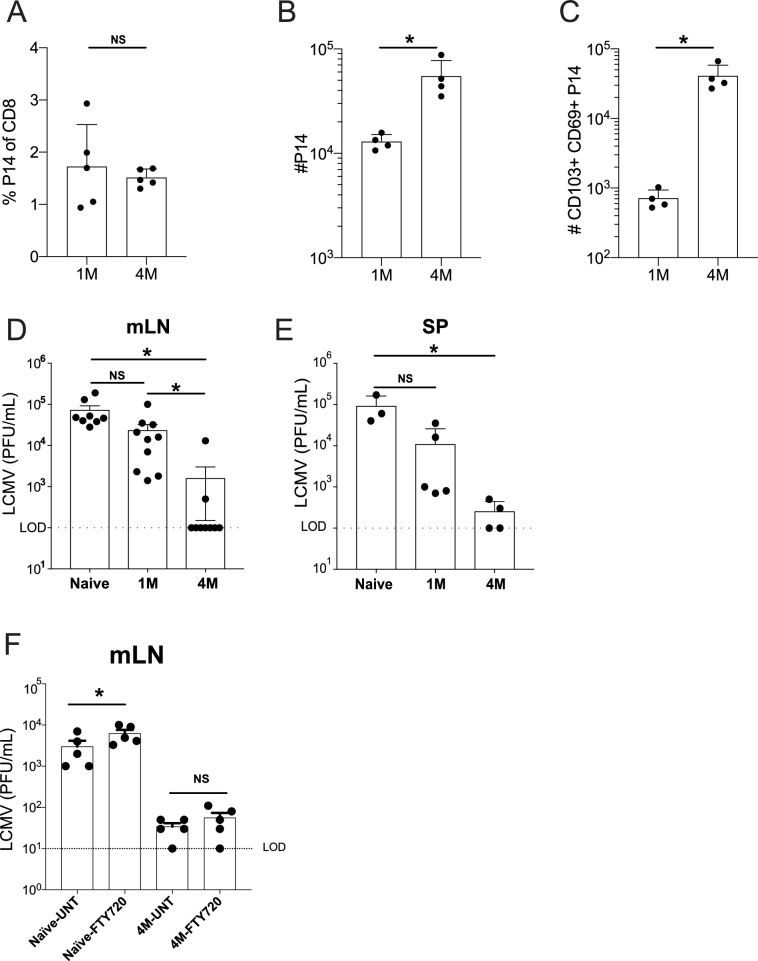
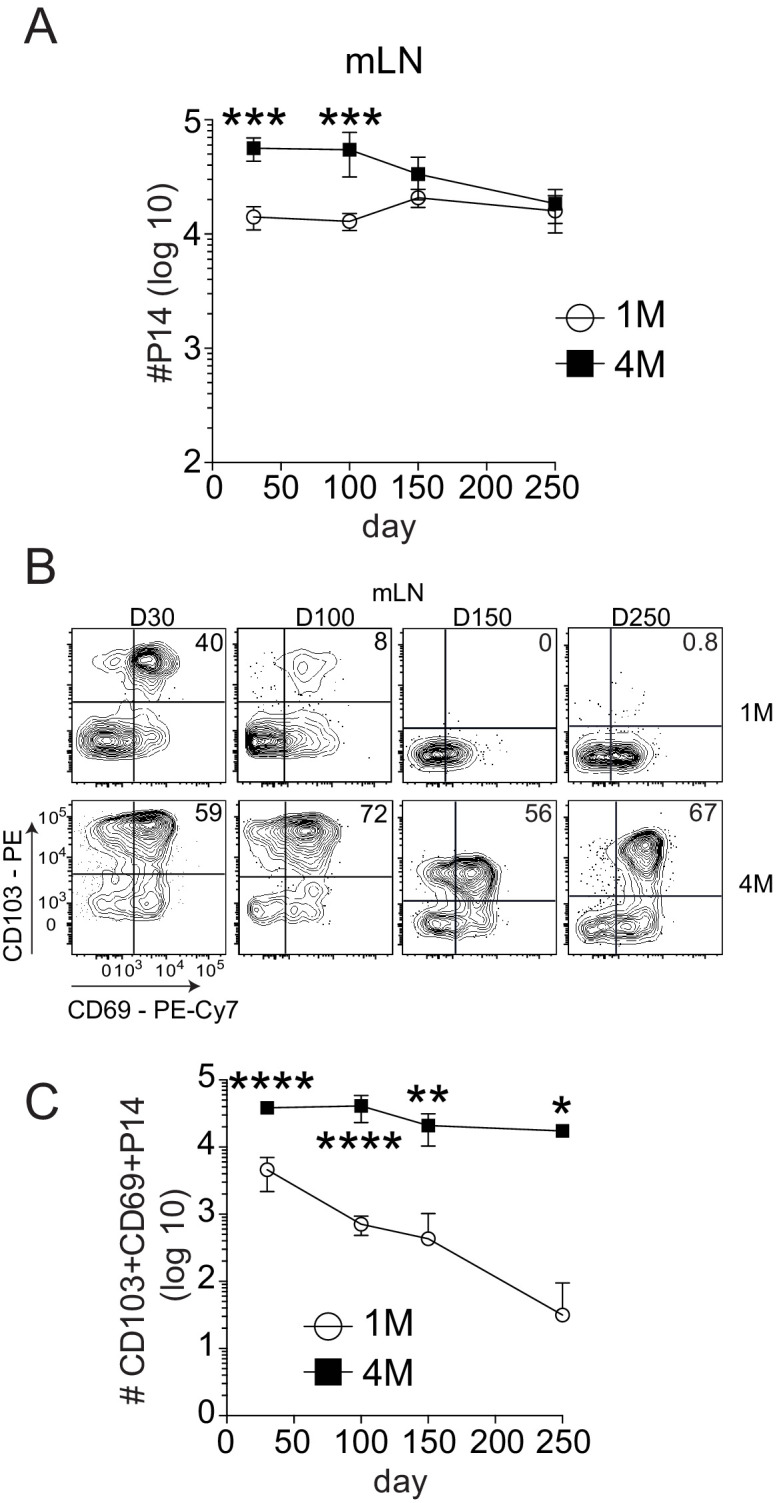
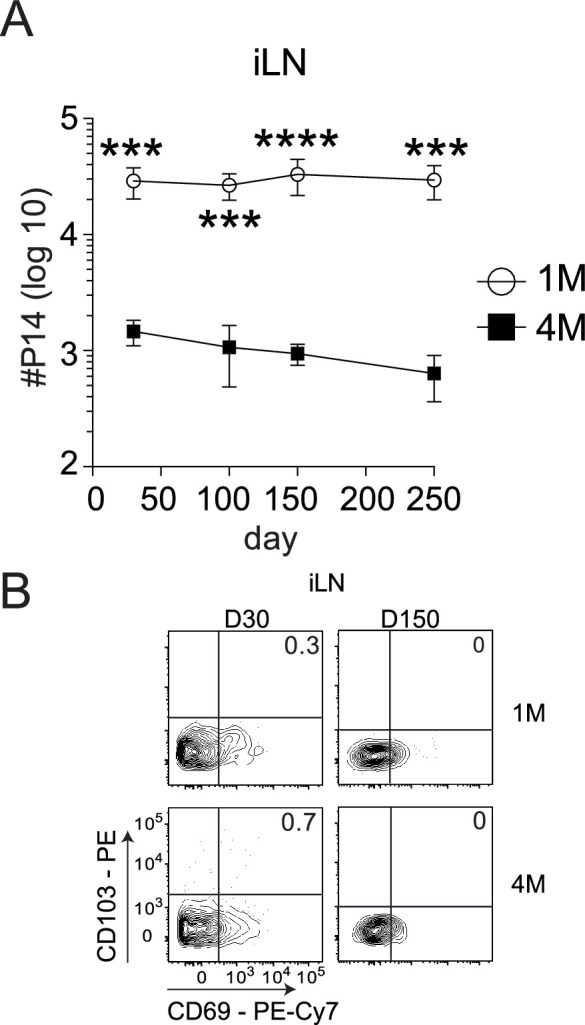
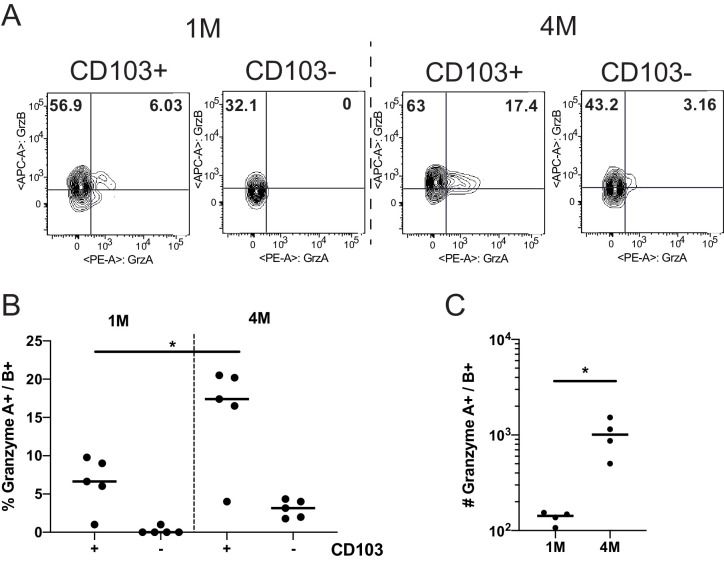
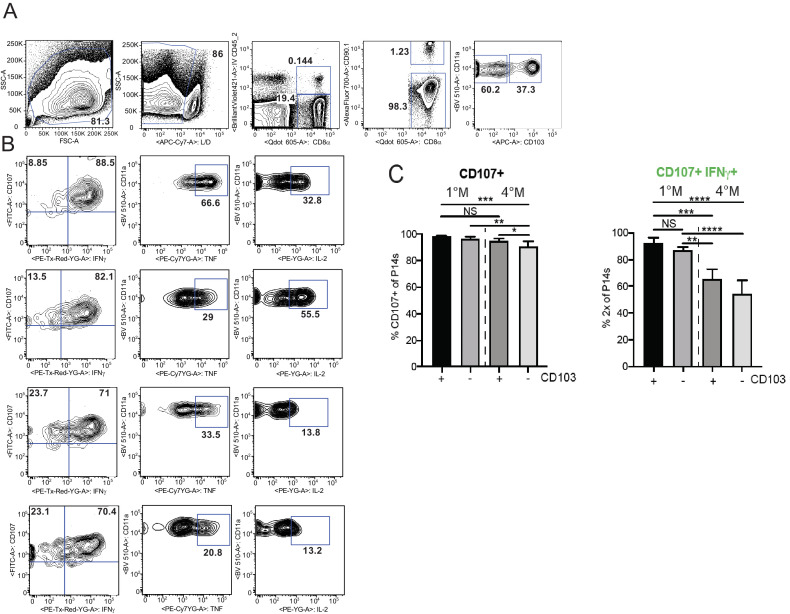
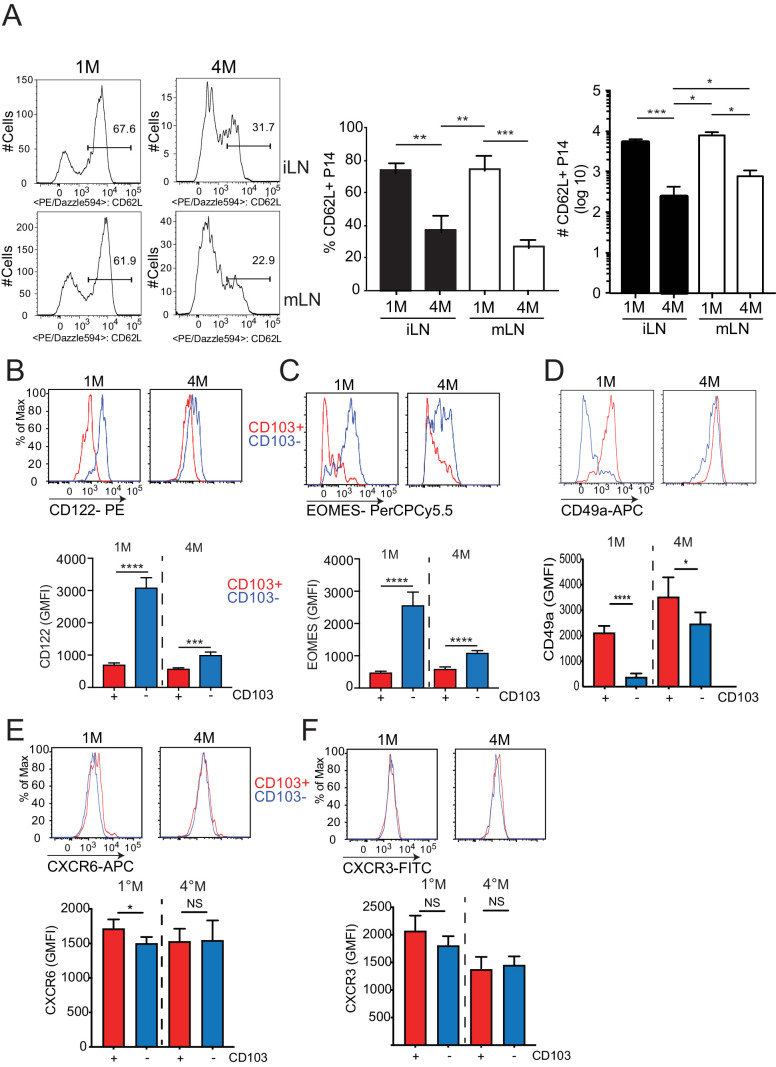
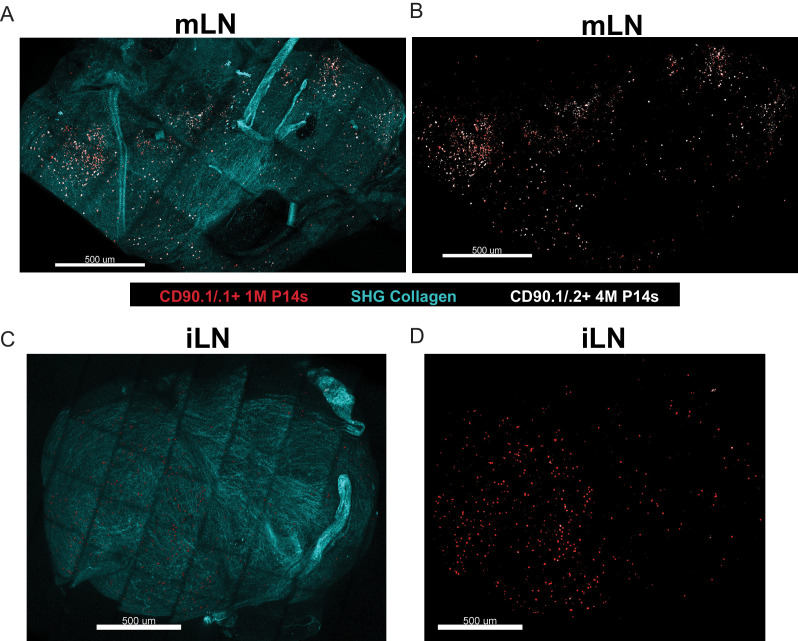
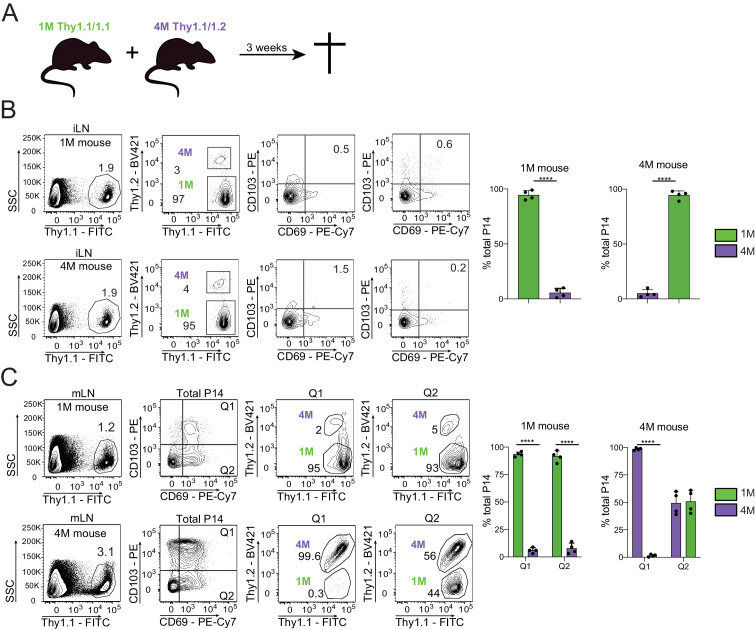
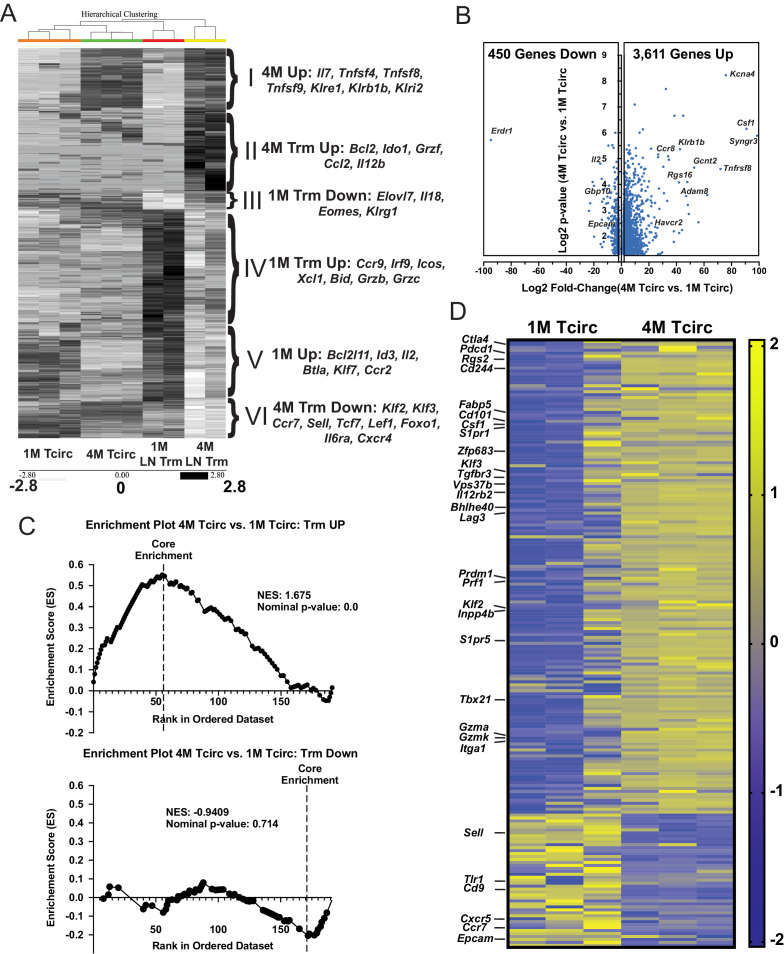
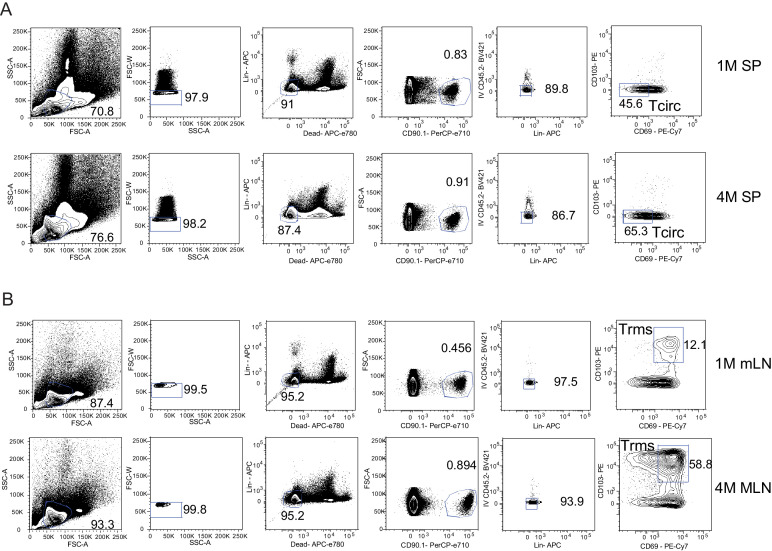
Protective lung tissue-resident memory CD8+T cells (Trm) form after influenza A virus (IAV) infection. We show that IAV infection of mice generates CD69+CD103+and other memory CD8+T cell populations in lung-draining mediastinal lymph nodes (mLNs) from circulating naive or memory CD8+T cells. Repeated antigen exposure, mimicking seasonal IAV infections, generates quaternary memory (4M) CD8+T cells that protect mLN from viral infection better than 1M CD8+T cells. Better protection by 4M CD8+T cells associates with enhanced granzyme A/B expression and stable maintenance of mLN CD69+CD103+4M CD8+T cells, vs the steady decline of CD69+CD103+1M CD8+T cells, paralleling the durability of protective CD69+CD103+4M vs 1M in the lung after IAV infection. Coordinated upregulation in canonical Trm-associated genes occurs in circulating 4M vs 1M populations without the enrichment of canonical downregulated Trm genes. Thus, repeated antigen exposure arms circulating memory CD8+T cells with enhanced capacity to form long-lived populations of Trm that enhance control of viral infections of the mLN.

Keywords: CD8+ T cell; CD8+ T cell resident memory; immunology; inflammation; lung; lymph node; mouse; repeated antigen exposure; virus infection.


Conflict of interest statement

SA, NV, SM, Sv, QS, RV, RS, SH, IJ, SV, NB, HX, VB, JH No competing interests declared

Figures

Figure 1.
Figure 1.. CD103+ memory CD8+ T cells are generated in draining lymph nodes (LNs) during localized but not systemic infections.
(A) C57BL/6 mice were infected IN with X31 (H3N2); mice were sacrificed 90 days post-infection; non-draining cervical lymph nodes (cLN) or lung-draining mediastinal lymph nodes (mLNs) were harvested and analyzed by flow cytometry. (B) Representative plots of % of CD69 and CD103 expression (left) in NP366 tetramer+ IV- memory CD8+ T cells from the cLN or mLN and cumulative data (right). n = 3–5 mice/group. Representative of three independent experiments. Bars denote mean values, dots represent independent mice. ****p<0.0001, Students t-test. (C) Mice were seeded with 104 naive P14 cells and infected IN with either PR8-GP33 (H1N1) or Vac-GP33. 30 days post-infection, draining mLNs were isolated and CD69+ CD103+ P14 Trm populations were evaluated (D). Representative plots (left), cumulative data (right). Representative of two independent experiments, n = 5 mice/group. Error bars represent mean ± SD. ****p<0.0001, Students t-test. (E) Mice were seeded with 104 naive P14 cells and infected IP with LCMV Armstrong. 30 days post-infection LNs (mLN and iLN) were isolated and evaluated for the frequency (F) of CD69+/CD103+ P14 s.
Figure 2.
Figure 2.. Lung-draining LN Trm cells mediate local protective immunity.
Mice were seeded with 104 naive or 105 3M P14 cells and IN infected with PR8-GP33 virus. At 50 days post-infection, frequency of 1M or 4M P14s were measured in the peripheral blood (A). At 100 days post-infection, mLNs were harvested and the numbers of total (B) and CD103+ CD69+ (C) P14s were determined. Representative of three independent experiments, n = 4–5 mice/group. Error bars represent mean ± SD, *p<0.05, **p<0.01, Students t-test in (A–C). LCMV challenge (D,E). Naïve, 1M, or 4M mice were infected with LCMV-Armstrong (2.0 × 10⁵ PFU/mouse i.p.); 72 hr post LCMV challenge, mLN (D) and SP (E) were harvested and individually evaluated for LCMV titers by plaque assay. FTY720 treatment impact on LCMV challenge (F). Naïve, 1M, or 4M mice were infected with LCMV-Armstrong (2.0 × 10⁵ PFU/mouse i.p.) and treated with vehicle or FTY720 daily for 72 hr. 72 hr post LCMV challenge, mLN (F) were harvested and individually evaluated for LCMV titers by plaque assay. Dotted line denotes limit of detection. One representative of 2–3 independent experiments is shown, n = 3–5 mice/group. Error bars represent mean ± SEM (G) or mean ± SD (H). NS = not significant, *p<0.05, one-way ANOVA.
Figure 3.
Figure 3.. Repeated antigen stimulation extends the survival of LN Trms.
Mice were seeded with 104 naive or 105 3M P14 cells and IN infected with PR8-GP33 virus. At indicated time points, mLN (A) was harvested and total numbers of 1M (white) and 4M (black) P14 cells were evaluated. Representative of three independent experiments, n = 4 mice/group/time point. Error bars represent mean ± SD. ***p<0.001, ****p<0.0001, two-way ANOVA with Sidak’s multiple comparison test. Representative plots (B) and cumulative results (C) of 1M and 4M CD69+ CD103+ P14 Trm cells in mLN evaluated at indicated time points. Representative of three independent experiments, n = 4 mice/group/time point. Error bars represent mean ± SD. *p<0.05, **p<0.01, ****p<0.0001, two-way ANOVA with Sidak’s multiple comparison test.
Figure 3—figure supplement 1.
Figure 3—figure supplement 1.. CD103+ LN Trm cells are not present within non-draining iLN.
Mice were seeded with 104naive P14 or 105 3M P14 cells and IN infected with PR8-GP33 virus. At indicated time points, iLN (A) were harvested and total numbers of 1M (white) and 4M (black) P14 cells were evaluated. Representative of three independent experiments, n = 4 mice/group/time point. Error bars represent mean ± SD. ***p<0.001, ****p<0.0001, two-way ANOVA with Sidak’s multiple comparison test. Representative plots of 1M and 4M CD69+ CD103+ P14 Trm cells in iLN (B) evaluated 30 and 150 days post-infection. Representative of three independent experiments, n = 4 mice/group/time point.
Figure 4.
Figure 4.. Repeated antigen stimulation increases granzyme production of LN Trms.
Mice were seeded with 104 naive or 105 3M P14 cells and IN infected with PR8-GP33 virus. At >60 days post-infection, mLNs were harvested, stimulated with cognate (GP33) peptide in the presence of BFA for 5 hr, and ICS was performed to evaluate the frequency of GrzA+ and GrzB+ fractions of IV CD103 or CD103+ 1M or 4M by flow cytometry. Representative flow plots (A), cumulative frequencies (B), and total numbers per mLN (C) are shown. Representative of two independent experiments, n = 4–5 mice/group. Error bars represent mean ± SD. *p<0.05, one-way ANOVA in (B), *p<0.05, Students t-test in (C).
Figure 4—figure supplement 1.
Figure 4—figure supplement 1.. Repeated influenza stimulation reduces cytokine production, but does not affect degranulation capacity of LN Trm cells.
Mice were seeded with 104naive P14 or 105 3M P14 cells and IN infected with PR8-GP33 virus. At 60 days post-infection, mLN and spleen were harvested and cells analyzed for peptide-stimulated cytokine production and degranulation. (A) Gating strategy for analysis of IV P14s. Single-cell suspensions were stimulated with cognate peptide (GP33) in the presence of BFA for 5 hr and ICS was performed to evaluate the frequency of CD107+, IFNγ+, TNF+, and IL-2+ fractions of IV CD103 or CD103+ 1M or 4M by flow cytometry. Representative flow plots of IFNg, TNF, and IL-2 (B), cumulative bar graphs denoting frequencies of CD107+ (C, left) and CD107+ IFNg+ (C, right) are displayed. Representative of two independent experiments, n = 4–5 mice/group. NS = not significant, *p<0.05, **p<0.01, ***p<0.001, ****p<0.0001; two-way ANOVA with Sidak’s multiple comparison test.
Figure 4—figure supplement 2.
Figure 4—figure supplement 2.. Repeated antigen stimulation alters the phenotype of LN Trm cells.
Mice were seeded with 104naive P14 or 105 3M P14 cells and IN infected with PR8-GP33 virus. At >90 days post-infection, iLN (top) and mLN (bottom) were harvested and the frequency of 1M and 4M P14 cells evaluated. (A) Representative data examining CD62L expression; cumulative frequency data (middle); cumulative total number data (right). Representative of three independent experiments, n = 4 mice/group. Error bars represent mean ± SD. ***p<0.001, ****p<0.0001 one-way ANOVA. At >75 days post-infection, mLN were harvested from 1M and 4M mice and the relative expressions of CD122 (B), Eomes (C), CD49a (D), CXCR6 (E), and CXCR3 (F) by CD103+ (red) or CD103 (blue) P14s were evaluated. Representative histograms (top) and cumulative data (bottom) are displayed. Representative of three independent experiments, n = 4–5 mice/group. Error bars represent mean ± SD. NS = not significant, *p<0.05, ****p<0.0001, one-way ANOVA.
Figure 5.
Figure 5.. Repeated antigen stimulation alters localization of LN Trm cells.
(A–D) Mice containing mixed congenically distinct populations of 1M (CD90.1/.1, seeded with 104 naive P14) and 4M (CD90.1/.2 seeded with 105 3M P14) P14s were injected with bolus IV administration of CD90.1-PE (red) and CD90.2-APC (white). Approximately 5 hr post-injection, organs were isolated and two-photon microscopy was performed on whole mLN (A–B) or iLN (C–D) explants ex vivo. The LN surrounding collagen capsule (pseudocolored blue) was captured with secondary harmonic generation (SHG). Representative of two independent experiments, n = 3–4 mice/group.
Figure 6.
Figure 6.. Residential nature of 1M and 4M LN Trm cells primed by influenza infection.
(A) 90 days after IN PR8-GP33 infection, mice bearing Thy1.1/1.1 1M P14 (green; 1M mice seeded with 104 naive P14) cells were joined by parabiotic surgery with mice bearing Thy1.1/1.2 4M P14 (purple, 4M mice seeded with 105 3M P14). Three weeks later parabionts were analyzed. (B) Abundance of 1M (green) and 4M (purple) P14 cells in iLNs of 1M (top row) and 4M (bottom row) parabiotic mice. Representative plots (left), cumulative data (right). Representative of two independent experiments, n = 4 parabionts/experiment. Error bars represent mean ± SD. ****p<0.0001, t-test. (C) Abundance and distribution of 1M (green) and 4M (purple) Trm P14 cells expressed as a % of the total Trm population (CD69+/CD103+) in mLN of 1M (top row) and 4M (bottom row) parabiotic mice. Representative plots (left), cumulative data (right). Representative of two independent experiments, n = 4 parabionts/experiment. Error bars represent mean ± SD. Two-way ANOVA with Sidak’s multiple comparison test. Q1(1M) vs Q1(4M) ****p<0.0001; Q2(1M) vs Q2(4M) ****p<0.0001; Q1(1M) vs Q1(4M) ****p<0.0001.
Figure 7.
Figure 7.. Splenic 4M cells express a core Trm signature.
Mice were seeded with 104 naive P14 or 105 3M P14 cells and IN infected with PR8-GP33 virus. At 22–30 days post-infection, IV exclusion was performed and negatively enriched pooled groups of spleens (3–5 spleens/sample, n = 3) or mLNs (15–25 mLNs/sample, n = 2) were stained for CD8α, CD90.1, CD69, and CD103. Bulk RNAseq was performed on RNA from sort-purified spleen samples (20k IV, CD69/CD103 cells/sample) or mLN Trm samples (2–5k IV CD69+/CD103+ cells/sample). (A) Heatmaps of 1300 most differentially expressed genes (log2FC > 1.5, p<0.05) between 1M and 4M LN Trms are plotted from the four respective groups of samples. The six core signature sets of genes offset to the right were derived from unbiased hierarchical clustering. (B) Volcano plot of 4061 differentially expressed genes between 1M and 4M splenic memory P14 cells (log2FC > 1.5, p<0.05). (C) GSEA of core Trm genes defined in Table 2 from splenic 1M and 4M populations separated into respective upregulated (top) and downregulated (bottom) gene sets in regard to annotated expression in Trms. (D) Heatmap of a core set of selected Trm genes (as in C) within 1M and 4M splenic populations.
Figure 7—figure supplement 1.
Figure 7—figure supplement 1.. Gating strategy of FACS for RNAseq.
Mice were seeded with 104 naive P14 or 105 3M P14 cells and IN infected with PR8-GP33 virus. At 23–30 days post-infection, mLN and spleen were pooled, harvested, negatively enriched, and sorted for bulk RNAseq. (A) Gating strategy for analysis of 1M or 4M splenic IV Tcirc P14s. (B) Gating strategy for analysis of 1M or 4M IV mLN Trm P14s.

References

    1. Beura LK, Wijeyesinghe S, Thompson EA, Macchietto MG, Rosato PC, Pierson MJ, Schenkel JM, Mitchell JS, Vezys V, Fife BT, Shen S, Masopust D. T Cells in Nonlymphoid Tissues Give Rise to Lymph-Node-Resident Memory T Cells. Immunity. 2018;48:e325–e338. doi: 10.1016/j.immuni.2018.01.015. - DOI - PMC - PubMed
    1. Cheuk S, Schlums H, Gallais Sérézal I, Martini E, Chiang SC, Marquardt N, Gibbs A, Detlofsson E, Introini A, Forkel M, Höög C, Tjernlund A, Michaëlsson J, Folkersen L, Mjösberg J, Blomqvist L, Ehrström M, Ståhle M, Bryceson YT, Eidsmo L. CD49a Expression Defines Tissue-Resident CD8 + T Cells Poised for Cytotoxic Function in Human Skin. Immunity. 2017;46:287–300. doi: 10.1016/j.immuni.2017.01.009. - DOI - PMC - PubMed
    1. Danahy DB, Berton RR, Badovinac VP. Cutting Edge: Antitumor Immunity by Pathogen-Specific CD8 T Cells in the Absence of Cognate Antigen Recognition. The Journal of Immunology. 2020;204:1431–1435. doi: 10.4049/jimmunol.1901172. - DOI - PMC - PubMed
    1. Dobin A, Davis CA, Schlesinger F, Drenkow J, Zaleski C, Jha S, Batut P, Chaisson M, Gingeras TR. STAR: ultrafast universal RNA-seq aligner. Bioinformatics. 2013;29:15–21. doi: 10.1093/bioinformatics/bts635. - DOI - PMC - PubMed
    1. Flynn KJ, Riberdy JM, Christensen JP, Altman JD, Doherty PC. In vivo proliferation of naive and memory influenza-specific CD8+ T cells. PNAS. 1999;96:8597–8602. doi: 10.1073/pnas.96.15.8597. - DOI - PMC - PubMed

Publication types

Associated data