. 2024 Dec 30;15(1):10803.
doi: 10.1038/s41467-024-55054-8.

DDX18 coordinates nucleolus phase separation and nuclear organization to control the pluripotency of human embryonic stem cells

Affiliations

DDX18 coordinates nucleolus phase separation and nuclear organization to control the pluripotency of human embryonic stem cells

Xianle Shi et al. Nat Commun. .

Abstract

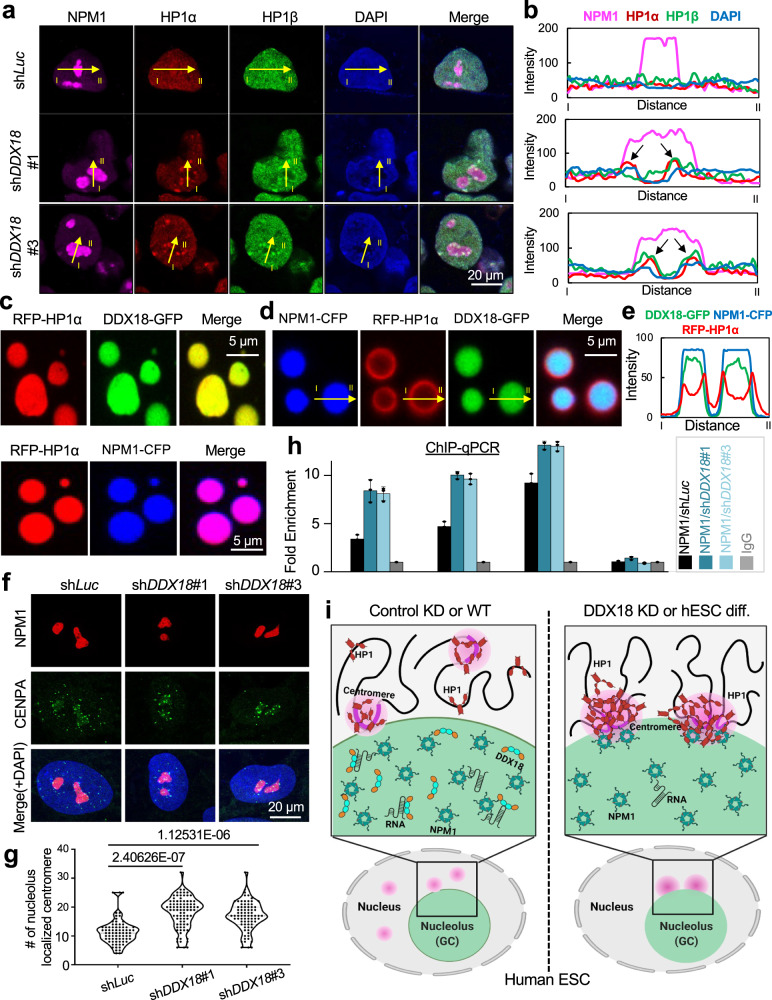
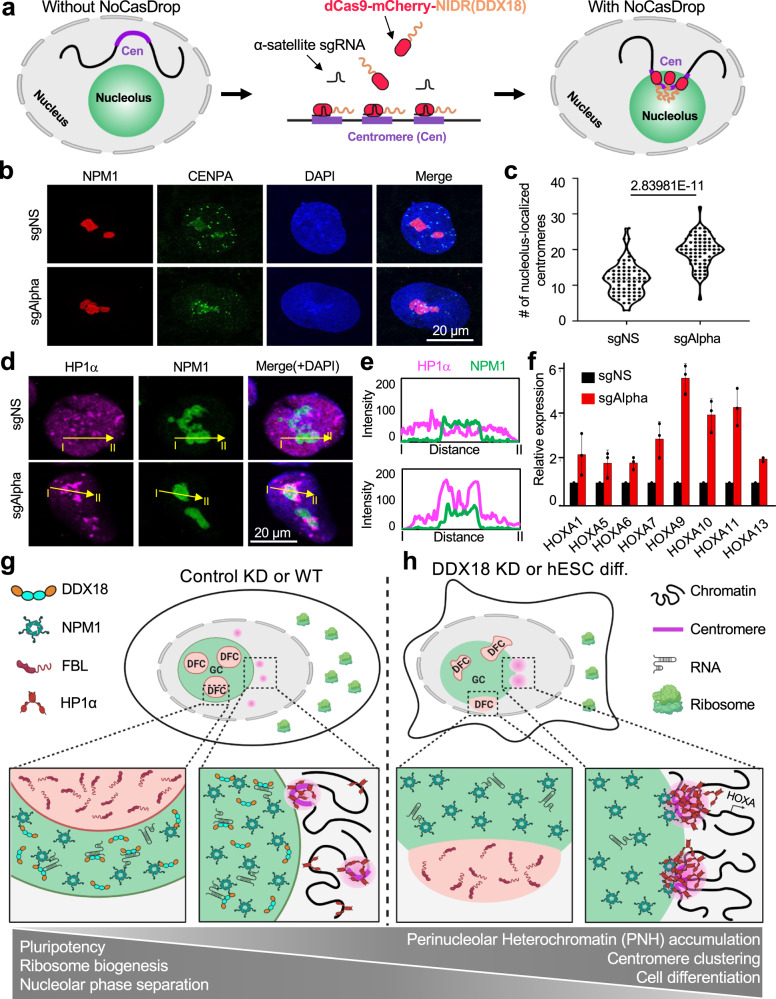
Pluripotent stem cells possess a unique nuclear architecture characterized by a larger nucleus and more open chromatin, which underpins their ability to self-renew and differentiate. Here, we show that the nucleolus-specific RNA helicase DDX18 is essential for maintaining the pluripotency of human embryonic stem cells. Using techniques such as Hi-C, DNA/RNA-FISH, and biomolecular condensate analysis, we demonstrate that DDX18 regulates nucleolus phase separation and nuclear organization by interacting with NPM1 in the granular nucleolar component, driven by specific nucleolar RNAs. Loss of DDX18 disrupts nucleolar substructures, impairing centromere clustering and perinucleolar heterochromatin (PNH) formation. To probe this further, we develop NoCasDrop, a tool enabling precise nucleolar targeting and controlled liquid condensation, which restores centromere clustering and PNH integrity while modulating developmental gene expression. This study reveals how nucleolar phase separation dynamics govern chromatin organization and cell fate, offering fresh insights into the molecular regulation of stem cell pluripotency.


Conflict of interest statement

Competing interests: The authors declare no competing interests.

Figures

Fig. 1
Fig. 1. DDX18 is required for hESC maintenance.
a Western blot analysis of pluripotency and lineage-specific transcription factors in control (shLuc) and DDX18 knockdown (KD) cells with two independent shRNAs (shDDX18#1 and shDDX18#3). β-Actin was used as the loading control. The experiment was repeated independently 3 times with similar results. b Quantitative RT–PCR analysis of pluripotency genes and differentiation genes. Bars represent the average of three independent experiments. T is also known as Brachyury. c Flow cytometric analysis of the pluripotency-related surface markers SSEA-4 and TRA-1-60. Data represent three replicates of two independent shRNAs. d Alkaline phosphatase (AP) staining of control and DDX18 KD cells. Biological replicates were performed using two shRNAs targeting DDX18. e Volcano plot showing dysregulated genes in DDX18 KD cells by RNA-seq. The green dots denote downregulated genes in DDX18 KD samples (log2 [fold change] <−1, p < 0.05); red dots denote upregulated genes in DDX18 KD samples (log2 [fold change] >1, p < 0.05). Biological replicates from two hESC lines were analyzed. The p-value was calculated with edgeR. f Gene Ontology analysis of the downregulated and upregulated genes in DDX18 KD cells relative to control cells. The most significantly enriched biological processes GO terms with p values are plotted. The p values were calculated using the DAVID bioinformatics resource system. g Geneset enrichment analysis (GSEA) for the terms “Cytoplasmic translation”, “Ribosome biogenesis”, and “Embryonic organ development” in DDX18 KD hESCs. P value was calculated using the GSEA web tool. h IGV track showing HOXA cluster genes are upregulated upon DDX18 KD. i SUnSET assay measuring relative puromycin levels incorporated into proteins during translation in DDX18 KD and controls human ESCs, indicated by the anti-puromycin western blot. The Coomassie blue staining gel and the Vinculin blot are the loading controls. WT and mutant DDX18 protein levels under KD and rescue conditions are also indicated. The experiment was repeated independently twice with similar results. Source data are provided as a Source Data file.
Fig. 2
Fig. 2. DDX18 undergoes phase separation in vitro and in vivo.
a Schematic depiction of a eukaryotic cell with representative nuclear and nucleolus structures. FC (fibrillar center), DFC (dense fibrillar component), GC (granular component). (Created in BioRender. Malik, V. (2025) https://BioRender.com/v27l155). b Representative hESC SIM images showing the localization of DDX18 relative to DFC (FBL) and GC (NPM1). The experiment was repeated independently twice with similar results. c Representative images of liquid-like droplets formed with various NaCl concentrations (A’-F’), visualized by GFP emission of DDX18-GFP. DDX18-GFP is 5 µM. The experiment was repeated independently twice with similar results. d Phase diagrams for LLPS of DDX18 under different concentrations of protein and NaCl determined by turbidity assays. DDX18 concentrations spans from 0.5 µM to 20 µM, and NaCl from 50 mM to 300 mM. Representative images from series A’ to F’ are shown in (c). e Schematic diagram for the DDX18 C-terminal GFP fusion reporter knock-in allele. f Time-lapse images showing the fusion and fission of DDX18-GFP within the nucleolus. g Quantification of FRAP data for DDX18-GFP signal. The bleaching event occurs at t = 0 s. DDX18-GFP exhibits fast dynamics with nearly complete recovery (>90%) on a timescale of τ = 104 ± 8 s. Data represent three independent experiments and are presented as mean values ± SD. h Representative images of liquid-like droplets formed by fusion proteins containing 10 µM DDX18 full-length (FL), N-terminal IDR deletion (∆NIDR), C-terminal IDR deletion (∆CIDR), and combined N-terminal/C-terminal IDR deletion (∆IDR) detected by GFP (top, in vitro) in 150 mM NaCl, 25 mM Tris-HCl, pH 8.0; anti-Flag immunostaining (middle, in vivo), and the merged images (bottom, in vivo) showing 3xFlag-DDX18 (red), FBL(green) and DAPI (blue) in human ESCs. The experiment was repeated independently twice with similar results. i Phase diagrams for LLPS of DDX18 full-length and truncated mutants (∆NIDR, ∆CIDR, ∆IDR) under various concentrations of proteins (0.5 µM to 20 µM) in the presence of 150 mM NaCl, 25 mM Tris-HCl, pH 8.0 by turbidity assays. Source data are provided as a Source Data file.
Fig. 3
Fig. 3. DDX18 interacts with nucleolar RNAs and GC component proteins.
a Summary of the DDX18 interactome showing representative GO terms and corresponding proteins. Nucleolar GC marker proteins NPM1 and NCL are also shown under rRNA processing. b RNA-dependent interactions between DDX18 and NPM1. Western blotting detection of DDX18 and NPM1 protein levels after Flag-IP with and without RNase A treatment. IgG serves as the negative control IP. The experiment was repeated independently twice with similar results. c Representative live imaging of reconstituted BiFC fluorescence. Green fluorescence shows the reconstitution of YFP as an indicator of the protein-protein interaction between DDX18 and NPM1. The experiment was repeated independently twice with similar results. d Relative enrichment of different RNA species identified from DDX18 iCLIP-seq. e HOMER motif analysis of DDX18 iCLIP-seq showing the top consensus sequences. The conserved motif of the C/D box snoRNAs is shown at the top. P value was calculated by HOMER. f GO analysis of biological processes for DDX18 bound mRNAs. Source data are provided as a Source Data file.
Fig. 4
Fig. 4. Architecture of the nucleolus arises through multiphase liquid miscibility and immiscibility of DDX18 with NPM1 and FBL, respectively.
a, b Biophysical properties of the mixtures of purified DDX18-GFP (20 μM) and NPM1-RFP (10 μM) recombinant proteins in vitro in a buffer comprised of 150 mM NaCl, 25 mM Tris-HCl, pH 8.0. Adding NPM1-RFP solution without PEG (i.e., no droplets formed) to the preformed DDX18 (a) established droplets with “core-shell” like structure, imaged with RFP, GFP, and merging RFP/GFP (b). The experiment was repeated independently twice with similar results. c Biophysical properties of the mixtures of purified DDX18-GFP (20 μM), NPM1-CFP (10 μM), and RFP-FBL (20 μM) with or without rRNA/snoRNA in a buffer comprised of 150 mM NaCl, 25 mM Tris-HCl, pH 8.0, detected by GFP, CFP, and RFP, respectively. Merged images and quantification of the formation of indicated core-shell structures are shown, where the percentages reflect the proportion of fields of view exhibiting the core-shell structures. The experiment was repeated independently twice with similar results. d Images of normal (shLuc) and disrupted (shDDX18#1) nucleolar condensate organization. FBL labels the dense fibrillar component (DFC); NPM1 labels the granular component (GC). The experiment was repeated independently twice with similar results. e Quantification of immunostaining images from control and KD cells (shDDX18#1 and shDDX18#3) showing the percentage of inclusive DFC localized cells (represented by the top part of panel d) or exclusive DFC localized cells (represented by the bottom part of (d). Quantifications were performed using 152 cells from shLuc, 211 cells from shDDX18#1, and 202 cells from shDDX18#3, based on three technical replicate cultures. Data are presented as mean values ± SD. f A proposed model showing that DDX18 coordinates with NPM1 to safeguard nucleolus organization. (Created in BioRender. Malik, V. (2025) https://BioRender.com/v27l155). Source data are provided as a Source Data file.
Fig. 5
Fig. 5. DDX18 KD disrupts nucleolar structure leading to perinucleolar heterochromatin organization.
a, b DDX18 depletion leads to perinucleolar heterochromatin organization in hESCs. Representative images of immunostaining for nucleolar NPM1, nucleolus-associated heterochromatin markers HP1α and HP1β, nuclear DAPI, and their merge are shown (a). The yellow arrows, labeled from I to II, indicate the direction of ImageJ immunofluorescence signal quantification shown as line charts (b). Black arrows indicate that HP1α and HP1β can dock at or enter the nucleolus when DDX18 is depleted. The experiment was repeated independently twice with similar results. c Images of the mixtures of purified recombinant proteins DDX18-GFP (10 μM) and RFP-HP1α (40 μM) (top) and NPM1-CFP (10 μM) and RFP-HP1α (40 μM) (bottom) in a buffer comprised of 150 mM NaCl, 25 mM Tris-HCl, pH 8.0 and 5% PEG8000, detected by respective reporters. The experiment was repeated independently twice with similar results. d, e Images of the mixtures of purified DDX18-GFP (10 μM), NPM1-CFP (10 μM), and RFP-HP1α (40 μM) in a buffer comprised of 150 mM NaCl, 25 mM Tris-HCl, pH 8.0 and 5% PEG8000, detected by respective reporters under immunofluorescence microscope (d) and the line chart showing the ImageJ quantified intensity of NPM1-CFP, RFP-HP1α and DDX18-GFP fluorescence signals (e) along the direction indicated in (d). The experiment was repeated independently twice with similar results. f, g DDX18 KD results in centromere clustering around the nucleolus. Representative images for nucleolus (NPM1, red), centromeres (CENPA, green), and DNA (DAPI, blue) (f) quantification of the number of nucleolus-localized centromeres under control and DDX18 KD conditions (g) are shown. Each dot in g represents one cell. ***P < 0.001 (The P-values were calculated using a two-sided t-test and indicated). h ChIP-qPCR analysis of NPM1 genomic occupancy at the centromere locus in control (shLuc) and DDX18 KD (shDDX18#1, shDDX18#3) hESCs. Data are mean±SD of three independent experiments. Chromosome Y serves as a negative control for female H9 hESCs. IgG serves as the ChIP negative control. i A proposed model showing that DDX18 restricts centromere from clustering heterochromatin organization around the nucleolus. (Created in BioRender. Malik, V. (2025) https://BioRender.com/v27l155). Source data are provided as a Source Data file.
Fig. 6
Fig. 6. DDX18 depletion results in chromatin reorganization.
a, b Hi-C interaction heatmaps (a) and schematic diagram (b) depicting increased chromatin interactions at Chr21 region R1 (I↔III) and R2 (II↔III) in DDX18 KD vs. control KD hESCs. c A proposed model. See the main text for a detailed explanation. d Boxplots showing the change in the strength of significant interactions (the numbers of interactions are indicated) upon DDX18 KD categorized by chromosome arms. The edges of the box represent the 25th and 75th percentile, while the line in the middle of the box is the median. The whiskers extend from the box edges to 1.5 times the interquartile range. e Heatmap showing log10(ratio) of mean normalized interchromosomal contacts per 250-kb bin in DDX18 KD vs. control KD hESCs. Acrocentric chromosomes are highlighted in black boxes. f Illustration of the contact domains and chromatin loops for a 3 Mbp region of chromosome 7p containing HOXA cluster genes from Hi-C data with the epigenetic modifications of the HOXA cluster from public datasets shown. Circles on the matrix denote increased interaction frequency of the HOXA cluster genes with nearby genes in DDX18 KD vs. control KD hESCs. g, h Quantification (g) and representative DNA FISH images (h) of the control and DDX18 KD cells for HOXA9-13 alleles (red) compared with nucleolar (NPM1, green) and nucleoplasm (DAPI, blue). The total numbers (n) of nuclei from two independent experiments were scored. i, j Representative confocal microscopy merged images of RNA-FISH detecting HOXA9 (i) and HOXA11 (j) mRNAs in control and DDX18 KD H9 hESCs. Dotted circles indicate nucleoli detected by Nucleolus Bright Green Dye reaction to predominantly nucleolar and cytoplasmic RNAs. k, l Quantification of HOXA9 (k) and HOXA11 (l) mRNAs RNA-FISH signals at nucleolar (NAD) and nuclear periphery (LAD) proximities in control and DDX18 KD hESCs (representative cells are shown in i, j). RNA-FISH signals outside the nuclear periphery were not counted. Equal numbers of shLuc and shDDX18 cells (N = 39 for HOXA9 and N = 30 for HOXA11), randomly selected from three independent experiments, were analyzed for signal quantifications (mean ± SD). All cells were counterstained with DAPI. The red and green arrows indicate the increase and decrease trends, respectively. Source data are provided as a Source Data file.
Fig. 7
Fig. 7. NoCasDrop of DDX18 restructures the genome positioning and controls gene expression.
a Schematic diagram of NoCasDrop (Nucleolus CasDrop). Repetitive loci such as centromeres can be tethered by α-satellite specific sgRNA and dCas9-mCherry-NIDR (DDX18) to nucleolus hub in vivo. (Created in BioRender. Malik, V. (2025) https://BioRender.com/v27l155). b, c Alpha (α)-satellite sgRNAs (sgAlpha) and NoCasDrop recruit centromere to the nucleolus. Representative images for nucleolus (NPM1, red), centromeres (CENPA, green), and nucleus (DAPI, blue), as well as merged images (b) and quantification of the number of centromere foci around nucleolus from more than 50 cells (c) are shown. Each dot in c represents one cell. ***P < 0.001 (The P-value was calculated using a two-sided t-test). sgNS acts as a non-specific sgRNA control. d, e NoCasDrop with sgAlpha recruits perinucleolar heterochromatin (HP1α, magenta) at the nucleolus (NPM1, green) in hESCs. Representative images of immunostaining for nucleolar NPM1, nucleolus-associated heterochromatin markers HP1α and HP1β, nuclear DAPI, and their merge are shown (d). The yellow arrows, labeled from I to II, indicate the direction of ImageJ immunofluorescence signal quantification, as shown in line charts (e). The experiment was repeated independently twice with similar results. f qRT-PCR analysis of HOXA cluster genes upon sgAlpha and NoCasDrop treatment. sgNS acts as a non-specific control. g, h A summary model. Under the pluripotent state, DDX18 is highly expressed. It maintains the nucleolar structural integrity while restricting perinucleolar heterochromatin (PNH) formation through its strong liquid miscibility with the core GC factor NPM1 and relatively weaker miscibility with heterochromatin protein HP1 and immiscibility with the core DFC factor FBL (g). When DDX18 is depleted (e.g., through genetic manipulation) or downregulated (e.g., during hESC differentiation), NPM1 increases its binding to the centromere and acquires the liquid miscibility with HP1, resulting in the escape of DFC from the center of the nucleolus and the formation of “nucleolar caps” with accumulated PNH and altered nuclear organization. Consequently, intrachromosomal and interchromosomal reorganization leads to the derepression of developmental genes (e.g., HOXA) (h). (Created in BioRender. Malik, V. (2025) https://BioRender.com/v27l155). Source data are provided as a Source Data file.

References

    1. Jerkovic, I. & Cavalli, G. Understanding 3D genome organization by multidisciplinary methods. Nat. Rev. Mol. Cell Biol. 22, 511–528 (2021). - PubMed
    1. Hug, C. B. & Vaquerizas, J. M. The birth of the 3D genome during early embryonic development. Trends Genet.34, 903–914 (2018). - PubMed
    1. Zheng, H. & Xie, W. The role of 3D genome organization in development and cell differentiation. Nat. Rev. Mol. Cell Biol.20, 535–550 (2019). - PubMed
    1. Watanabe-Susaki, K. et al. Biosynthesis of ribosomal RNA in nucleoli regulates pluripotency and differentiation ability of pluripotent stem cells. Stem Cells32, 3099–3111 (2014). - PubMed
    1. Gupta, S. & Santoro, R. Regulation and roles of the nucleolus in embryonic stem cells: from ribosome biogenesis to genome organization. Stem Cell Rep.15, 1206–1219 (2020). - PMC - PubMed

Publication types

MeSH terms

Associated data