. 2010 Aug;20(8):1064-83.
doi: 10.1101/gr.104935.110. Epub 2010 Jun 21.

Genome-wide identification of TAL1's functional targets: insights into its mechanisms of action in primary erythroid cells

Affiliations

Genome-wide identification of TAL1's functional targets: insights into its mechanisms of action in primary erythroid cells

Mira T Kassouf et al. Genome Res. 2010 Aug.

Abstract

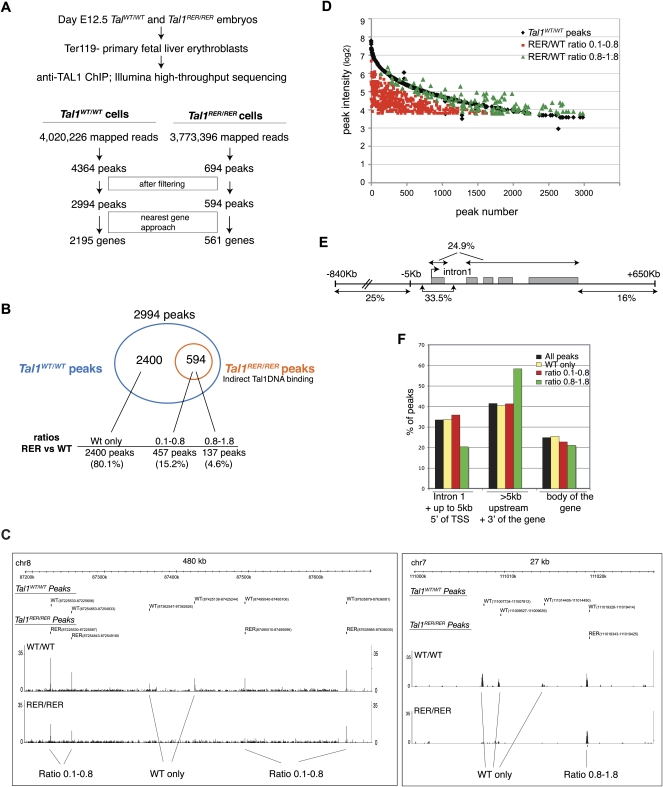
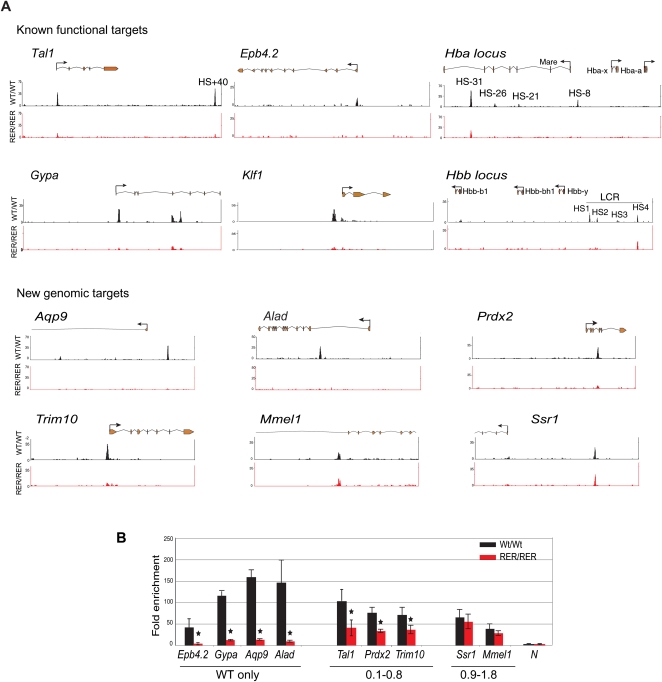
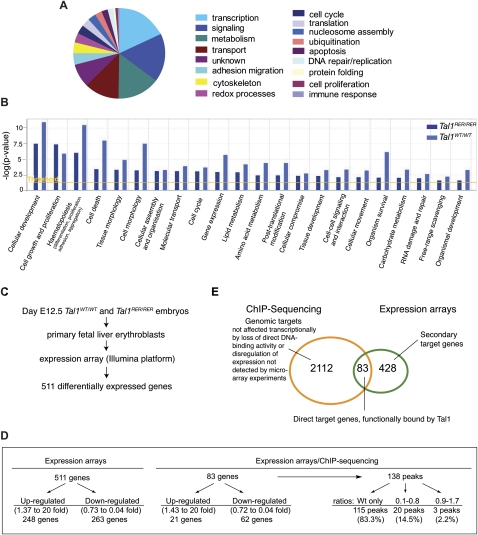
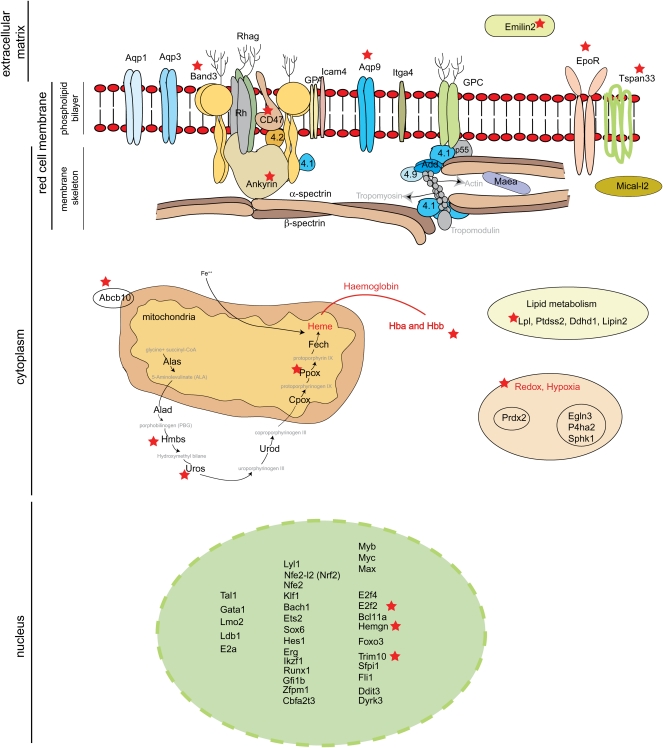
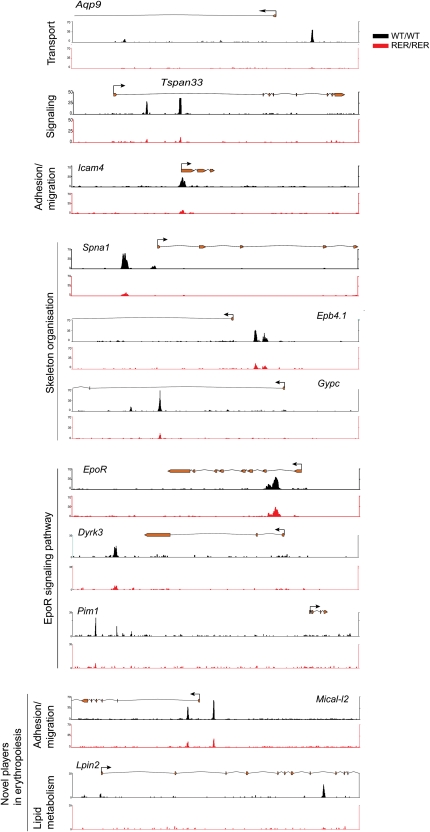
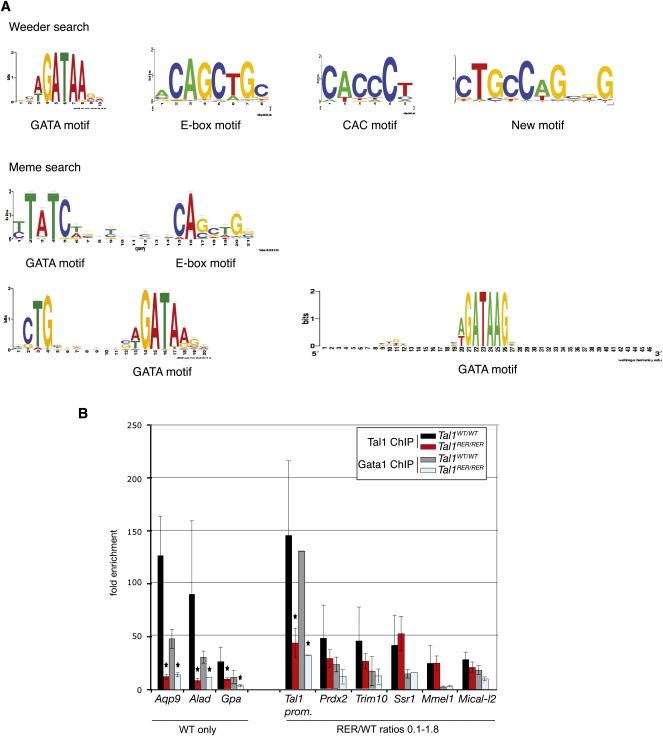
Coordination of cellular processes through the establishment of tissue-specific gene expression programs is essential for lineage maturation. The basic helix-loop-helix hemopoietic transcriptional regulator TAL1 (formerly SCL) is required for terminal differentiation of red blood cells. To gain insight into TAL1 function and mechanisms of action in erythropoiesis, we performed ChIP-sequencing and gene expression analyses from primary fetal liver erythroid cells. We show that TAL1 coordinates expression of genes in most known red cell-specific processes. The majority of TAL1's genomic targets require direct DNA-binding activity. However, one-fifth of TAL1's target sequences, mainly among those showing high affinity for TAL1, can recruit the factor independently of its DNA binding activity. An unbiased DNA motif search of sequences bound by TAL1 identified CAGNTG as TAL1-preferred E-box motif in erythroid cells. Novel motifs were also characterized that may help distinguish activated from repressed genes and suggest a new mechanism by which TAL1 may be recruited to DNA. Finally, analysis of recruitment of GATA1, a protein partner of TAL1, to sequences occupied by TAL1 suggests that TAL1's binding is necessary prior or simultaneous to that of GATA1. This work provides the framework to study regulatory networks leading to erythroid terminal maturation and to model mechanisms of action of tissue-specific transcription factors.


Figures

Figure 1.
Figure 1.
Detection of ChIP-seq peaks in Tal1WT/WT and Tal1RER/RER samples. (A) Outline of the experimental strategy. (B) Venn diagram showing that the peaks identified in material isolated from Tal1RER/RER Ter119 fetal liver cells (594 peaks, in orange circle) are a subset of the peaks identified in material isolated from Tal1WT/WT cells (2994 peaks, in blue circle). Below, the peaks are divided into three categories: “WT only” when not detected in the Tal1RER/RER sample; “0.1–0.8” or “0.8–1.8” according to the ratio of intensity between Tal1RER/RER and the corresponding Tal1WT/WT peaks. (C) TAL1 ChIP-seq peaks are displayed on two genomic loci (on chromosomes 8 and 7, top track) on GBrowse. For both sets of samples (Tal1WT/WT and Tal1RER/RER), the sequencing reads, identified as peaks, are mapped onto the chromosome view along with their coordinates and visualized along the sequence in GBrowse. The peaks exclusively detected from the wild-type sample (Tal1WT/WT Peaks) are labeled “WT only.” All the peaks detected from the mutant population (Tal1RER/RER Peaks) correspond to genomic locations also identified as peaks in the wild-type population. For those peaks, the ratio of intensity between wild-type and mutant samples is shown (RER/WT ratios 0.1–0.8 or 0.8–1.8). (D) The distribution of the 594 peaks detected in the Tal1RER/RER sample (RER/WT ratios 0.1–0.8 and 0.8–1.8) is compared with that of their corresponding peaks (i.e., detected at the same position) in the Tal1WT/WT sample, according to their intensities. The “WT only” peaks are not shown. (E) Genomic distribution in percentages of the Tal1WT/WT peaks with respect to gene loci. In gray, exons; position of intron 1 is shown; thin lines on either side of the locus represent upstream and downstream flanking sequences; the arrow shows position of the transcription start site (TSS). (F) Distribution in percentages of the Tal1WT/WT peaks as a whole (All peaks) and after fractionation according to their requirement for direct DNA-binding activity (WT only, ratios 0.1–0.8 or 0.8–1.8), with respect to the three main genomic locations, as indicated on the graph.
Figure 2.
Figure 2.
Profile of TAL1 binding on chosen loci. (A) Selected known functional or novel genomic targets of TAL1 are represented. For each locus are shown (from top to bottom): the RefSeq annotation of the gene or part of the gene (orange, exons; thin lines, introns; arrow, position of the TSS); the ChIP-seq profiles in Ter119- populations from Tal1WT/WT (black tracks) and Tal1RER/RER (red tracks) fetal liver cells. (B) Real-time PCR analysis of anti-TAL1 ChIP on selected loci. Chromatin derived from Ter119- populations from Tal1WT/WT and Tal1RER/RER fetal liver culture cells was immunoprecipitated using anti-TAL1 antibodies and the loci indicated on the graph analyzed by real-time PCR. The y-axis represents the enrichment over input DNA, normalized to a control sequence in the Gapdh gene. N, negative control. Error bars, ±1 SD, from at least three independent experiments (*P < 0.01). Below the graph are shown the categories the peaks belong to, as detected by ChIP-seq.
Figure 3.
Figure 3.
Combining ChIP-seq data with gene expression analyses. (A) Pie chart showing the distribution of the genes identified as candidate targets of TAL1 in Tal1WT/WT fetal liver cells according to their GO. (B) Highly enriched functional categories (1.1 × 10⁻¹¹ < P-values < 0.05) were identified in the gene sets characterized from Tal1WT/WT and Tal1RER/RER samples using Ingenuity software. The Ingenuity Knowledge Base served as background population and the Fisher's exact test was used. The threshold corresponds to a P-value of 0.05. (C) Microarray analysis: outline of the experimental strategy. (D) Characteristics of genes revealed by expression arrays (511) and those identified in the intersection with ChIP-seq data (83). See text for details. (E) Venn diagram showing the overlap between the genes detected by ChIP-seq and those revealed by expression array.
Figure 4.
Figure 4.
Schematic representation of selected pathways and molecules identified in this study as functional, direct targets of TAL1 in red cells. The red star indicates genes whose expression is perturbed in Tal1RER/RER Ter119- fetal liver cells, when compared with wild-type controls.
Figure 5.
Figure 5.
Profile of TAL1 binding on gene loci involved in red cell–specific processes or with functions potentially relevant in erythropoiesis. For each locus are shown (from top to bottom): the RefSeq annotation of the gene or part of the gene (orange, exons; thin lines, introns; arrow, position of the TSS); the ChIP-seq profiles in Tal1WT/WT (black tracks) and Tal1RER/RER (red tracks) cells. GO biological processes are indicated at the left of the figure.
Figure 6.
Figure 6.
DNA motifs underlying the TAL1 peaks. (A) Logos representing the motifs identified in the sequences underlying the TAL1 peaks using de novo Weeder and Meme searches. (B) Real-time PCR analysis of anti-TAL1 and anti-GATA1 ChIP on selected loci. Chromatin derived from Ter119- populations from Tal1WT/WT and Tal1RER/RER fetal liver culture cells was immunoprecipitated using anti-TAL1 and anti-GATA1 antibodies and the loci indicated on the graph analyzed by real-time PCR. The y-axis represents the enrichment over input DNA, normalized to a control sequence in the Gapdh gene. Error bars, ±1 SD from at least three independent experiments (*P < 0.01). Below the graph are shown the categories the genes belong to, as detected by ChIP-seq.

References

    1. Ader I, Brizuela L, Bouquerel P, Malavaud B, Cuvillier O 2008. Sphingosine kinase 1: A new modulator of hypoxia inducible factor 1α during hypoxia in human cancer cells. Cancer Res 68: 8635–8642 - PubMed
    1. Anderson KP, Crable SC, Lingrel JB 1998. Multiple proteins binding to a GATA-E box-GATA motif regulate the erythroid Kruppel-like factor (EKLF) gene. J Biol Chem 273: 14347–14354 - PubMed
    1. Anderson KP, Crable SC, Lingrel JB 2000. The GATA-E box-GATA motif in the EKLF promoter is required for in vivo expression. Blood 95: 1652–1655 - PubMed
    1. Anguita E, Hughes J, Heyworth C, Blobel GA, Wood WG, Higgs DR 2004. Globin gene activation during haemopoiesis is driven by protein complexes nucleated by GATA-1 and GATA-2. EMBO J 23: 2841–2852 - PMC - PubMed
    1. Aoki J, Nagai Y, Hosono H, Inoue K, Arai H 2002. Structure and function of phosphatidylserine-specific phospholipase A1. Biochim Biophys Acta 1582: 26–32 - PubMed

Publication types

MeSH terms

Substances

Associated data