. 2024 Oct 28;15(1):9286.
doi: 10.1038/s41467-024-53295-1.

Epigenetic memory of radiotherapy in dermal fibroblasts impairs wound repair capacity in cancer survivors

Affiliations

Epigenetic memory of radiotherapy in dermal fibroblasts impairs wound repair capacity in cancer survivors

Xiaowei Bian et al. Nat Commun. .

Abstract

Radiotherapy (RT), a common cancer treatment, unintentionally harms surrounding tissues, including the skin, and hinders wound healing years after treatment. This study aims to understand the mechanisms behind these late-onset adverse effects. We compare skin biopsies from previously irradiated (RT+) and non-irradiated (RT-) sites in breast cancer survivors who underwent RT years ago. Here we show that the RT+ skin has compromised healing capacity and fibroblast functions. Using ATAC-seq, we discover altered chromatin landscapes in RT+ fibroblasts, with THBS1 identified as a crucial epigenetically primed wound repair-related gene. This is further confirmed by single-cell RNA-sequencing and spatial transcriptomic analysis of human wounds. Notably, fibroblasts in both murine and human post-radiation wound models show heightened and sustained THBS1 expression, impairing fibroblast motility and contractility. Treatment with anti-THBS1 antibodies promotes ex vivo wound closure in RT+ skin from breast cancer survivors. Our findings suggest that fibroblasts retain a long-term radiation memory in the form of epigenetic changes. Targeting this maladaptive epigenetic memory could mitigate RT's late-onset adverse effects, improving the quality of life for cancer survivors.


Conflict of interest statement

The authors declare no competing interests.

Figures

Fig. 1
Fig. 1. The reduced healing capacity of late irradiated human skin.
A Collection of skin biopsies from previously irradiated (RT+) and non-irradiated (RT) sites of 46 donors. B Illustration of human ex vivo wound model. C Representative images of ex vivo wounds on RT and RT+ skin on days 0-5 post-injury (RT−, n = 6; RT + , n = 7). The initial wound edges were demarcated with dashed lines. The areas within the initial wound edge (IWtime point) are illustrated (right panel). Scale bars: 500 µm. D Wound contraction (%) was quantified as ΔIWtime point/IWD0 × 100% (RT, n = 6; RT+, n = 7; HS, n = 5). E Healing kinetics calculated from wound contraction area from day 0 to day 5 using one-phase decay model. F Masson’s trichrome staining of human ex vivo wounds on days 3 and 6 post-injury. Wound contraction was evaluated by the distance between the initial wound edges indicated with arrows (D3, n = 5; D6, n = 6). Scale bars: 500 µm. G Fibroblast outgrowth from human skin explants after ten days. Outgrowth distance (indicated by white arrows) was quantified (n = 12). Scale bars: 400 µm. H Scratch wound assay of RT and RT+ fibroblasts (n = 5). Scale bars: 300 µm. Expression of ACTA2 (I) and extracellular matrix genes (J) in human fibroblasts treated with or not with TGF-β. ACTA2, FN1, and ELN were analyzed by qRT-PCR, n = 3; COL1A1 and COL3A1 were analyzed by RNA-seq, n = 2. Data are presented as means ± SEM (D) or means ± SD (E, G). Two-way ANOVA (D, H), paired (F), or unpaired two-tailed student’s t-test (E, G). Figures 1A and 1B were created with BioRender.com released under a Creative Commons Attribution-NonCommercial-NoDerivs 4.0 International license. Source data are provided as a Source Data file.
Fig. 2
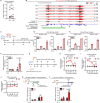
Fig. 2. Altered chromatin landscape in late irradiated dermal fibroblasts.
A Heatmap of ATAC-seq signal intensity over chromatin peaks of RT and RT+ fibroblasts (n = 5 donors). TSS, transcription starting site. Kb, kilobase pairs. B Numbers of genomic loci with differential accessibility between RT and RT+ fibroblasts. C Comparison of genes with RT+ up domains against genes exhibiting chromatin accessibility induced by irradiation. The overlapping genes are detailed in Supplementary Data 4. D GO analysis of genes with RT+ up domains: each node represents a biological process, node size indicates the number of gene enriched in that process. E HOMER motif analysis of the DA domains. F Comparison of transcription factor (TF) activities between RT+ and RT+ fibroblasts. Volcano plot showing TOBIAS differential binding score and -log10 (p-value); each dot represents one TF, and the top 5% TF are highlighted in blue or pink. RUNX family members are indicated in red. G A TF-TF network is built of RUNX1 and the other top 5% TF genes in RT+ fibroblasts. Sizes of nodes represent the level of the network starting with RUNX1. Directed edges indicate TF binding sites in the respective gene. H GO analysis of the RT+ up domain annotated genes that RUNX1 targets. I Illustration of human in vivo wound healing model. J Comparison of differentially expressed (DE) genes in day 1 (D1) and day 7 (D7) human acute wounds versus skin (n = 5 donors, |log2FC | > 1, FDR < 0.05) with RT+ up domain genes in RT+ fibroblasts and genes induced by TGF-β treatment in fibroblasts. The overlapping genes are detailed in Supplementary Data 7. K A heatmap displays the expression changes of overlapping genes in human acute wounds versus skin. Hypergeometric test (D, E, H). Two-tailed student’s t-test (F). Wald test (J). n.s.: no significant change. Figure 2I were created with BioRender.com released under a Creative Commons Attribution-NonCommercial-NoDerivs 4.0 International license.
Fig. 3
Fig. 3. THBS1 is epigenetically primed in late irradiated dermal fibroblasts.
A qRT-PCR of THBS1 in paired RT and RT+ fibroblasts (n = 7 donors). B Integrative genomics viewer image of THBS1 genomic loci with ATAC signals in paired RT vs. RT+ fibroblasts (n = 5 donors). The analysis of TOBIAS footprinting in the paired RT and RT+ fibroblasts is shown in gray and pink tracks. The green bar indicates a predicted promoter region of THBS1 and two RUNX1 binding motifs are identified. C Paired RT and RT+ fibroblasts were treated with or not with TGF-β for 24 hours and the cells were harvested for ChIP-qPCR detecting RUNX1 binding (D) and H3K4me1 histone modification (E) at the THBS1 gene (n = 2), and qRT-PCR of THBS1 expression (n = 3) (F). G Fibroblasts from RT skin or skin of healthy donors were irradiated and harvested 6 hours − 2 weeks post-irradiation. qRT-PCR analysis of CDKN1A H), PCNA I, and THBS1 (J) in non-irradiated vs. irradiated fibroblasts (n = 3). Fibroblasts were irradiated and then treated with or not with TGF-β 1 day (n = 3) K, or 6 days post-irradiation (n = 4) L. THBS1 expression was analyzed by qRT-PCR. Data are presented as means ± SD D, F, HJ, K, L. Paired two-tailed student’s t-test (A) or two-way ANOVA F, HJ, K, L. Source data are provided as a Source Data file.
Fig. 4
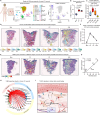
Fig. 4. Dynamic THBS1 expression during human skin wound healing.
The human in vivo wound healing model was analyzed by single-cell RNA-seq (A, H, I), bulk RNA-seq (B, qRT-PCR C), and spatial transcriptomics (ST) D-G. A UMAP plot of 16,098 cells from the day1 (D1) wounds of three healthy donors, color-coded by cell type (left). THBS1 expression is shown (right). THBS1 expression in human skin and wound tissues (n = 5 donors) B and in CD90+ dermal cells isolated by magnetic activation cell sorting from these tissues (n = 5 donors) C. In each box plot, the center line indicates the median, the edges of the box represent the first and third quartiles, and the whiskers extend to the minimum and maximum values. D Spatial transcriptomic deconvolution analysis of fibroblast sub-clusters. E Spatial feature plots showing THBS1 expression: epidermal-dermal junctions are indicated with dashed lines, and arrows point wound edges. (F) THBS1 expression in ST deconvolution fibroblast spots (skin, n = 28 spots; D1, n = 55 spots; D7, n = 44 spots; D30, n = 64 spots). (G) Correlation of THBS1 expression with fibroblast spots. H THBS-mediated cell-cell communication in human day-1 acute wounds. Edge width is proportional to the inferred interaction strength. The edge color is consistent with the signaling source. I Schematic illustration of THBS1 signals in human wounds. Data are presented as means ± SEM F. One-way ANOVA (B, C). Pearson’s correlation test G. Figure 4I was created with BioRender.com released under a Creative Commons Attribution-NonCommercial-NoDerivs 4.0 International license. Source data are provided as a Source Data file.
Fig. 5
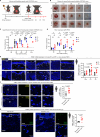
Fig. 5. Aberrant THBS1 expression in wounds of late irradiated skin.
A Illustration of the murine post-irradiation wound model (C57BL/6 mice). B Representative images of murine skin wound closure post-irradiation (C57BL/6 mice) (Ctr, n = 38; IR-, n = 16; IR + , n = 18 wounds). Scale bars: 4 mm. C Quantification of wound healing at day 0, 3, 5, 7, and 10 post-wounding in the non-irradiated control mice (Ctr), non-irradiated area (IR-), and irradiated (IR+) murine skin (Ctr, n = 38; IR-, n = 16; IR+, n = 18 wounds). D qRT-PCR analysis of Thbs1 at day 0, 3, 7, and 10 post-wounding in the Ctr, IR-, and IR+ murine wound dermal cells (Ctr, n = 14; IR- and IR+, n = 11 wounds). E Representative FISH images and quantification of THBS1 signals in human RT and RT+ ex vivo wounds 0, 3 and 6 days post-wounding (RT skin, RT and RT+ D3, n = 10; RT+ skin, RT D6, n = 8; RT+ D6, n = 6). Scale bars: 500 µm or 20 µm in the zoom-in area. Representative FISH (F) and IF G images and quantification of THBS1 in radiation ulcers (n = 8 in F; n = 6 in G) and surrounding skin (n = 5). Scale bars: 100 µm or 20 µm in the zoom-in area. White rectangles highlight the zoom-in areas, and dotted lines indicate epidermal-dermal junctions. Data are presented as means ± SEM C, or as means ± SD (EG). two-way ANOVA CE, or unpaired two-tailed student’s t-test (F, G). ns: not significant. Figure 5A was created with BioRender.com released under a Creative Commons Attribution-NonCommercial-NoDerivs 4.0 International license. Source data are provided as a Source Data file.
Fig. 6
Fig. 6. Modulation of THBS1 enhances the healing capacity of late irradiated human skin.
A Illustration of THBS1 sgRNA design and qRT-PCR analysis of THBS1 expression in human fibroblasts transfected with CRISPR/Cas9-SAM plasmids (n = 3). qRT-PCR of ECM genes B–E and ACTA2 (F) in fibroblasts with THBS1 overexpression (OE). (B, C) Ctr, n = 7, OE, n = 5; (D) Ctr, n = 7, OE, n = 4; (E) Ctr, n = 6, OE, n = 5; (F) Ctr, n = 7, OE, n = 6. G Scratch wound assays of fibroblasts with THBS1 OE (n = 7). Representative images of wounds are shown: black and white dashed lines indicate the wound edges at 0 and 24 hours, respectively. Scale bars: 300 µm. qRT-PCR analysis of THBS1 (H) and ACTA2 (I) in RT+ and RT fibroblasts with THBS1 silencing and TGF-β1 treatment (n = 3). J Scratch wound assays of RT+ fibroblasts with THBS1 silencing and TGF-β1 treatment (siCtr, n = 5, siTHBS1, n = 4). Representative images of wounds 18 hours after scratching are shown. Scale bars: 300 µm. K Scratch wound assays of fibroblasts with THBS1 OE and treated with or not with ERK inhibitor (U0126). Representative images of wounds 12 hours after scratching are shown (n = 7). Scale bars: 300 µm. L Representative images of ex vivo wounds on RT+ skin treated with or not with anti-THBS1 antibodies (Control, n = 5; THBS1 antibody, n = 4). Wound contraction was evaluated by measuring the change of areas within the initial wound edges (indicated with dashed lines) on days 0-6 post-injury. Scale bars: 500 µm. qRT-PCR of RUNX1 M), COL3A1 (O), and ELN (P) in RT and RT+ fibroblast transfected with siRUNX1 and treated with or not with TGF-β, n = 3 M), n = 4 (O, P). N Scratch wound assays of RT and RT+ fibroblasts transfected with siRUNX1 (RT or RT+ with siCtr, n = 5; RT or RT+ with siTHBS1, n = 9). Representative images of wounds 10 hours after scratching are shown. Scale bars: 300 µm. Data are presented as means ± SD. One-way ANOVA (A), unpaired two-tailed student’s t-test (BG, J, M), two-way ANOVA (H, I, K, L, NP). ns: not significant. Source data are provided as a Source Data file.
Fig. 7
Fig. 7. Schematic summary of the study.
Skin fibroblasts in cancer patients who undergo radiotherapy exhibit enduring epigenetic alterations, including heightened chromatin accessibility at the THBS1 gene locus. Following skin injury, such as during surgery, the TGF-β signaling pathway triggers RUNX1-dependent transcription of THBS1. The elevated and sustained expression of THBS1 in RT+ fibroblasts hampers cellular motility, contractility, and delays the healing process. However, the inhibition of THBS1 enhances fibroblast functionality and facilitates tissue repair, indicating a prospective therapeutic approach for addressing radiation ulcers. Figure 7 was created with BioRender.com released under a Creative Commons Attribution-NonCommercial-NoDerivs 4.0 International license.

References

    1. Thariat, J., Hannoun-Levi, J. M., Sun Myint, A., Vuong, T. & Gerard, J. P. Past, present, and future of radiotherapy for the benefit of patients. Nat. Rev. Clin. Oncol.10, 52–60 (2013). - PubMed
    1. Stone, H. B., Coleman, C. N., Anscher, M. S. & McBride, W. H. Effects of radiation on normal tissue: consequences and mechanisms. Lancet Oncol.4, 529–536 (2003). - PubMed
    1. Haubner, F., Ohmann, E., Pohl, F., Strutz, J. & Gassner, H. G. Wound healing after radiation therapy: review of the literature. Radiat. Oncol.7, 162 (2012). - PMC - PubMed
    1. Gieringer, M., Gosepath, J. & Naim, R. Radiotherapy and wound healing: principles, management and prospects (review). Oncol. Rep.26, 299–307 (2011). - PubMed
    1. Livingston, K., Schlaak, R. A., Puckett, L. L. & Bergom, C. The role of mitochondrial dysfunction in radiation-induced heart disease: from bench to bedside. Front Cardiovasc Med7, 20 (2020). - PMC - PubMed

Publication types

Associated data