. 2011 Oct 18;108(42):17456-61.
doi: 10.1073/pnas.1114210108. Epub 2011 Oct 10.

Cross-species hybridization of microarrays for studying tumor transcriptome of brain metastasis

Affiliations

Cross-species hybridization of microarrays for studying tumor transcriptome of brain metastasis

Eun Sung Park et al. Proc Natl Acad Sci U S A. .

Abstract

Although the importance of the cellular microenvironment (soil) during invasion and metastasis of cancer cells (seed) has been well-recognized, technical challenges have limited the ability to assess the influence of the microenvironment on cancer cells at the molecular level. Here, we show that an experimental strategy, competitive cross-species hybridization of microarray experiments, can characterize the influence of different microenvironments on cancer cells by independently extracting gene expression data of cancer and host cells when human cancer cells were xenografted into different organ sites of immunocompromised mice. Surprisingly, the analysis of gene expression data showed that the brain microenvironment induces complete reprogramming of metastasized cancer cells, resulting in a gain of neuronal cell characteristics and mimicking neurogenesis during development. We also show that epigenetic changes coincide with transcriptional reprogramming in cancer cells. These observations provide proof of principle for competitive cross-species hybridization of microarray experiments to characterize the effect of the microenvironment on tumor cell behavior.


Conflict of interest statement

The authors declare no conflict of interest.

Figures
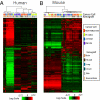
Fig. 1.
Fig. 1.
Gene expression patterns of xenografted tissues. (A) Hierarchical clustering analysis of gene expression data from human microarray experiments with xenografted tumors. Genes with expression variance within the 25th percentile and having at least a 1.5-fold difference in at least 20% of samples relative to the median value across all samples were selected for clustering analysis (11,156 gene features). The data are presented in matrix format, in which rows represent individual genes and columns represent each tissue. Each cell in the matrix represents the expression level of a gene feature in an individual tissue. The color red or green in cells reflects relative high or low expression levels, respectively, which is indicated in the scale bar (log2-transformed scale). To test the influence of mouse RNA during hybridization, mouse brain RNAs were mixed with the RNAs from PC14Br cells in cell culture before microarray experiments (highlighted with asterisk). (B) Hierarchical clustering analysis of gene expression data from mouse microarray experiments with the same xenografted tumor tissues used in human microarray experiments. Expression data of 10,160 gene features were used for this analysis after applying variance filtration. Gene expression data generated with mixed RNA were also highlighted. The first and second letters of the sample identification code in the dendrogram represent cancer cell lines and xenografted organ sites, respectively. A, A375SM; K, KM12M; M, MDA-MB231Br3; P, PC14Br4 for cell lines. B, brain; C, cecum; F, fat pad; L, lung; S, skin for organ sites.
Fig. 2.
Fig. 2.
Epigenetic changes driven by brain microenvironment. (A) Unsupervised clustering of methylation profiles in xenografted tumors. The methylation data showing the top 25% of variance were used for this analysis. The clustering analysis was performed after median centering of methylation data across tissues in each cancer cell types. In the tissue identification code row of the dendrogram, three brain-xenografted tissues (two KM12M and one PC14Br4 tissues) grouped with orthotopically xenografted tissues in gene expression clusters are highlighted in red, and an orthotopically xenografted PC14Br4 sample grouped with brain-xenografted tissues in gene expression clusters is highlighted in blue. (B) Pearson correlation coefficient calculation of the genes showing hypomethylation in brain-xenografted tumors. (C) Pearson correlation coefficient calculation of the genes showing hypermethylation in brain-xenografted tumors.
Fig. 3.
Fig. 3.
Brain-specific transcription factor. (A) Heat map of brain-specific transcription factors in human gene expression profiles; 20 transcription factors that were shown brain-specific expression in mouse array data (Fig. S6) and significant increases in brain-xenografted tumors in human array data (P < 0.001) at the same time were selected for the presentation of their expression. (B) The transcription factors showing significant correlation between methylation and expression in MDA-MB-231Br3 cells were xenografted in brain and fat pad; 11 transcription factors showing significant increase in its expression in brain-xenografted tumors (P < 0.001 and more than threefold) with significant correlation with methylation status (P < 0.001) were presented. (C) Scatter plot of four brain-specific transcription factors that are showing significant negative correlation between gene expression and methylation status.
Fig. 4.
Fig. 4.
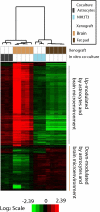
Comparison of in vitro coculture signature with in vivo brain-xenografted signature. Expression pattern of 1,085 genes with expression that is significantly (P < 0.001 by two-sample t test) altered by both coculture with mouse astrocytes and brain microenvironment. Before clustering, gene expression data were median centered independently.

References

    1. Nguyen DX, Bos PD, Massagué J. Metastasis: From dissemination to organ-specific colonization. Nat Rev Cancer. 2009;9:274–284. - PubMed
    1. Freilich RJ, Seidman AD, DeAngelis LM. Central nervous system progression of metastatic breast cancer in patients treated with paclitaxel. Cancer. 1995;76:232–236. - PubMed
    1. Chambers AF, Groom AC, MacDonald IC. Dissemination and growth of cancer cells in metastatic sites. Nat Rev Cancer. 2002;2:563–572. - PubMed
    1. Friedl P, Wolf K. Tumour-cell invasion and migration: Diversity and escape mechanisms. Nat Rev Cancer. 2003;3:362–374. - PubMed
    1. Finak G, et al. Stromal gene expression predicts clinical outcome in breast cancer. Nat Med. 2008;14:518–527. - PubMed

Publication types

MeSH terms

Associated data