. 2010 Apr 15;19(8):1438-52.
doi: 10.1093/hmg/ddq018. Epub 2010 Jan 20.

Transcriptional changes in Huntington disease identified using genome-wide expression profiling and cross-platform analysis

Affiliations

Transcriptional changes in Huntington disease identified using genome-wide expression profiling and cross-platform analysis

Kristina Becanovic et al. Hum Mol Genet. .

Abstract

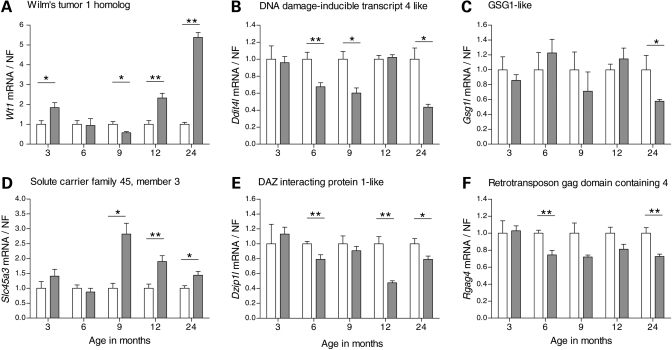
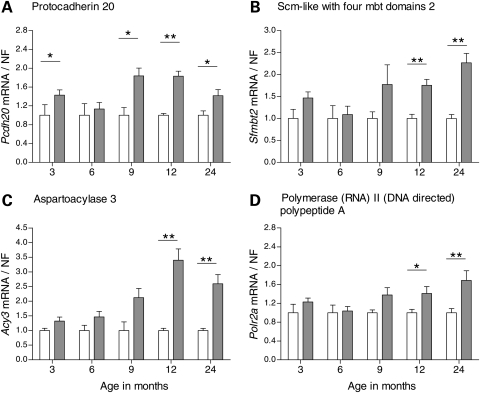
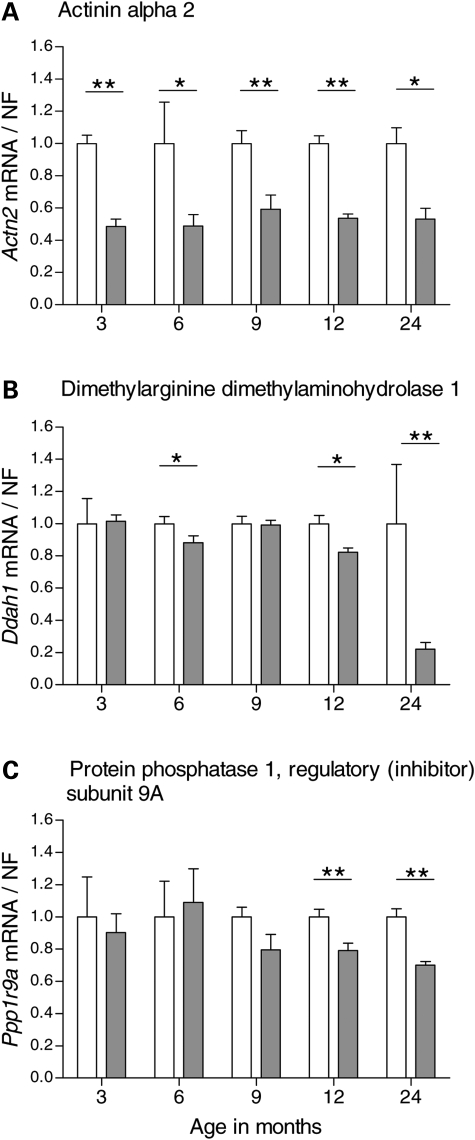
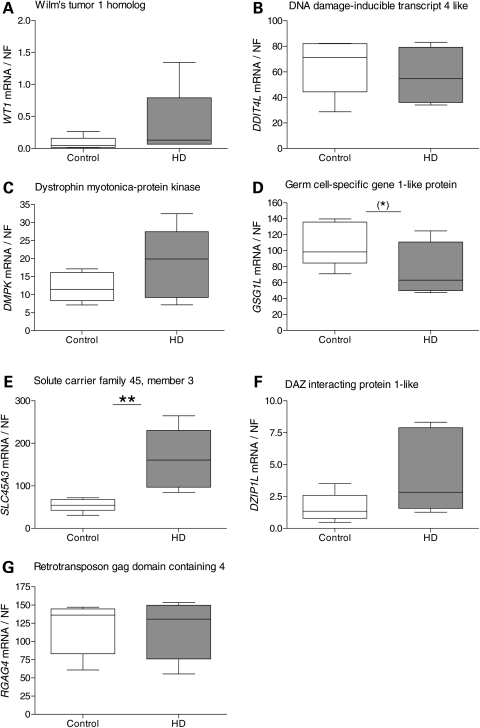
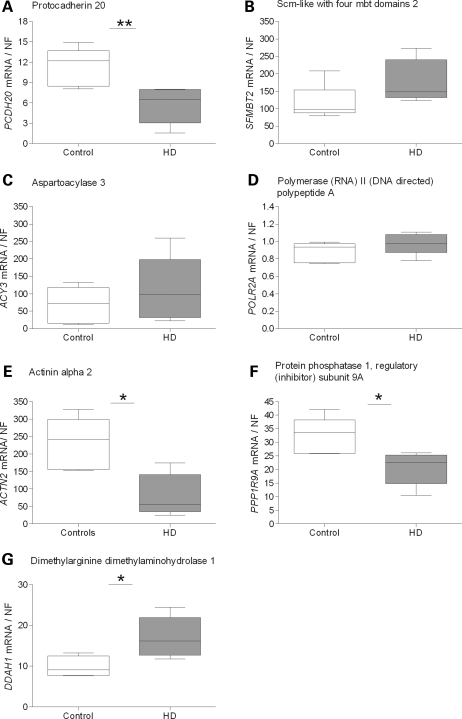
Evaluation of transcriptional changes in the striatum may be an effective approach to understanding the natural history of changes in expression contributing to the pathogenesis of Huntington disease (HD). We have performed genome-wide expression profiling of the YAC128 transgenic mouse model of HD at 12 and 24 months of age using two platforms in parallel: Affymetrix and Illumina. The data from these two powerful platforms were integrated to create a combined rank list, thereby revealing the identity of additional genes that proved to be differentially expressed between YAC128 and control mice. Using this approach, we identified 13 genes to be differentially expressed between YAC128 and controls which were validated by quantitative real-time PCR in independent cohorts of animals. In addition, we analyzed additional time points relevant to disease pathology: 3, 6 and 9 months of age. Here we present data showing the evolution of changes in the expression of selected genes: Wt1, Pcdh20 and Actn2 RNA levels change as early as 3 months of age, whereas Gsg1l, Sfmbt2, Acy3, Polr2a and Ppp1r9a RNA expression levels are affected later, at 12 and 24 months of age. We also analyzed the expression of these 13 genes in human HD and control brain, thereby revealing changes in SLC45A3, PCDH20, ACTN2, DDAH1 and PPP1R9A RNA expression. Further study of these genes may unravel novel pathways contributing to HD pathogenesis. DDBJ/EMBL/GenBank accession no: GSE19677.


Figures

Figure 1.
Figure 1.
Time course analysis of differentially expressed genes identified on the Affymetrix and Illumina platforms. We analyzed the top 10 genes from the Affymetrix and Illumina results. YAC128 and wild-type littermate controls were analyzed at 3, 6, 9, 12 and 24 months of age by qPCR. We analyzed Wilm's tumor 1 homolog (Wt1), DNA damage-inducible transcript 4 like (Ddit4l), germ cell-specific gene 1-like protein (Gsg1l) and solute carrier family 45, member 3 (Slc45a3). YAC128 showed an up-regulation of Wt1 transcript levels at 3 months (P = 0.029), 12 months (P = 0.0025) and 24 months (P = 0.0012) and a down-regulation at 9 months (P = 0.0173) compared with controls (A). Ddit4l was down-regulated in YAC128 compared with controls at 6 months (P = 0.0079), 9 months (P = 0.030) and 24 months (P = 0.014) (B). Gsg1l was only down-regulated in YAC128 at 24 months of age compared with controls (P = 0.018) (C). Slc45a3 showed up-regulation at 9 months (P = 0.029), 12 months (P = 0.0087) and 24 months (P = 0.0152) in YAC128 compared with controls (D). In addition to Wt1, DAZ interacting protein 1-like (Dzip1l) and retrotransposon gag domain containing 4 (Rgag4) were identified on the Illumina platform as differentially expressed at 24 months of age. YAC128 showed down-regulation of Dzip1l at 6 months (P = 0.0055), 12 months (P = 0.0012) and 24 months (P = 0.0221) compared with controls (E). Rgag4 was down-regulated in YAC128 compared with controls at 6 months (P = 0.0010) and 24 months (P = 0.0082) (F). YAC128 data were normalized to the calculated average for the wild-type controls for each individual target and time point. The bars show the mean ± SEM for each target. Statistical analysis was performed using Mann–Whitney two-tailed U-test; *P < 0.05; **P < 0.01; ***P < 0.001. White and grey bars indicate wild-type controls and YAC128, respectively.
Figure 2.
Figure 2.
Time course analysis of differentially expressed genes identified using the combined rank list for 24-month-old YAC128 and controls. We analyzed the top 10 genes from the established combined rank list. YAC128 and wild-type littermate controls were analyzed at 3, 6, 9, 12 and 24 months of age by qPCR. In addition to Wt1 and Ddit4l, we analyzed Protocadherin 20 (Pcdh20), Scm-like with four mbt domains 2 (Sfmbt2), aspartoacylase 3 (Acy3) and polymerase (RNA) II (DNA directed) polypeptide A (Polr2a) that were included in the top 10 genes of the combined rank list for 24-month-old mice. Pcdh20 was up-regulated in YAC128 compared with controls at 3 months (P = 0.0186), 9 months (P = 0.0173), 12 months (P = 0.0012) and 24 months (P = 0.035) (A). Sfmbt2 was up-regulated in YAC128 compared with controls at 12 months (P = 0.0012) and 24 months (P = 0.0012) (B). Acy3 was up-regulated at 12 months (P = 0.0025) and 24 months (P = 0.0012) (C). There was a tendency for increase of Acy3 transcript levels also at 9 months (P = 0.056). Polr2a transcript levels were increased in YAC128 at 12 months (P = 0.035) and 24 months (P = 0.0047) (D). YAC128 data were normalized to the calculated average for the wild-type controls for each individual target and time point. The bars show the mean ± SEM for each target. Statistical analysis was performed using Mann–Whitney two-tailed U-test; *P < 0.05; **P < 0.01; ***P < 0.001. White and grey bars indicate wild-type controls and YAC128, respectively.
Figure 3.
Figure 3.
Time course analysis of differentially expressed genes identified using the combined rank list for 12-month-old YAC128 and controls. We analyzed the top 10 genes from the established combined rank list. YAC128 and wild-type littermate controls were analyzed at 3, 6, 9, 12 and 24 months of age by qPCR. We analyzed actinin alpha 2 (Actn2), dimethylarginine dimethylaminohydrolase 1 (Ddah1) and protein phosphotase 1, regulatory (inhibitor) subunit 9A (Ppp1r9a). Actn2 was down-regulated in YAC128 compared with controls at all five time points; at 3 months (P = 0.0040), 6 months (P = 0.036), 9 months (P = 0.0087), 12 months (P = 0.0012) and 24 months (P = 0.014) (A). Ddah1 transcript levels were lower in YAC128 compared with controls at 6 months (P = 0.021), 12 months (P = 0.022) and 24 months (P = 0.0012) (B). Ppp1r9a was down-regulated in YAC128 compared with controls at 12 months (P = 0.0047) and 24 months (P = 0.0012) (C). YAC128 data were normalized to the calculated average for the wild-type controls for each individual target and time point. The bars show the mean ± SEM for each target. Statistical analysis was performed using Mann–Whitney two-tailed U-test; *P < 0.05; **P < 0.01; ***P < 0.001. White and grey bars indicate wild-type controls and YAC128, respectively.
Figure 4.
Figure 4.
Transcriptional alterations identified in human HD caudate compared with controls. We analyzed the genes identified as differentially expressed in the YAC128 transgenic model when validating the results from the individual platforms: Affymetrix and Illumina. We quantified WT1, DDIT4L, DMPK, GSG1L, SLC45A3, DZIP1L and RGAG4 in human HD caudate (n = 6) and controls (n = 5) by qPCR. WT1 (A), DDIT4L (B) and DZIP1L (F) did not show differential expression, although showing trends for up-regulation of WT1 and DZIP1L in HD cases compared with controls. GSG1L showed down-regulation in HD caudate with borderline significance (P = 0.051) (D), whereas SLC45A3 was up-regulated in HD cases compared with controls (P = 0.0043) (E). RGAG4 did not show any differential expression between HD cases and controls (G). The middle line of the Box and Whisker plot shows the median, the top and bottom lines show the 75th and 25th percentile, respectively. The top and bottom Whiskers indicate the largest and smallest values. Statistical analysis was performed using Mann–Whitney two-tailed U-test; *P < 0.05; **P < 0.01; ***P < 0.001.
Figure 5.
Figure 5.
Transcriptional alterations identified in human HD caudate compared with controls. We analyzed the genes identified as differentially expressed in the YAC128 transgenic mice when validating results from the established 12- and 24-month combined rank lists. In addition to WT1 and DDIT4L, we analyzed PCDH20, SFMBT2, ACY3 and POLR2A mRNA expression in human caudate of HD cases and controls by qPCR. These genes were initially identified to be differentially expressed in the YAC128 compared with controls when validating genes from the combined rank list for 24-month-old mice. PCDH20 was down-regulated in HD cases compared with controls (P = 0.0043) (A). SFMBT2 (B), ACY3 (C) and POLR2A (D) were not differentially expressed in HD cases compared with controls, although SFMBT2 and ACY3 showed tendencies for up-regulation in HD cases compared with controls. We also analyzed ACTN2, DDAH1 and PPP1R9A mRNA expression in human caudate of HD cases and controls. These genes were initially identified to be differentially expressed in the YAC128 compared with controls when validating genes from the combined rank list for 12-month-old mice. All three genes showed transcriptional changes. ACTN2 (E) and PPP1R9A (F) were both down-regulated in HD cases compared with controls (P = 0.017), whereas DDAH1 (G) was up-regulated in HD cases compared with controls (P = 0.017). The middle line of the Box and Whisker plot shows the median, the top and bottom lines show the 75th and 25th percentile, respectively. The top and bottom Whiskers indicate the largest and smallest values. Statistical analysis was performed using Mann–Whitney two-tailed U-test; *P < 0.05; **P < 0.01; ***P < 0.001.

References

    1. Gusella J.F. Group H.D.C. A novel gene containing a trinucleotide repeat that is expanded and unstable on Huntington's disease chromosomes. The Huntington's Disease Collaborative Research Group. [see comment] Cell. 1993;72:971–983. - PubMed
    1. Furtado S., Suchowersky O., Rewcastle B., Graham L., Klimek M.L., Garber A. Relationship between trinucleotide repeats and neuropathological changes in Huntington's disease. Ann. Neurol. 1996;39:132–136. - PubMed
    1. Sotrel A., Paskevich P.A., Kiely D.K., Bird E.D., Williams R.S., Myers R.H. Morphometric analysis of the prefrontal cortex in Huntington's disease. Neurology. 1991;41:1117–1123. - PubMed
    1. Gil J.M., Rego A.C. Mechanisms of neurodegeneration in Huntington's disease. Eur. J. Neurosci. 2008;27:2803–2820. - PubMed
    1. Imarisio S., Carmichael J., Korolchuk V., Chen C.W., Saiki S., Rose C., Krishna G., Davies J.E., Ttofi E., Underwood B.R., et al. Huntington's disease: from pathology and genetics to potential therapies. Biochem. J. 2008;412:191–209. - PubMed

Publication types

Associated data