. 2024 Oct 24;15(1):9169.
doi: 10.1038/s41467-024-53330-1.

PCLAF-DREAM drives alveolar cell plasticity for lung regeneration

Affiliations

PCLAF-DREAM drives alveolar cell plasticity for lung regeneration

Bongjun Kim et al. Nat Commun. .

Abstract

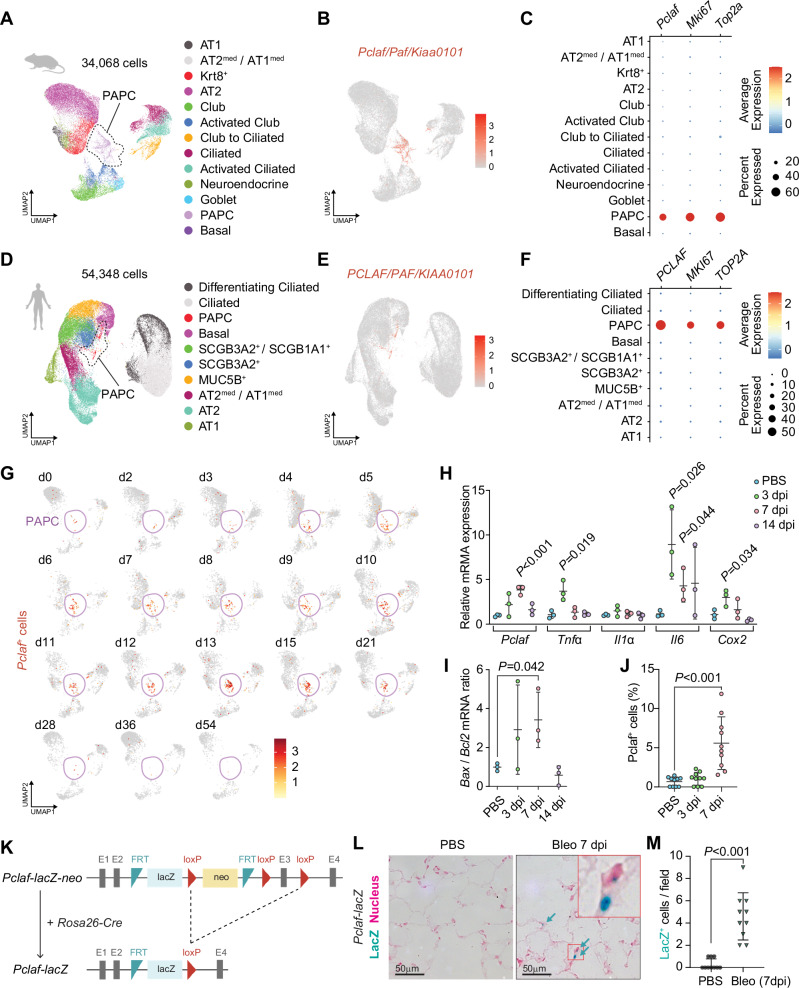
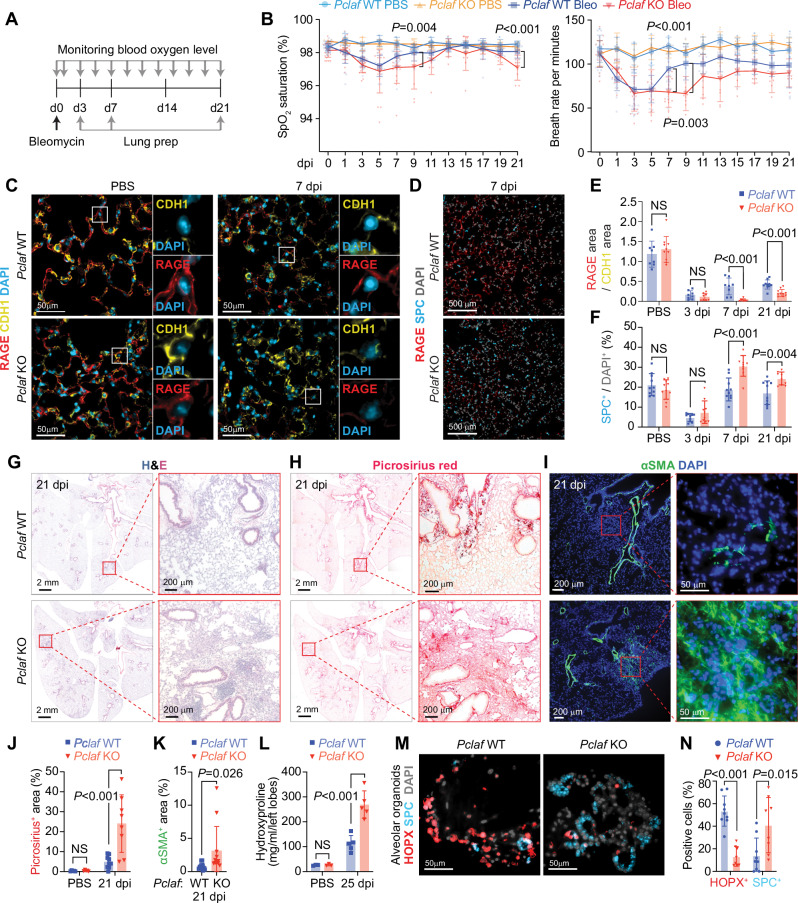
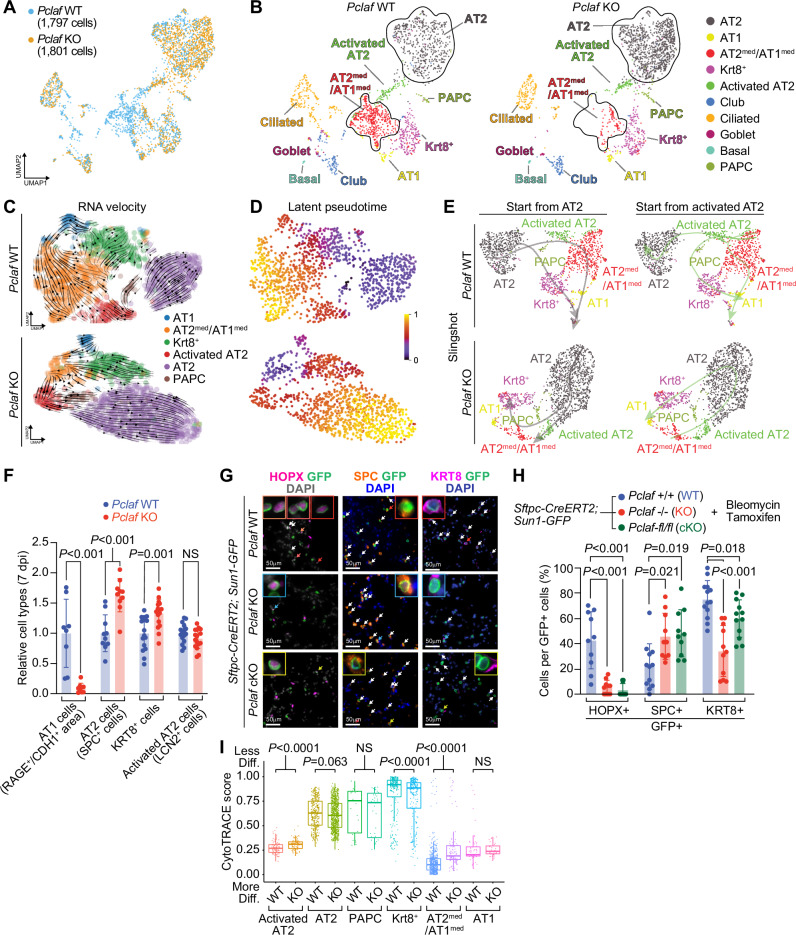
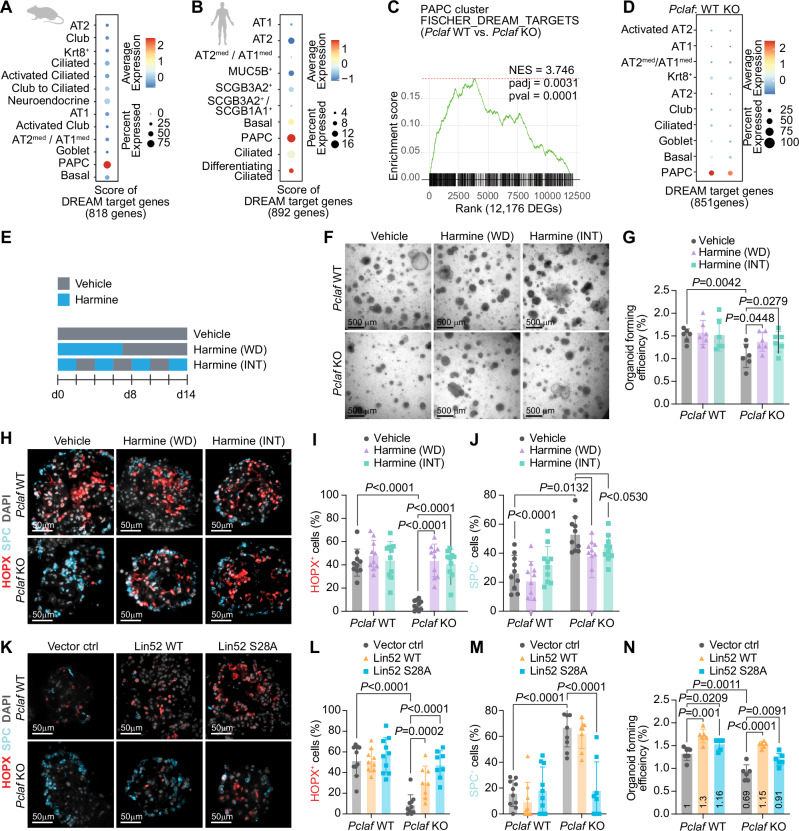
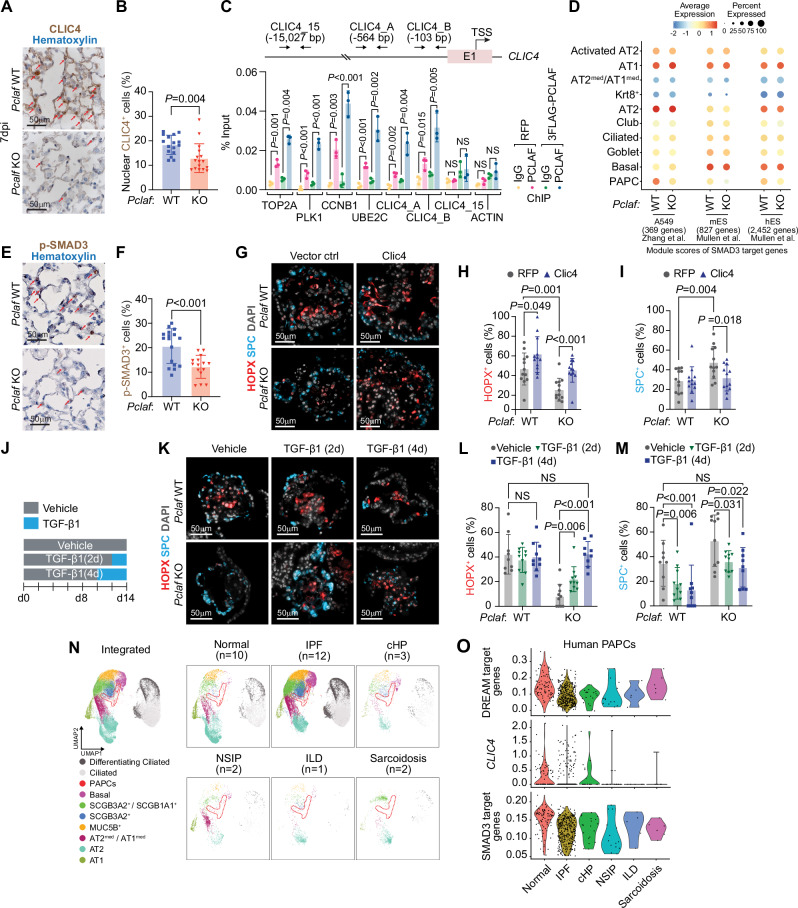
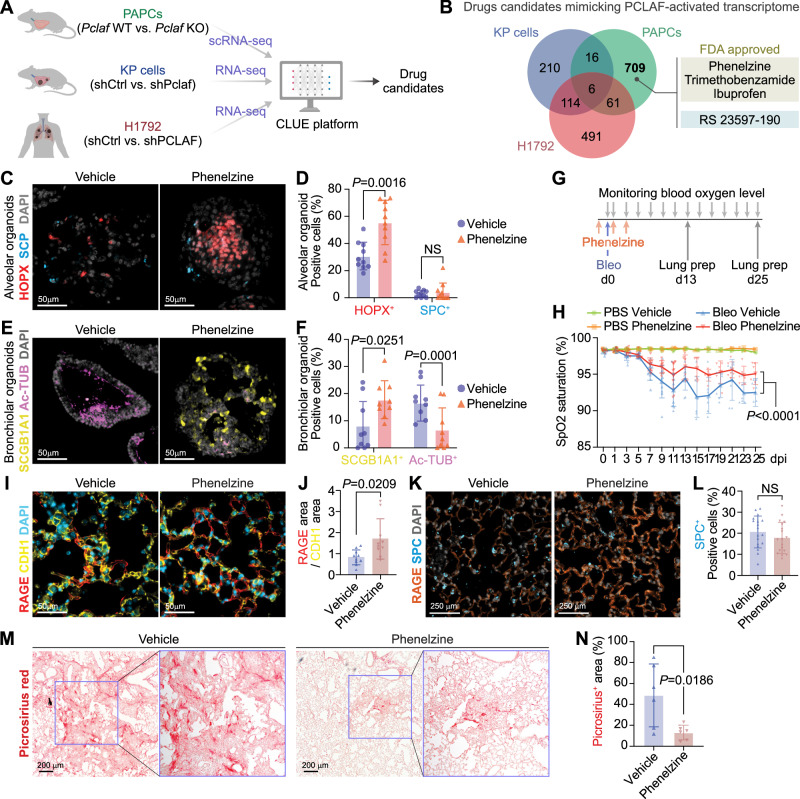
Cell plasticity, changes in cell fate, is crucial for tissue regeneration. In the lung, failure of regeneration leads to diseases, including fibrosis. However, the mechanisms governing alveolar cell plasticity during lung repair remain elusive. We previously showed that PCLAF remodels the DREAM complex, shifting the balance from cell quiescence towards cell proliferation. Here, we find that PCLAF expression is specific to proliferating lung progenitor cells, along with the DREAM target genes transactivated by lung injury. Genetic ablation of Pclaf impairs AT1 cell repopulation from AT2 cells, leading to lung fibrosis. Mechanistically, the PCLAF-DREAM complex transactivates CLIC4, triggering TGF-β signaling activation, which promotes AT1 cell generation from AT2 cells. Furthermore, phenelzine that mimics the PCLAF-DREAM transcriptional signature increases AT2 cell plasticity, preventing lung fibrosis in organoids and mice. Our study reveals the unexpected role of the PCLAF-DREAM axis in promoting alveolar cell plasticity, beyond cell proliferation control, proposing a potential therapeutic avenue for lung fibrosis prevention.


Conflict of interest statement

The authors declare no competing interests.

Figures

Fig. 1
Fig. 1. Pclaf+ cells are elevated during lung regeneration.
AC A public scRNA-seq dataset (GSE141259) was generated by subjecting sorted cells from the mouse lung epithelial compartment at 18 different time points after bleomycin instillation. Uniform manifold approximation and projection (UMAP)-embedding displays cells colored by cell type identity (A). Feature plot of Pclaf expression (B). Dot plots showing Pclaf, Mki67, and Top2a gene expression in each cell type (C). DF A public scRNA-seq dataset (GSE135893) was generated from the human lung cells of 20 pulmonary fibrotic diseases and 10 control lungs. UMAP embedding displays cells colored by cell type identity (D). Feature plot of expression of PCLAF (E). Dot plots for PCLAF, MKI67, and TOP2A gene expression in each cell type (F). G Feature plots of Pclaf expression in mouse lung at the indicated time points using data shown in (A). HJ Mouse lungs (n = 3) were collected after bleomycin (1.4 U/kg) had been added to the trachea at the indicated time points. RT-qPCR analysis of the Pclaf, Tnfα, Il1α, Il6, and Cox2 mRNA level (H) and the ratio of Bax/Bcl2 mRNA level (I). Quantification of Pclaf+ cells by immunostaining (J). K Scheme of establishing Pclaf-lacZ knock-in mice. The neo cassette was deleted by breeding Pclaf-lacZ-neo with Rosa26-Cre driver. L, M Representative images of X-gal staining. Pclaf-lacZ mice were instilled with bleomycin (1.4 U/kg; n = 10; Bleo) or PBS (0 dpi; n = 10). At 7 dpi, lungs were collected and stained for X-gal (5-bromo-4-chloro-3-indolyl-β-D-galactopyranoside; blue) and nuclear fast red (pink) (L). Quantification of lacZ+ cells (M). Two-sided Student’s t-test; error bars: mean +/− standard deviation (SD). Represented data are shown (n ≥ 3). Source data are provided as a Source Data file. Graphic icons were created with BioRender.com.
Fig. 2
Fig. 2. Pclaf KO impairs lung regeneration.
A Experimental scheme for the bleomycin-induced lung injury model. Pclaf WT and KO mice were treated with PBS (n = 5 for Pclaf WT, n = 5 for Pclaf KO) or bleomycin (1.4 U/kg; n = 25 for Pclaf WT, n = 24 for Pclaf KO; Bleo) by intratracheal instillation. The blood oxygen level (SpO2) and breath rate were measured by pulse-oximetry at the indicated time points. At 3 days after injury (dpi, n = 7 for each group with bleomycin), 7 dpi (n = 8 for each group with bleomycin), and 21 dpi (n = 10 for Pclaf WT, n = 8 for Pclaf KO with bleomycin, n = 5 for each group with PBS (21 dpi)), the lungs were collected for further analysis. B The dynamics of SpO2 levels (left panel) and breath rate per minute (right panel) were measured at the indicated time points. Pclaf WT and KO with PBS (n = 5); Pclaf WT with bleomycin until 3 dpi (n = 25); 5 dpi and 7 dpi (n = 18), after 9 dpi (n = 10); Pclaf KO with bleomycin until 3 dpi (n = 24); 5 dpi and 7 dpi (n = 17), 9–15 dpi (n = 9), after 17 dpi (n = 8). C Representative immunostaining images for RAGE (AT1) and CDH1 (Epithelial cell) in PBS-instilled lung and 7 dpi of bleomycin-instilled lung. D Representative images of immunostaining for RAGE and SPC (AT2 cells) at 7 dpi. E Quantification of RAGE+ area/CDH1+ area. Pclaf WT with PBS (n = 8), 3 dpi (n = 8), 7 dpi (n = 8), and 21 dpi (n = 10); Pclaf KO with PBS (n = 10), 3 dpi (n = 8), 7 dpi (n = 9), and 21 dpi (n = 10). F Quantification of SPC+ cells. n = 10 for each strain at indicated time point. G Representative images of hematoxylin and eosin (H&E) staining at 21 dpi. H Representative images of picrosirius staining (collagen fiber) at 21 dpi. I Representative images of immune-staining for alpha-smooth muscle actin (αSMA/Acta2; smooth muscle cell) at 21 dpi. J Quantification graphs of the picrosirius+ area. Pclaf WT or Pclaf KO with PBS (n = 5) or bleomycin at 21 dpi (n = 10). K Quantification graphs of the αSMA+ area. n = 12 for each strain. L Quantification of hydroxyproline contents in the left lobe of bleomycin (n = 5) or PBS-instilled (n = 3) lung at 25 dpi. M, N The lung epithelial cells were isolated from bleomycin-treated lungs of Pclaf WT or Pclaf KO mice at 7 dpi by MACS. The lung epithelial cells (TER119-/CD31-/CD45-/EPCAM+) were cultured with lung endothelial cells (CD31+) at a liquid-air interface to generate LOs. Representative Images of alveolar type organoids fluorescently immunostained for HOPX (AT1) and SPC (M). Quantification graph of HOPX+ and SPC+ cells. Pclaf WT (n = 9) or Pclaf KO (n = 8) (N). Two-sided Student’s t-test; error bars: mean +/− SD. Represented images are shown (n ≥ 3). Source data are provided as a Source data file.
Fig. 3
Fig. 3. Pclaf KO suppresses AT2 cell lineage plasticity.
A Integrated UMAP displaying each cell cluster of pulmonary epithelial cells isolated from Pclaf WT and KO mice. B UMAPs (split by Pclaf WT and KO) displaying each cell cluster, colored by cell types. CE Alveolar cell clusters (AT1, AT2med/AT1med, Krt8+, Activated AT2, AT2, and PAPCs) were introduced for RNA velocity analysis. RNA velocity analyses (C), latent pseudotime analysis (D), and Slingshot analysis (E) of Pclaf WT or KO based on scRNA-seq are depicted. F Quantification of cells derived from AT2 cells immunostaining for RAGE+ area/CDH1+ area (AT1; n = 8 for Pclaf WT and n = 9 for Pclaf KO), SPC+ cells (AT2; n = 10), KRT8+ cells (Krt8+; n = 16), and LCN2+ cells (Activated AT2; n = 16) from the lung tissues (7 dpi). Two-sided Student’s t-test; error bars: mean +/− SD. G, H Quantification of cells derived from AT2 cells using AT2 cell lineage-tracing animal model. The lung tissues of Sftpc-CreERT2; Sun1-GFP lineage-tracing mice combined with Pclaf WT (n = 5), Pclaf KO (n = 3), or Pclaf cKO (Pclaf-fl/fl; n = 3) (14 dpi with tamoxifen for five days) were analyzed by immunostaining (G) and quantification (H). Each cell type was detected by co-immunostaining with an anti-GFP antibody and calculated by their cell numbers per GFP+ cells. HOPX+ (n = 10); SPC+ for Pclaf WT (n = 12), Pclaf KO (n = 10), or Pclaf cKO (n = 10); KRT8+ for Pclaf WT (n = 13), Pclaf KO (n = 11), or Pclaf cKO (n = 12). Sun1-GFP is localized in the inner nuclear membrane. Two-sided Student’s t-test; error bars: mean +/− SD. I Boxplots of predicted cluster-differentiation based on the CytoTRACE analysis using scRNA-seq data shown in (B). The edges of the box plot represent the first and third quartiles, the center line represents the median, and the whiskers extend to the smallest and largest data points within 1.5 interquartile ranges from the edges. Statistical significance is determined using an unpaired Wilcox test. Source data are provided as a Source data file.
Fig. 4
Fig. 4. PCLAF-DREAM axis mediates AT2 cell lineage plasticity for lung regeneration.
A Dot plots depicting transcriptional module scores of the gene sets of DREAM-target genes with the mouse scRNA-seq dataset shown in Fig. 1A. B Dot plots depicting transcriptional module scores of the gene sets of DREAM-target genes with the human scRNA-seq dataset shown in Fig. 1D. C Gene set enrichment analysis (GSEA) of Pclaf WT vs. Pclaf KO in the PAPC cluster using the dataset shown in Fig. 3. The enrichment plot presents the gene sets of DREAM-target genes. D Dot plots depicting transcriptional module scores of the DREAM-target gene set using the dataset shown in Fig. 3. E Experimental scheme for LO culture under stimuli of harmine (200 nM). Harmine was used to treat LOs for the first 7 days and withdrawn (WD). Alternatively, LOs were cultured with harmine intermittently (INT) at the indicated time points. F The representative bright-field z-stack images of LOs on day 12. G Quantification graph of lung OFE (n = 6). H Representative images of IF staining for HOPX and SPC on day 14. I, J Quantification graph of HOPX+ (n = 10) (I) and SPC+ cells (n = 10) (J). KN Isolated lung epithelial cells were transduced with RFP, Lin52 WT, or Lin52 S28A by lentivirus and then cultured with LO. Representative images of IF staining for HOPX and SPC on day 14 (K). Quantification graph of HOPX+ (n = 10) (L) and SPC+ cells (n = 10) (M). Quantification graph of lung OFE (n = 6) (N). Two-sided Student’s t-test; error bars: mean +/− SD. Represented images and data are shown (n ≥ 3). Source data are provided as a Source data file. Graphic icons were created with BioRender.com.
Fig. 5
Fig. 5. PCLAF-DREAM-mediated CLIC4-TGF-β signaling axis is required for AT1 cell differentiation.
A Representative images of Pclaf WT and Pclaf KO lung at 7 dpi, immunostained for CLIC4. B Quantification graph of nucleus CLIC4+ cells (n = 16). C qPCR analysis using indicated primer sets targeting proximal promoter of DREAM target genes, CLIC4, or ACTB. ChIP was performed using anti-PCLAF antibody (n = 3). H358 cells ectopically expressing 3FLAG-PCLAF or RFP were used for ChIP. D Dot plots depicting transcriptional module scores of SMAD3 gene sets from A549, mouse embryonic stem cells (mES), and human embryonic stem cells (hES) using the scRNA-seq dataset shown in Fig. 3. E Representative images of Pclaf WT and Pclaf KO lung at 7 dpi, immunostained for p-SMAD3. F Quantification graph of p-SMAD3+ cells. Pclaf WT (n = 17) or Pclaf KO (n = 15). GI Isolated lung epithelial cells were transduced with RFP- or CLIC4-expressing lentiviruses and cultured with LO. Representative images of IF staining for HOPX and SPC on day 14 (G). Quantification of HOPX+ (n = 12) (H) and SPC+ cells (n = 12) (I). JM Pclaf WT, or KO lung epithelial cells-derived LOs were cultured with TGF-β1 (2 ng/ml) for 2 days (TGFβ1 [2D]) or 4 days (TGFβ1 [4D]). Experimental scheme for TGF-β1 treatment (J). Representative images of IF staining for HOPX and SPC on day 14 (K). Quantification graph of HOPX+ (n = 10) (L) and SPC+ cells (n = 10) (M). N UMAP plots displaying each cell cluster from the scRNA-seq datasets of normal human lung and fibrotic diseases shown in Fig. 1D. (IPF idiopathic pulmonary fibrosis, cHP chronic hypersensitivity pneumonitis, NSIP nonspecific interstitial pneumonia, ILD interstitial lung disease). O Violin plots showing the expression of module scores of DREAM-target genes, CLIC4 expression, and hES-SMAD3-target genes in the PAPC clusters from the human scRNA-seq dataset. Two-sided Student’s t-test; error bars: mean +/− SD. Represented images are shown (n ≥ 3). Source data are provided as a Source data file.
Fig. 6
Fig. 6. Pharmacological mimicking of PCLAF-DREAM-activated transcriptional signature restores lung regeneration.
A Experimental scheme to identify drug candidates by the CLUE platform. B Venn diagram of Connectivity Map results, identifying drug candidates specific to normal lung PAPCs. C Representative images of LOs with phenelzine (10 μM) that fluorescently immunostained for HOPX and SPC. D Quantification graph of HOPX+ and SPC+ cells (n = 10). E Representative images of LOs with phenelzine (10 μM) that fluorescently immunostained for SCGB1A1 (Club) and Ac-TUB (Ciliated). F Quantification graph of SCGB1A1+ and Ac-TUB+ cells (n = 9). G Experimental scheme for bleomycin-induced lung regeneration by phenelzine. Mice were treated with bleomycin (2.8 U/kg) by intratracheal instillation. The vehicle control (DMSO, n = 10) or phenelzine (n = 10; 750 μg/head) were administered via intraperitoneal injection at −1, 1, and 3 dpi. The blood oxygen level (SpO2) and breath rate were measured by pulse-oximetry every other day. At 13 dpi (n = 4 for each group) and 25 dpi (n = 6 for each group), lungs were collected for further analysis. H The dynamics of spO2 levels were measured at the indicated time points. Two-way ANOVA with post-hoc Tukey test. PBS with vehicle or phenelzine until 13 dpi (n = 4) and after 15 dpi (n = 2); bleomycin with vehicle until 13 dpi (n = 10) and after 15 dpi (n = 7); bleomycin with phenelzine until 7 dpi (n = 10), 9–13 dpi (n = 9), and after 15 dpi (n = 6). I Representative images of the lungs at 13 dpi, fluorescently immunostained for RAGE (AT1) and CDH1 (Epithelial cell). J Quantification graph of RAGE+/CDH1+ area (n = 10). K Representative images of the lungs at 13 dpi, fluorescently immunostained for RAGE (AT1) and SPC (AT2). L Quantification graph of SPC+ cells (n = 18). M Representative images of picrosirius staining at 25 dpi. N Quantification graphs of the picrosirius+ area (n = 6). Two-sided Student’s t-test except for (H); error bars: mean +/− SD. Representative images are shown (n ≥ 3). Source data are provided as a Source data file. Graphic icons in Figure A were created with BioRender.com.

References

    1. Schiller, H. B. et al. The human lung cell atlas: a high-resolution reference map of the human lung in health and disease. Am. J. Respir. Cell Mol. Biol.61, 31–41 (2019). - PMC - PubMed
    1. Chonghaile, M. N., Higgins, B. D., Costello, J. & Laffey, J. G. Hypercapnic acidosis attenuates lung injury induced by established bacterial pneumonia. Anesthesiology109, 837–848 (2008). - PubMed
    1. Kc, R., Shukla, S. D., Gautam, S. S., Hansbro, P. M. & O’Toole, R. F. The role of environmental exposure to non-cigarette smoke in lung disease. Clin. Transl. Med.7, 39 (2018). - PMC - PubMed
    1. Raghu, G. et al. An official ATS/ERS/JRS/ALAT statement: idiopathic pulmonary fibrosis: evidence-based guidelines for diagnosis and management. Am. J. Respir. Crit. Care Med.183, 788–824 (2011). - PMC - PubMed
    1. Kotton, D. N. & Morrisey, E. E. Lung regeneration: mechanisms, applications and emerging stem cell populations. Nat. Med.20, 822–832 (2014). - PMC - PubMed

Publication types

MeSH terms

Substances

Associated data