. 2010 May;20(5):614-22.
doi: 10.1101/gr.103200.109. Epub 2010 Apr 2.

Global survey of escape from X inactivation by RNA-sequencing in mouse

Affiliations

Global survey of escape from X inactivation by RNA-sequencing in mouse

Fan Yang et al. Genome Res. 2010 May.

Abstract

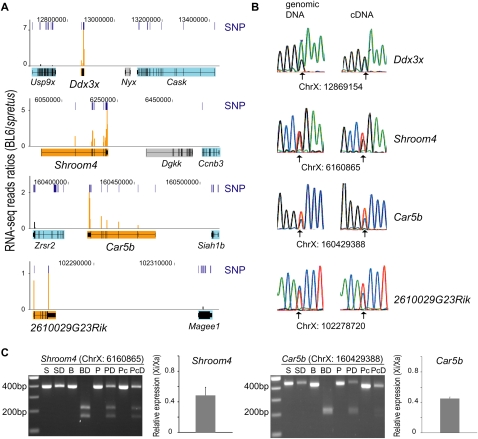
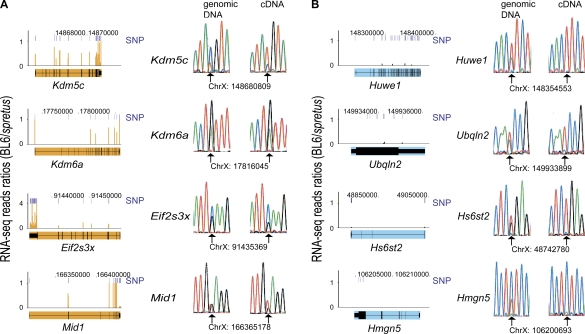
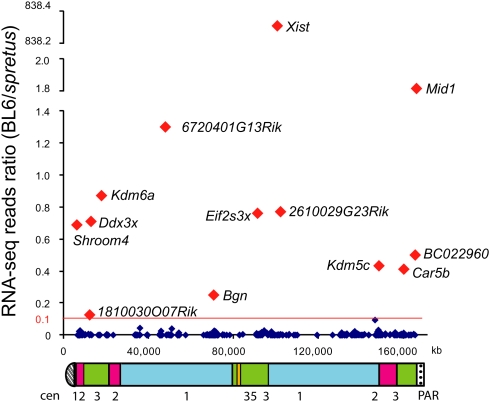
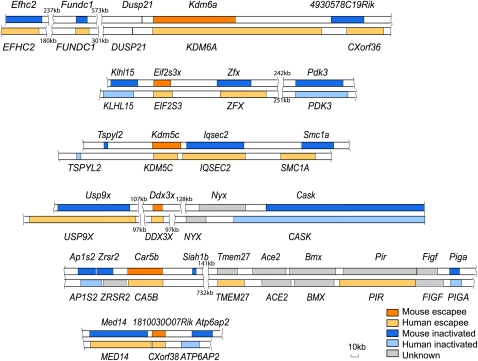
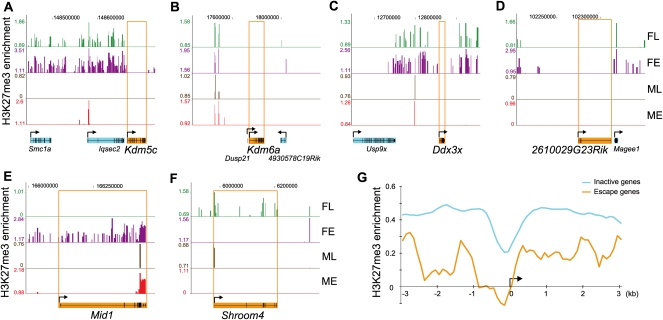
X inactivation equalizes the dosage of gene expression between the sexes, but some genes escape silencing and are thus expressed from both alleles in females. To survey X inactivation and escape in mouse, we performed RNA sequencing in Mus musculus x Mus spretus cells with complete skewing of X inactivation, relying on expression of single nucleotide polymorphisms to discriminate allelic origin. Thirteen of 393 (3.3%) mouse genes had significant expression from the inactive X, including eight novel escape genes. We estimate that mice have significantly fewer escape genes compared with humans. Furthermore, escape genes did not cluster in mouse, unlike the large escape domains in human, suggesting that expression is controlled at the level of individual genes. Our findings are consistent with the striking differences in phenotypes between female mice and women with a single X chromosome--a near normal phenotype in mice versus Turner syndrome and multiple abnormalities in humans. We found that escape genes are marked by the absence of trimethylation at lysine 27 of histone H3, a chromatin modification associated with genes subject to X inactivation. Furthermore, this epigenetic mark is developmentally regulated for some mouse genes.


Figures

Figure 1.
Figure 1.
RNA-seq identification of four novel escape genes (Ddx3x, Shroom4, Car5b, 2610029G23Rik). The escape genes are shown with six adjacent genes subject to X inactivation (Usp9x, Cask, Ccnb3, Zrsr2, Siah1b, Magee1). (A) RNA-seq data are graphed as the sequence read ratio (orange bars) between BL6 (inactive X) and M. spretus (active X) at each SNP (short, dark-blue bars) identified in the four escape genes (filled in orange). A few SNPs had ratios higher than those at the maximum scale (Supplemental Table S1). Flanking genes subject to X inactivation (filled in light blue) have very low BL6/spretus ratios. The inactivation status of the genes filled in gray is unknown due to the absence of expressed SNPs. Data were uploaded into the UCSC Genome Browser (Mouse July 2007 [mm9] assembly). (Top) Chromosome X coordinates. (B) Validation of SNPs and of bi-allelic expression of the escape genes by conventional sequencing of PCR and RT-PCR products. Chromatograms are shown for genomic DNA and cDNA with SNP coordinate underneath. (Arrows) Heterozygous bases. (C) Quantification of escape level of Shroom4 and Car5b. Genomic DNA and cDNA were amplified by PCR, followed by restriction endonuclease digestion. Products were separated by gel electrophoresis as shown in the gel pictures (SNP coordinate on top). (S) M. spretus DNA; (SD) M. spretus DNA digested; (B) BL6 DNA; (BD) BL6 DNA digested; (P) Patski genomic DNA; (PD) Patski genomic DNA digested; (Pc) Patski cDNA; (PcD) Patski cDNA digested. Graphs at right of the gels show relative expression levels from the inactive X (Xi) versus the active X (Xa) after real-time qPCR analyses.
Figure 2.
Figure 2.
RNA-seq identification and conventional sequencing validation of the X-inactivation status of mouse genes. (A) Four genes previously known to escape X inactivation (Kdm5c, Kdm6a, Eif2s3x, Mid1; filled in orange) correctly identified by RNA-seq; (B) four examples of genes subject to X inactivation (Huwe1, Ubqln2, Hs6st2, Hmgn5; filled in light blue) identified by RNA-seq. (Left) RNA-seq data are graphed as the sequence read ratio (orange bars) between BL6 (inactive X) and M. spretus (active X) at each SNP (short, dark-blue bars). A few SNPs had ratios higher than those at the maximum scale (Supplemental Table S1). Data were uploaded into UCSC Genome Browser (Mouse July 2007 [mm9] assembly). (Top) Chromosome X coordinates. (Right) Validation of SNPs and of bi-allelic (A) or mono-allelic (B) gene expression by conventional sequencing of PCR and RT-PCR products. Chromatograms are shown for both genomic DNA and cDNA with SNP coordinate underneath. (Arrows) Heterozygous bases.
Figure 3.
Figure 3.
Distribution of escape genes on the mouse X chromosome. The ratio between RNA-seq reads from BL6 (inactive X) and M. spretus (active X) is graphed for each gene against its location (UCSC Genome Browser, Mouse July 2007 [mm9] assembly). (Red) Genes with an average expression level from the inactive X higher than 10% of the active X; (dark blue) other genes. Underneath, an ideogram of the mouse X chromosome indicates regions that correspond to evolutionary strata (1, 2, 3, and 5) defined in human (Ross et al. 2005). Genes in strata 4 are apparently deleted in mouse. (Cen) Centromere; (PAR) pseudoautosomal region.
Figure 4.
Figure 4.
Mouse escape genes are not clustered in domains. Six mouse escape genes with surrounding regions are each aligned with the corresponding human region underneath. CXorf38 is the corresponding human gene to 1810030O07Rik. 4930578C19Rik was previously found to be subject to X inactivation, while CXorf36 escapes X inactivation (DK Nguyen and CM Disteche, unpubl.). The size of regions with no known genes is indicated.
Figure 5.
Figure 5.
H3K27me3 is usually depleted at escape genes in female tissues. (A–D) Escape genes Kdm5c, Kdm6a, Ddx3x, and 2610029G23Rik are completely devoid of H3K27me3 in female tissues, while adjacent genes subject to X inactivation (e.g., Iqsec2, Magee1, Usp9x) are enriched. (E–F) Depletion in H3K27me3 at escape genes Mid1 and Shroom4 differs between tissues/developmental stages. (FL) Female liver; (FE) female embryos; (ML) male liver; (ME) male embryos. ChIP-chip peak files were uploaded in the UCSC Genome Browser (Mouse July 2007 [mm9] assembly). (Top) X chromosome coordinates. Escape genes are filled in orange, and inactive genes in light blue. (Arrow) Transcription direction. (G) H3K27me3 enrichment at the 5′ end of genes subject to X inactivation is higher than at escape genes in female liver. Average H3K27me3 enrichment for genes subject to X inactivation (366 genes; light blue curve) is compared to average enrichment for escape genes (10 genes; orange curve). Data are shown as log2 of the signal ratio between ChIP and input fractions for 3 kb upstream and 3 kb downstream of the transcription start site (black arrow).

References

    1. Agulnik AI, Mitchell MJ, Mattei MG, Borsani G, Avner PA, Lerner JL, Bishop CE 1994. A novel X gene with a widely transcribed Y-linked homologue escapes X-inactivation in mouse and human. Hum Mol Genet 3: 879–884 - PubMed
    1. Babak T, Deveale B, Armour C, Raymond C, Cleary MA, van der Kooy D, Johnson JM, Lim LP 2008. Global survey of genomic imprinting by transcriptome sequencing. Curr Biol 18: 1735–1741 - PubMed
    1. Bondy CA 2009. Turner syndrome 2008. Horm Res 71 (Suppl 1): 52–56 - PubMed
    1. Borsani G, Tonlorenzi R, Simmler MC, Dandolo L, Arnaud D, Capra V, Grompe M, Pizzuti A, Muzny D, Lawrence C, et al. 1991. Characterization of a murine gene expressed from the inactive X chromosome. Nature 351: 325–329 - PubMed
    1. Brockdorff N, Ashworth A, Kay GF, Cooper P, Smith S, McCabe VM, Norris DP, Penny GD, Patel D, Rastan S 1991. Conservation of position and exclusive expression of mouse Xist from the inactive X chromosome. Nature 351: 329–331 - PubMed

Publication types

Associated data