. 2024 Nov 4;15(1):9520.
doi: 10.1038/s41467-024-51719-6.

CTLA-4 expressing innate lymphoid cells modulate mucosal homeostasis in a microbiota dependent manner

Affiliations

CTLA-4 expressing innate lymphoid cells modulate mucosal homeostasis in a microbiota dependent manner

Jonathan W Lo et al. Nat Commun. .

Abstract

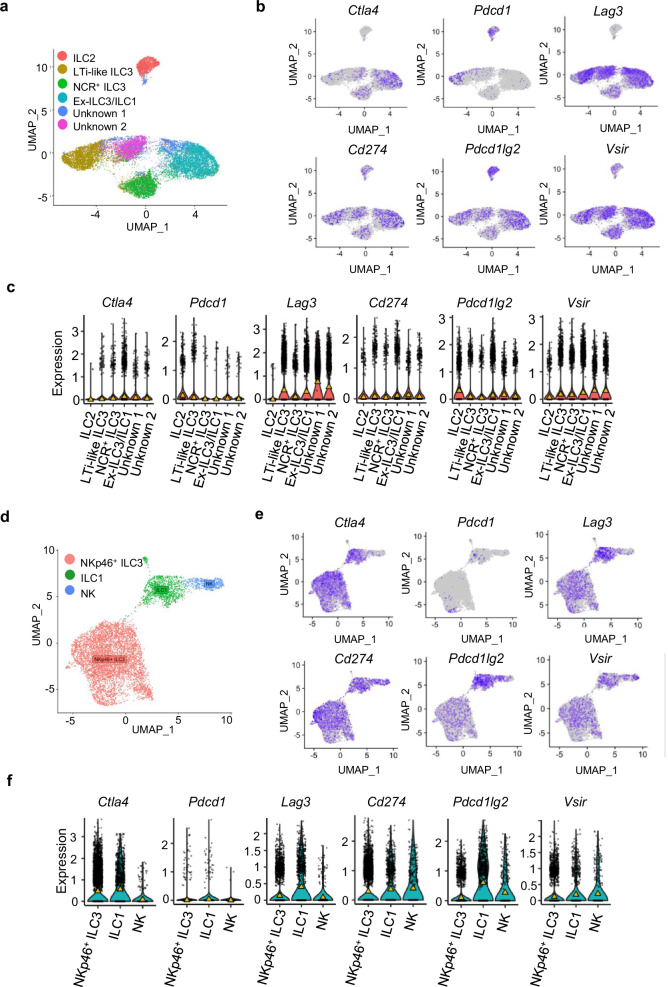
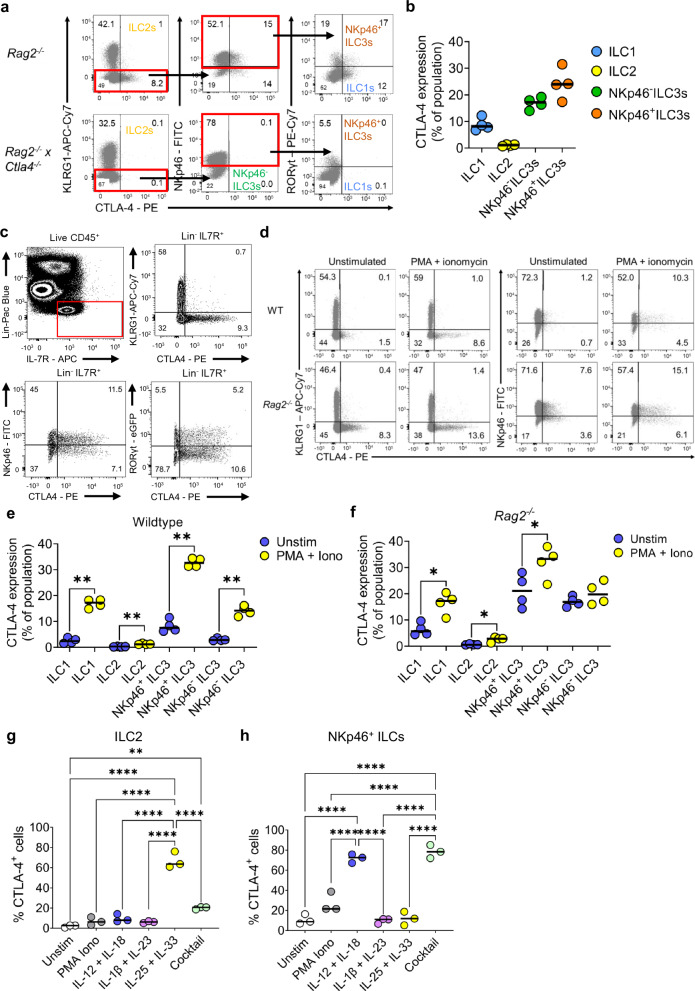
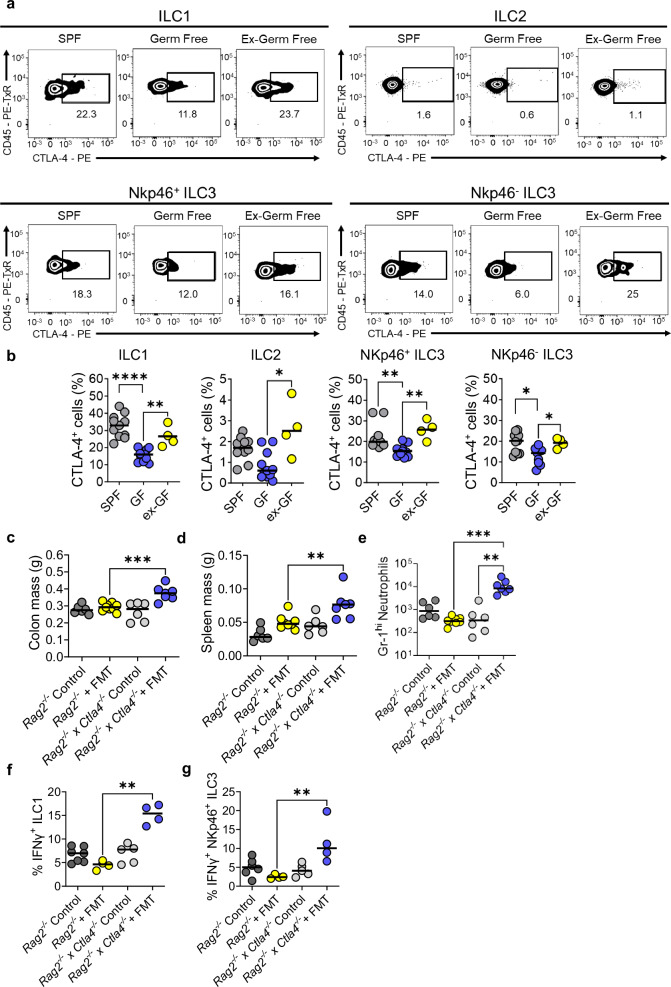
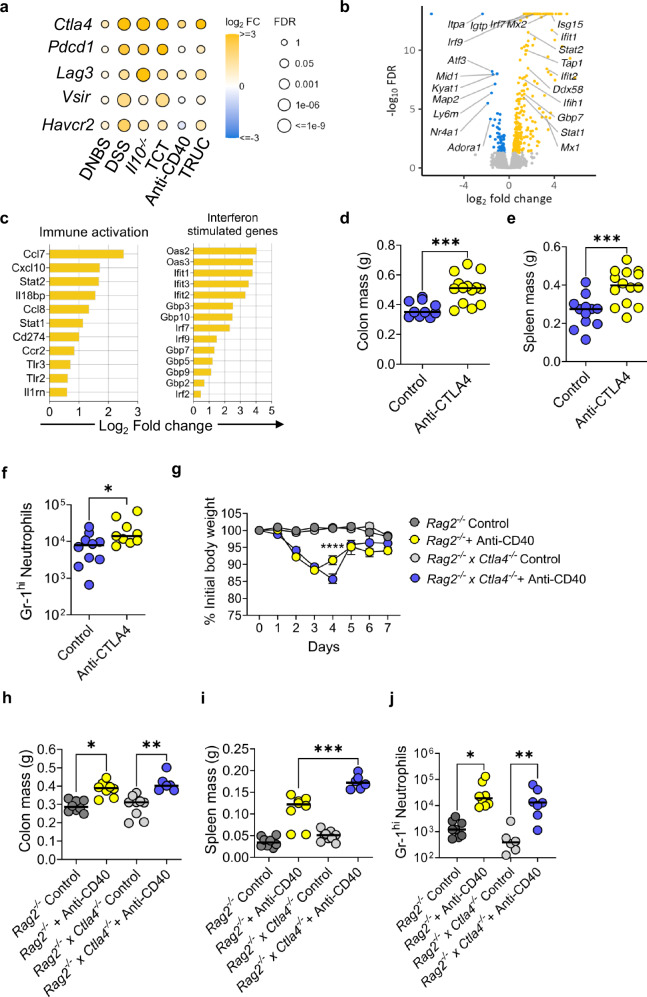
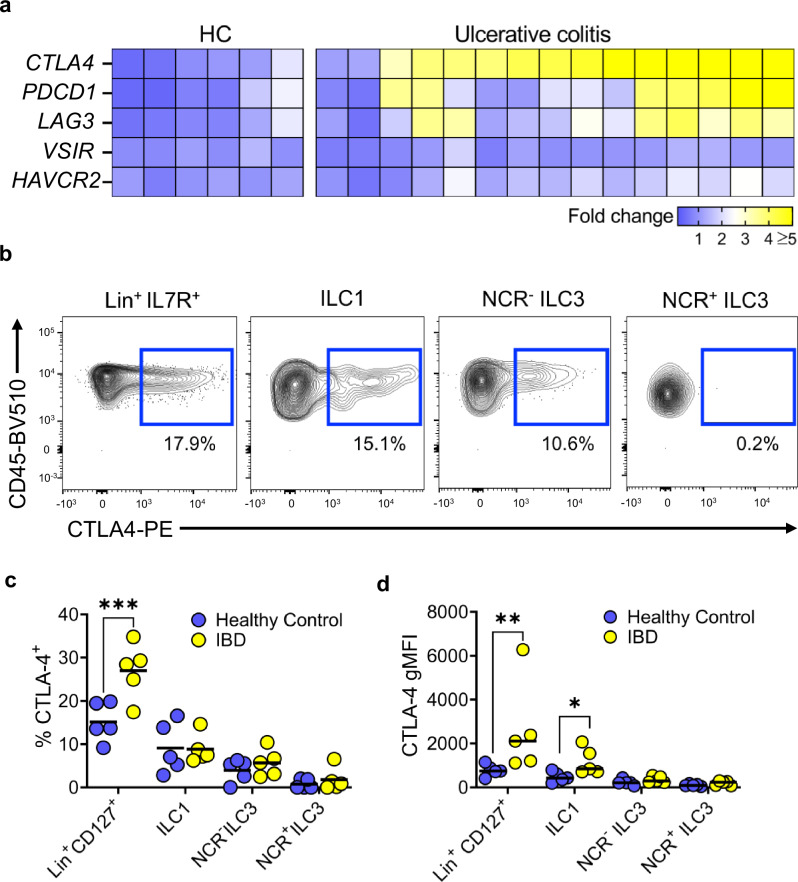
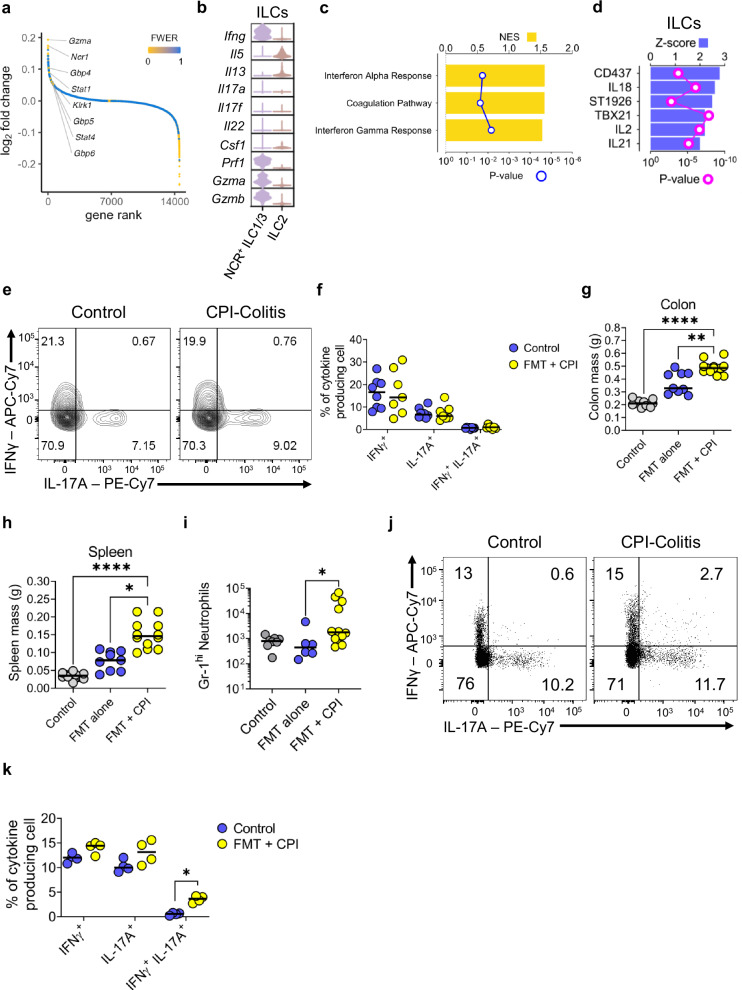
The maintenance of intestinal homeostasis is a fundamental process critical for organismal integrity. Sitting at the interface of the gut microbiome and mucosal immunity, adaptive and innate lymphoid populations regulate the balance between commensal micro-organisms and pathogens. Checkpoint inhibitors, particularly those targeting the CTLA-4 pathway, disrupt this fine balance and can lead to inflammatory bowel disease and immune checkpoint colitis. Here, we show that CTLA-4 is expressed by innate lymphoid cells and that its expression is regulated by ILC subset-specific cytokine cues in a microbiota-dependent manner. Genetic deletion or antibody blockade of CTLA-4 in multiple in vivo models of colitis demonstrates that this pathway plays a key role in intestinal homeostasis. Lastly, we have found that this observation is conserved in human IBD. We propose that this population of CTLA-4-positive ILC may serve as an important target for the treatment of idiopathic and iatrogenic intestinal inflammation.


Conflict of interest statement

The authors declare no competing interests.

Figures

Fig. 1
Fig. 1. The immune checkpoint transcriptional landscape across intestinal ILC clusters.
a UMAP plot showing the six ILC populations previously identified from CD45+ Lin CD127+ sorted cells by Fiancette et al. b UMAP plots and (c) violin plots showing the expression of canonical immune checkpoint inhibitory molecules across the six identified ILC subsets (median shown by the yellow triangle). Cell counts for each clusters are: ILC2 1468, LTi-like ILC3 3736, NCR+ ILC3 2984, Ex-ILC3/ILC1 5241, Unknown (1) 1115 and Unknown (2) 2412 (d) UMAP plot showing the three populations of NKp46+ sorted cells previously identified by Krzywinska et al. e UMAP plots and (f) violin plots showing the expression of canonical immune checkpoint inhibitory molecules across the three identified ILC populations (median shown by the yellow triangle). Cell counts for the clusters identified here were: NKp46+ ILC3 5739, ILC1 1261 and NK 462.
Fig. 2
Fig. 2. CTLA-4 is present on ILC2s and NCR+ ILCs.
a Representative flow cytometry plots and (b) summary dot plots from BALB/c Rag2−/− (n = 4) and BALB/c Rag2−/− x Ctla4−/− mice (n = 4) showing the proportion of CTLA-4-expressing cLP ILC1, ILC2, NKp46+ ILC3s and NKp46- ILC3 cells. c Flow cytometry plot showing CTLA-4 in the lamina propria of the colon of BALB/c WT mice and C57BL/6 RORγt-eGFP mice. LPMC were stimulated with PMA, ionomycin and monensin for 4 h. d Representative flow cytometry plots and (e) summary dot plots from BALB/c WT mice (n = 4) and (f) BALB/c Rag2−/− mice (n = 4) showing the proportion of CTLA-4-positive KLRG1 and NKp46 ILC upon stimulation with PMA and ionomycin. Both e and f used RM one-way ANOVA test with Holm-Sidak’s multiple comparison, where * P = 0.0215 and ** P = 0.0033 (g) KLRG1+ (n = 3) and (h) NKp46+ KLRG1- cLP ILC (n = 3) were FACS sorted and cultured with OP9-DL1 for 48 hrs in the presence of rIL7, rIL2 and rIL-15 (unstim), with the addition of either PMA and ionomycin, rIL-12 and rIL-18, rIL-1β and rIL-23, rIL-25 and rIL-33, or rIL-12, rIL-18, rIL-1β, rIL-6, rIL-27 and rTGF-β (cocktail). The proportion of CTLA-4-positive KLRG1+ CD90.2+ and KLRG1- NKp46+ CD90.2+ cLP ILC was measured upon seeding KLRG1+ and KLRG1- cLP ILC, respectively. Both g and h used one-way ANOVA test with Holm-Sidak’s multiple comparison * P = 0.0111 ** P = 0.0015 **** P < 0.0001. All experimental n in Fig. 2 are biologically independent mouse samples.
Fig. 3
Fig. 3. ILC express CTLA-4 in a microbiota-dependent manner.
a Representative flow plots and (b) summary statistics showing the percentage of different ILC subsets (ILC1s, ILC2s, NCR+ ILC3s and NCR- ILC3s) that are positive for CTLA-4 in specific pathogen free (SPF) (n = 11), germ-free (GF) conditions (n = 11) and GF mice, which have been gavaged with SPF microbiota (ex-GF) (n = 4). One-sided Kruskal-Wallis Test with Dunn’s multiple comparison * P = 0.0106 ** P = 0.0048 **** P < 0.0001 (c) Colon, (d) spleen masses and (e) infiltrating Gr-1+ neutrophils between control BALB/c Rag2−/− (n = 6), FMT treated BALB/c Rag2−/− (n = 9), control BALB/c Rag2−/− x Ctla4−/− (n = 6) or FMT treated BALB/c Rag2−/− x Ctla4−/− (n = 7) ** P = 0.0037 *** P = 0.0007 One-sided Kruskal-Wallis Test. f IFNγ production from ILC1s (g) or NKp46+ ILC3s between control BALB/c Rag2−/− (n = 7), FMT treated BALB/c Rag2−/−(n = 4), control BALB/c Rag2−/− x Ctla4−/− (n = 5) or FMT treated BALB/c Rag2−/− x Ctla4−/− (n = 4) upon restimulation with PMA and ionomycin for 3 h. ** P = 0.0039 for f and P = 0.0052 for g using one-sided Kruskal-Wallis Test with Dunn’s multiple comparison. All experimental n in Fig. 3 are biologically independent mouse samples.
Fig. 4
Fig. 4. CTLA-4 restrains innate immune activation in colitis.
a Heatmap of the changes in immune checkpoint expression in distal colon segments taken from different models of colitis (Il10−/− (n = 3), DSS (n = 4), T cell transfer (n = 4), DNBS (n = 4), TRUC (n = 4) and anti-CD40 (n = 4)) compared to control mice (controls were: WT mice (n = 4) for Il10−/−, DSS and DNBS models; Rag2−/− mice (n = 4) for T cell transfer, TRUC and anti-CD40 models. b Volcano plot showing the gene expression profile of distal colon segments taken from BALB/c Rag2−/− x Ctla4−/− mice (n = 4) compared to BALB/c Rag2−/− mice (n = 4). Positive log2 fold-changes indicate upregulation in Rag2−/− x Ctla4−/− mice, while negative log2 fold-changes indicate upregulation in Rag2−/− mice. c The most significantly upregulated differentially expressed genes involved in immune activation and interferon-stimulated genes from colon segments taken from Rag2−/− x Ctla4−/− mice (n = 4) compared to Rag2−/− mice (n = 4). d Colon mass, (e) spleen mass and (f) infiltrating Gr-1+ neutrophils between TRUC untreated mice (control) (n = 12) compared to TRUC mice treated with anti-CTLA-4 (n = 14) * P = 0.035 *** P = 0.0005 Two-tailed Mann Whitney U test. g weight change (with SEM) P < 0.0001 2-way ANOVA Test performed, (h) colon mass, (i) spleen mass and (j) infiltrating Gr-1+ neutrophils between control untreated BALB/c Rag2−/− mice (n = 8), BALB/c Rag2−/− mice treated with anti-CD40 (n = 8), untreated BALB/c Rag2−/− x Ctla4−/− mice (n = 9 for (h and i), n = 6 for (j) and BALB/c Rag2−/− x Ctla4−/− mice treated with anti-CD40 (n = 6 for (h and i,) n = 7 for (j) * P = 0.0165 ** P = 0.0036 *** P = 0.0005 One-sided Kruskal-Wallis Test with Dunn’s multiple comparison. All experimental n in Fig. 4 are biologically independent mouse samples.
Fig. 5
Fig. 5. CTLA-4+ ILC1 are present in IBD patients.
a Heatmap showing immune checkpoint molecule expression in the sigmoid colon of healthy patients (HC) (n = 6) and patients with ulcerative colitis (n = 15). b Representative flow plots and (c) summary statistics showing the percentage of different ILC subsets (ILC1s, NCR+ ILC3s and NCR- ILC3s) from patients with IBD (n = 5) and healthy controls (n = 5) that were positive for CTLA-4 after treatment with PMA, ionomycin and monensin for 3 h. *** P = 0.0002 2-way ANOVA with Šídák’s multiple comparisons Test. Lineage+ IL-7R+ shown as a positive control for CTLA-4 staining on bulk T cells. d Dot plot showing the CTLA-4 gMFI in different ILC subsets (ILC1, NCR+ ILC3 and NCR- ILC3) in patients with IBD (n = 5) compared with healthy controls (n = 5) * P = 0.0423 ** P = 0.0036 2-way ANOVA with Šídák’s multiple comparisons Test. All experimental n in Fig. 5 are biological independent human samples.
Fig. 6
Fig. 6. NCR+ ILC are expanded in CPI-colitis.
a Distribution of gene expression changes in ILC clusters (ILC2s and NCR+ ILC1/3 s) from mice with CPI-induced colitis (n = 3) vs those from control wild-type BALB/c mice (n = 3). Gene were ranked by decreasing log fold changes and shown as circled coloured according to the associated false discovery rate. b Violin plots showing the expression levels of cytokines across the two ILC clusters in wild-type BALB/c control mice (n = 3) and mice with CPI-induced colitis (n = 3). c Pathways, identified by scanning the Hallmark gene signature dataset using GSEA, significantly upregulated (FDR < 0.05) in the two ILC clusters in mice with CPI-induced colitis (n = 3) vs control mice (n = 3). d Upstream regulators predicted to mediate the gene expression changes in CPI-induced colitis vs control samples from both ILC clusters. e Representative flow cytometry plots and (f) summary dot plot showing IFNγ and IL-17A cytokine production from Lin- IL-7R+ ILCs in wild-type mice treated with CPI-colitis (n = 7) compared to untreated mice (n = 8). The cells were restimulated with PMA and ionomycin for 3 h prior to analysis. g Colon and (h) spleen mass in untreated Rag2−/− mice (n = 12) and Rag2−/−mice given FMT only (n = 11) or FMT + CPI (n = 12). * P = 0.0413 ** P = 0.0022 **** P < 0.0001 Kruskal-Wallis Test with Dunn’s multiple comparison. i Gr-1+ neutrophil infiltration between untreated Rag2−/− mice (n = 8) and Rag2−/− mice given FMT only (n = 6) or FMT + CPI (n = 12). * P = 0.0366 Kruskal-Wallis Test with Dunn’s multiple comparison. j Representative flow cytometry plots and (k) summary dot plot showing IFNγ and IL-17A cytokine production from Lin- IL-7R+ ILCs in Rag2−/− mice treated with CPI-colitis (n = 4) compared to untreated control mice (n = 4). The cells were restimulated with PMA and ionomycin for 3 h prior to analysis. * P = 0.0286 Multiple Mann Whitney U Test. All experimental n in Fig. 6 are biologically independent mouse samples.

References

    1. Guntermann, C. & Alexander, D. R. CTLA-4 suppresses proximal TCR signaling in resting human CD4+ T cells by inhibiting ZAP-70 Tyr319 phosphorylation: a potential role for tyrosine phosphatases. J. Immunol.168, 4420–4429 (2002). - PubMed
    1. Kong, K.-F. et al. Protein kinase C-η controls CTLA-4–mediated regulatory T cell function. Nat. Immunol.15, 465–472 (2014). - PMC - PubMed
    1. Krummel, M. F. & Allison, J. P. CD28 and CTLA-4 have opposing effects on the response of T cells to stimulation. J. Exp. Med.182, 459–465 (1995). - PMC - PubMed
    1. Qureshi, O. S. et al. Constitutive Clathrin-mediated endocytosis of CTLA-4 persists during T cell activation. J. Biol. Chem.287, 9429–9440 (2012). - PMC - PubMed
    1. Buchbinder, E. I. & Desai, A. CTLA-4 and PD-1 pathways: similarities, differences, and implications of their inhibition. Am. J. Clin. Oncol.39, 98–106 (2016). - PMC - PubMed

Publication types

MeSH terms

Associated data

LinkOut - more resources