. 2023 Dec 19;14(1):8444.
doi: 10.1038/s41467-023-44126-w.

RBFOX2 deregulation promotes pancreatic cancer progression and metastasis through alternative splicing

Affiliations

RBFOX2 deregulation promotes pancreatic cancer progression and metastasis through alternative splicing

Michelle Maurin et al. Nat Commun. .

Abstract

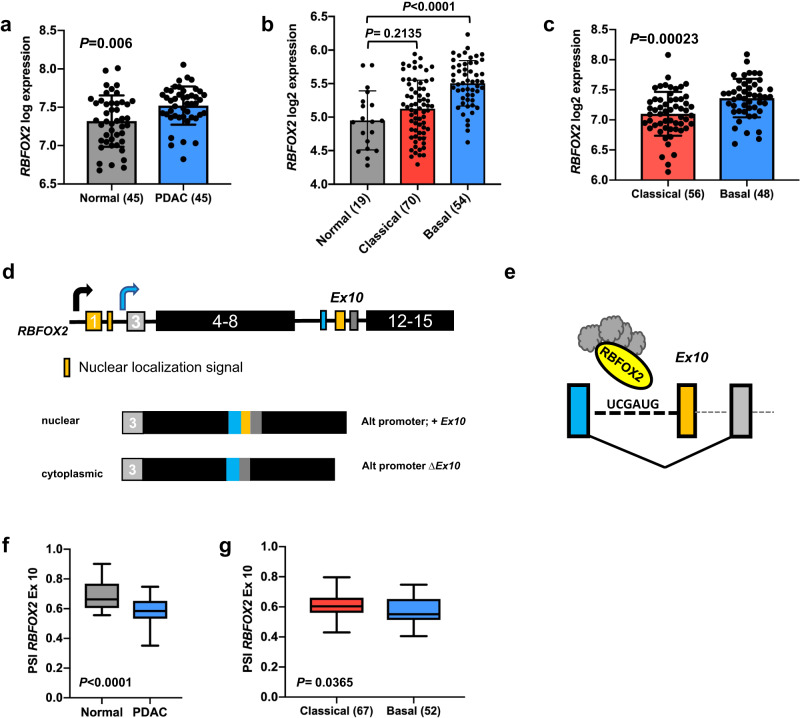
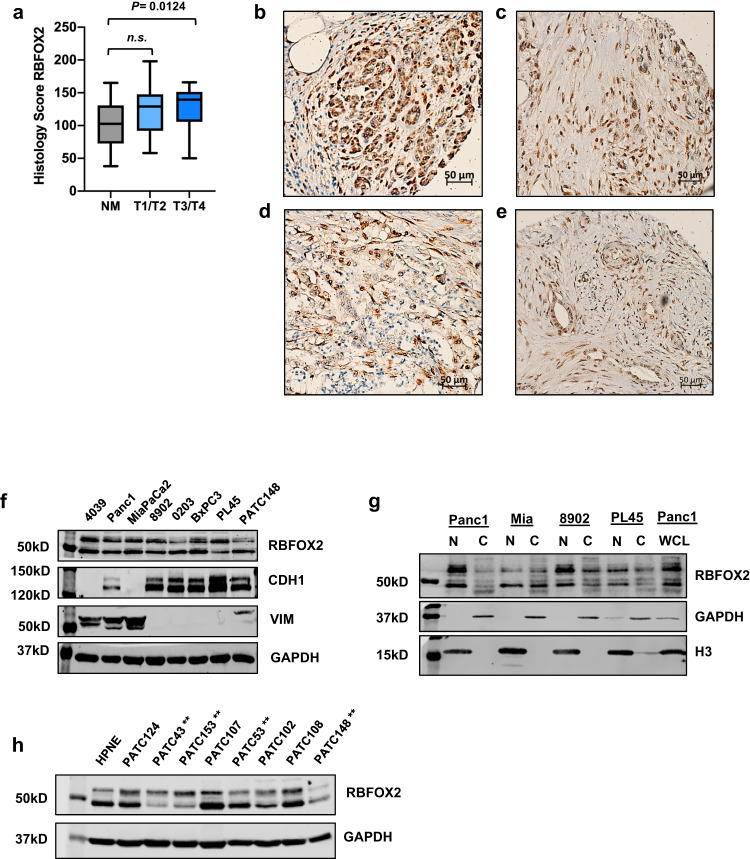
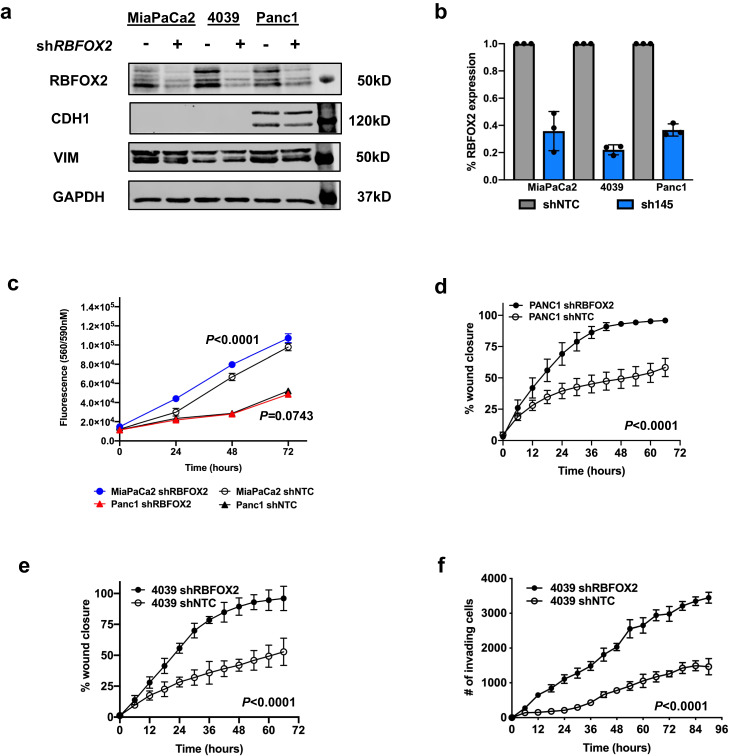
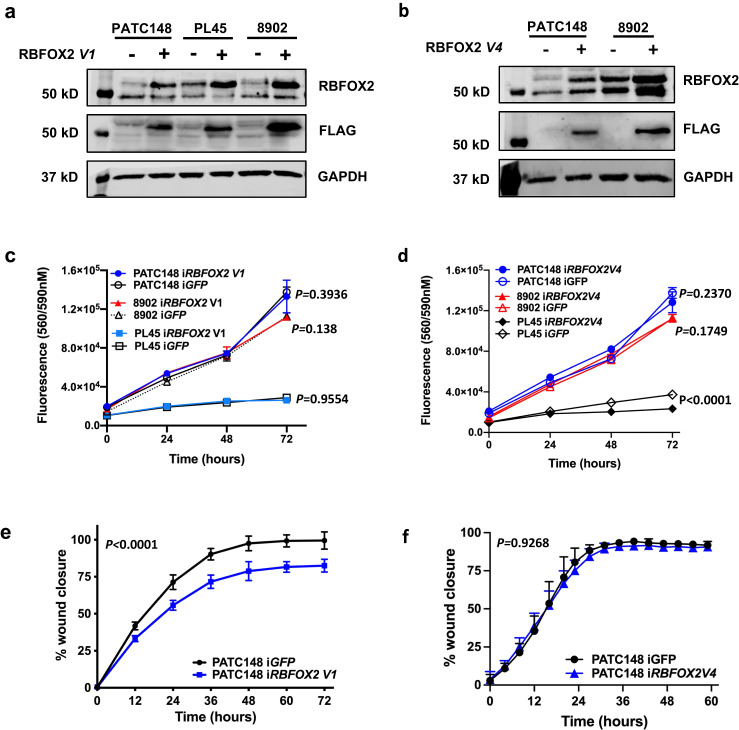
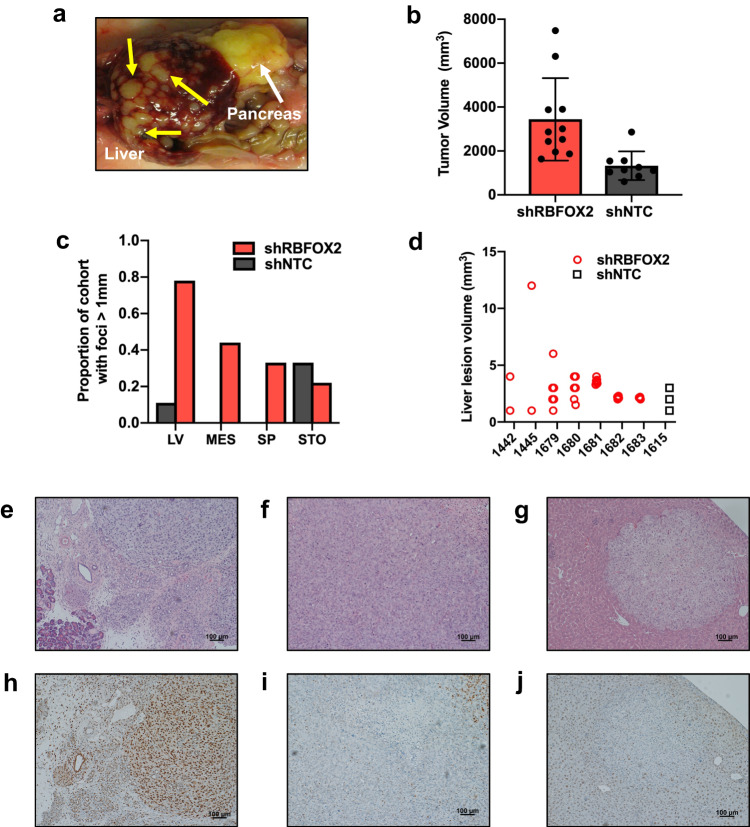
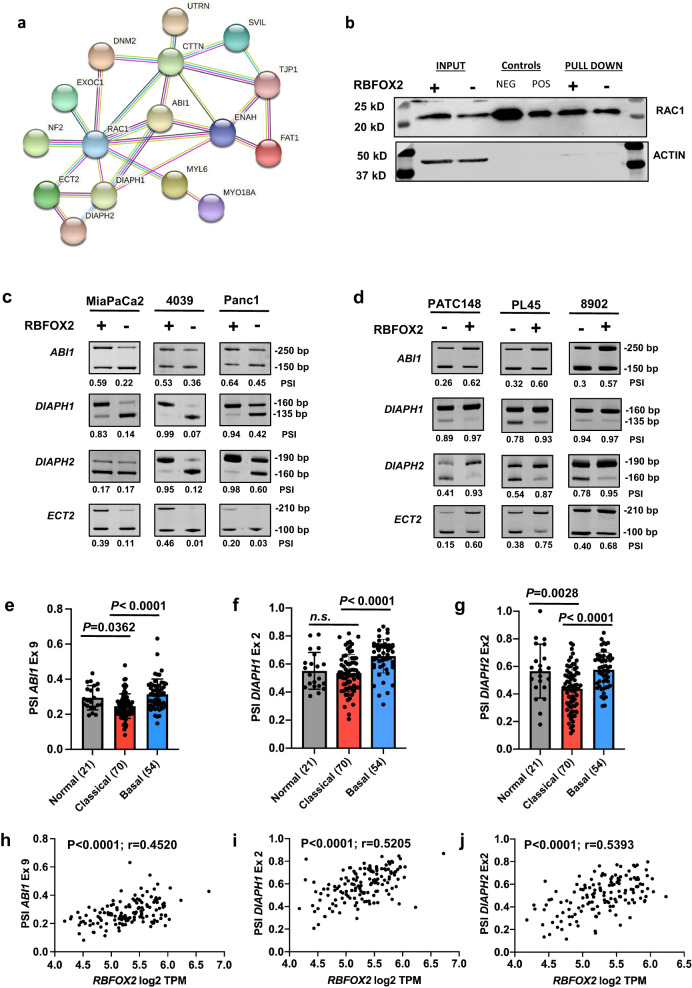
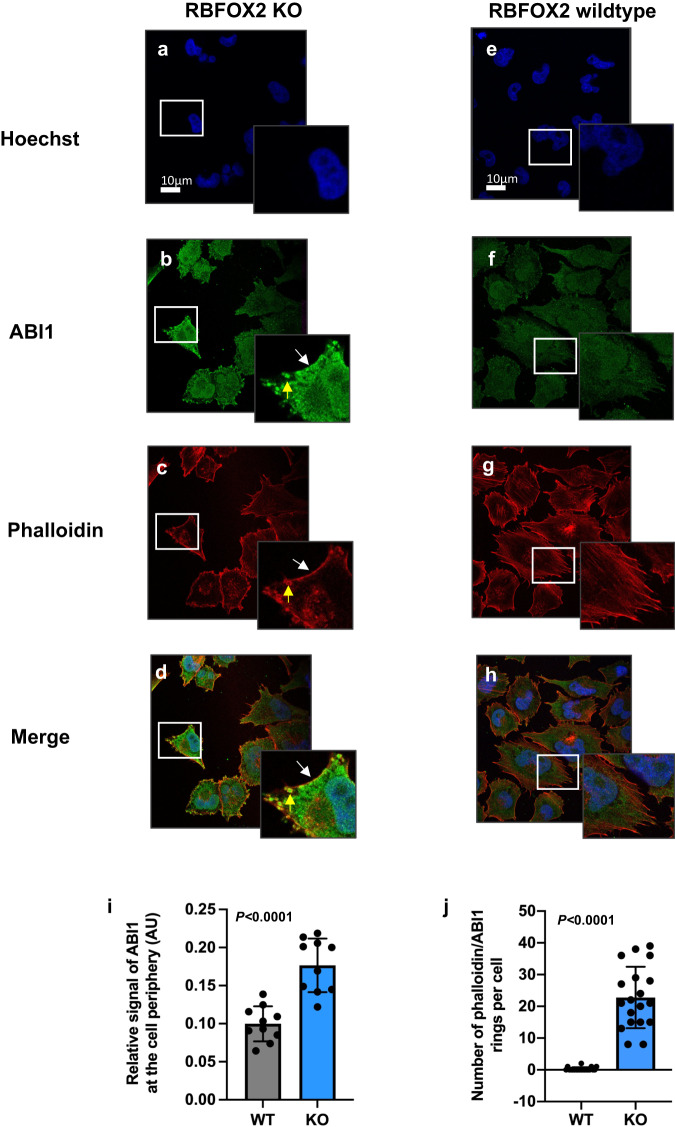
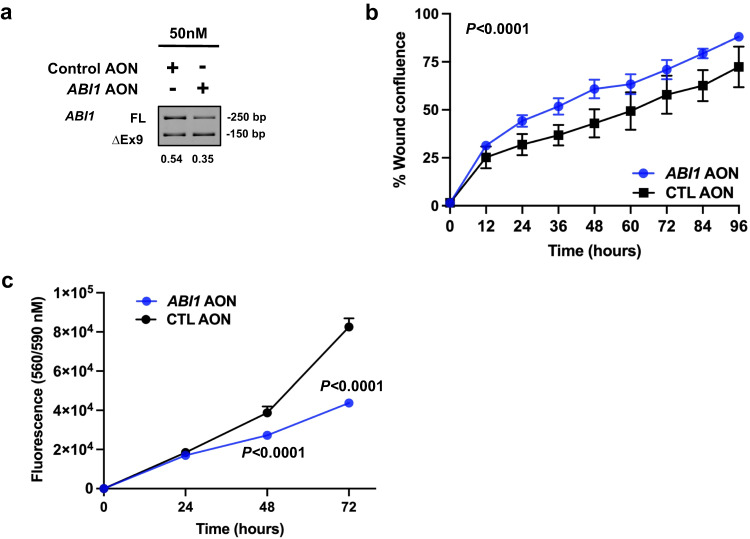
RNA splicing is an important biological process associated with cancer initiation and progression. However, the contribution of alternative splicing to pancreatic cancer (PDAC) development is not well understood. Here, we identify an enrichment of RNA binding proteins (RBPs) involved in splicing regulation linked to PDAC progression from a forward genetic screen using Sleeping Beauty insertional mutagenesis in a mouse model of pancreatic cancer. We demonstrate downregulation of RBFOX2, an RBP of the FOX family, promotes pancreatic cancer progression and liver metastasis. Specifically, we show RBFOX2 regulates exon splicing events in transcripts encoding proteins involved in cytoskeletal remodeling programs. These exons are differentially spliced in PDAC patients, with enhanced exon skipping in the classical subtype for several RBFOX2 targets. RBFOX2 mediated splicing of ABI1, encoding the Abelson-interactor 1 adapter protein, controls the abundance and localization of ABI1 protein isoforms in pancreatic cancer cells and promotes the relocalization of ABI1 from the cytoplasm to the periphery of migrating cells. Using splice-switching antisense oligonucleotides (AONs) we demonstrate the ABI1 ∆Ex9 isoform enhances cell migration. Together, our data identify a role for RBFOX2 in promoting PDAC progression through alternative splicing regulation.


Conflict of interest statement

The authors declare no competing interests.

Figures

Fig. 1
Fig. 1. RBFOX2 is differentially expressed and alternatively spliced in pancreatic cancer.
RBFOX2 expression analysis using microarray data from GEO dataset GSE28735 showed a significant increase in RBFOX2 expression in tumors (n = 45) compared to normal pancreas (n = 45) (a FDR adj. P = 0.006, two-sided t-test). Gene expression analysis of CPTAC RNA-seq data generated from normal pancreas and resected pancreatic cancer specimens showed RBFOX2 gene expression is significantly higher in tumors of the basal subtype (n = 54) compared to normal pancreas (n = 19) (b adj. P < 0.0001, ordinary one-way ANOVA with Tukey’s multiple comparisons, DF = 138) and no difference between normal pancreas and the classical subtype (n = 70) (adj. P = 0.2135, two-sided t-test). RBFOX2 expression is significantly increased in basal (n = 48) compared to classical (n = 56) PDAC in RNA-seq data from E-MTAB-6830 (c Wilcoxon Rank-sum test, P = 0.00023). The canonical full length RBFOX2 transcript includes two N-terminal two exons encode an N-terminal nuclear localization signal, while downstream exon 10 (ENSG00000100320:015) encodes an internal NLS (d). RBFOX2 transcripts in the pancreas utilize an internal start codon present in exon 3 and lack the N-terminal exons. RBFOX2 transcripts show alternative splicing of exon 10 in mature transcripts. The RBFOX2 recognition sequence UCGAUG is present upstream of exon 10 (e). RBFOX2 binding at this site is predicted to facilitate skipping of exon 10 in mature transcripts. Analysis of percent spliced-in (PSI), a measure of exon inclusion, for alternatively spliced RBFOX2 exon 10 in RBFOX2transcripts shows a significant increase in the inclusion of exon 10 in normal pancreas (n = 20) compared to PDAC (n = 136), (f CPTAC, P < 0.0001, 2-tailed t-test, t = 4.700, df=159). RBFOX2 exon 10 PSI was significantly different between classical and basal PDAC tumors (g CPTAC, P = 0.0365, 2-tailed t-test, t = 2.115, df=117). Samples ±2 SD from the population mean were removed prior to statistical analysis. Data are presented as mean values +/- SD. The box plots define the 25th and 75th percentiles (box), median (solid line) and the minima and maxima (whiskers). Statistical analysis was performed using PRISM and the P-values reported for the indicated statistical tests are shown. Source data are provided as a Source data file.
Fig. 2
Fig. 2. RBFOX2 abundance and localization in pancreatic cancer.
RBFOX2 abundance was quantified for non-malignant vs. IDC tumor stage, considering the number of positive nuclei and staining intensity, represented as histology score (a). Stage T3/T4 (n = 26) PDAC tumors had a significantly higher RBFOX2 histology score compared to NM (n = 60) pancreas (P = 0.0124, Welch’s ANOVA with Dunnett’s multiple comparisons test, t = 3.010, df=48.15). No significant difference was observed between NM and stage T1/T2 (n = 25) (P = 0.0542, t = 2.453, df=39.79). Representative images for RBFOX2 IHC are shown for NM (b, HS 118), T2 (c, HS 180) and T3 (d, HS 65 and e, HS 165). Scale bar is 50um. HS: Histology Score. In PDAC cell lines, RBFOX2 protein is detected as two distinct bands by western blot at 47kD and 53 kD, with differential intensity of the 53kD band across lines (f). Mesenchymal-like cell lines are characterized by expression of vimentin (VIM), and epithelial-like cell lines are characterized by expression of E-cadherin (CDH1). Cell fractionation shows RBFOX2 is predominantly nuclear in Panc1 and PL45 cells, while MiaPaCa2 (Mia) and 8902 cells exhibit both nuclear and cytoplasmic RBFOX2 localization (g). Histone H3 marks the nuclear fraction, while GAPDH marks the cytoplasmic fraction. Panc1 whole cell lysate (WCL) is run for comparison of RBFOX2 species and intensities. Western blot analysis of RBFOX2 in human cell lines derived from PDX models of PDAC (h) shows cell lines derived from PDXs of individual patients with liver metastasis (marked with **) have lower expression of RBFOX2. RBFOX2 in the immortalized human pancreatic ductal cell line HPNE is shown for comparison. The box plots define the 25th and 75th percentiles (box), median (solid line) and the minima and maxima (whiskers). ns: not significant. Western blots were performed in 3 independent experiments. Source data are provided as a Source data file.
Fig. 3
Fig. 3. RBFOX2 depletion drives aggressive cellular phenotypes.
ShRNA-mediated knock-down of RBFOX2 in mesenchymal-like PDAC cell lines MiaPaCa2, 4039 and Panc1 leads to a significant reduction in RBFOX2 protein (a) compared to cells stably transduced with a non-targeting shRNA (shNTC). No change in expression of epithelial marker CDH1 or mesenchymal marker vimentin (VIM) was observed with RBFOX2 knockdown. The percent of remaining RBFOX2 protein upon RBFOX2 knockdown (sh145) was determined from the average quantification of two cell passages examined in three independent experiments (b). MiaPaCa2 cells with RBFOX2 depletion (shRBFOX2) exhibited a slight but significant increase in cellular growth compared to control cells (shNTC) assessed using Cell Titer Blue assays (c, P < 0.0001, two-way ANOVA; DF = 3; F = 9.6); cell proliferation was unchanged in RBFOX2-depleted Panc1 cells (P = 0.0743, two-way ANOVA; DF = 3; F = 2.550). Cell migration is significantly increased upon RBFOX2 depletion in Panc1 cells (d, P < 0.0001, two-way ANOVA; DF = 23; F = 21.88) and in 4039 cells (e, P < 0.0001, two-way ANOVA; DF = 11; F = 22.99) using a wound healing assay. Cell invasion is significantly increased upon RBFOX2 depletion in 4039 cells (f, P < 0.0001, two-way ANOVA; DF = 15; F = 120) using an Incucyte chemotaxis assay. Data in panels c-f are representative of three independent experiments generated across three cell passages, with 6-8 technical replicates plated per line per experiment. Data are presented as the mean values +/- SD of the technical replicates from a single experiment. Statistical analysis was performed using PRISM and the P-values calculated for the indicated statistical tests are shown. Source data are provided as a Source data file.
Fig. 4
Fig. 4. Nuclear RBFOX2 repletion rescues cell migration in PDAC cells.
Inducible Flag-tagged nuclear RBFOX2 (V1) or cytoplasmic RBFOX2 (V4) cDNA isoforms reconstitute RBFOX2 protein levels in PATC148, PL45 and 8902 cells (a, b). Detection of the Flag-tag confirms expression of the exogenous cDNA. No change in proliferation was detected for cells expressing iRBFOX2 V1 compared to control cells (iGFP) grown on 2D (c). PATC148, P = 0.3936, DF = 3, F = 1.029; 8902 P = 0.138, DF = 3, F = 4.182; PL45 P = 0.9554, DF = 3, F = 6.716, two-way ANOVA). Induction of iRBFOX2 V4 did not change the proliferative capacity of 8902 or PATC148 cells but slightly decreased proliferation in PL45 cells (d). PATC148, P = 0.2370, DF = 3, F = 12.13; 8902 P = 0.1749, DF = 3, F = 1.766; PL45 P < 0.0001, DF = 3, F = 114.2, two-way ANOVA. Cell migration in PATC148 iRBFOX2 V1 cells was significantly decreased compared to PATC148 iGFP control cells using a wound-healing assay (e, P < 0.0001, DF = 6, F = 9.003, two-way ANOVA). Expression of RBFOX2 V4 does not change the migratory capacity of PATC148 cells in a wound healing assay (f, P = 0.9268, DF = 18, F = 0.5557, two-way ANOVA). Data in panels c-f are from individual representative experiments, with 6 technical replicates plated per line per experiment. Three independent experiments were performed across three cell passages. Data are presented as mean values +/- SD. Statistical analysis was performed using PRISM and the P-values reported for the indicated statistical tests are shown. Source data are provided as a Source data file.
Fig. 5
Fig. 5. RBFOX2 depletion drives aggressive pancreatic cancer in vivo.
Orthotopic injection of 4039 cells depleted for RBFOX2 promotes an aggressive disease in NSG mice (a). The pancreas tumor is labeled by the white arrow; multiple lesions in the liver are denoted by yellow arrows. Pancreas tumors derived from 4039 cells lacking RBFOX2 (n = 11, red bars) have an increased tumor volume compared to tumors derived from control cells (n = 9, black bars) (b). Data are combined from two independent experiments with randomly assigned male and female mice. Mice with RBFOX2-depleted cells exhibit a higher incidence of metastatic lesions to the liver (LV), mesentery (MES) and spleen (SP), quantified as the percent of mice with at least one metastatic focus measured > 1 mm at necropsy (c). The volume of liver lesions (mm3) collected at necropsy is graphed on a per-animal basis (d). Only one mouse from the control cohort exhibited liver lesions. Histological analysis by H&E staining of pancreas tumors from 4039 cells expressing the non-targeting shRNA (e) shows tumor with surrounding acinar cells. Pancreas tumors with RBFOX2 depletion (f) have little surrounding normal pancreas. H&E staining from an RBFOX2-depleted liver lesion (g). Analysis of RBFOX2 expression by immunocytochemistry demonstrates robust RBFOX2 expression in tumors from replete cells (h) and an absence of signal in RBFOX2 depleted pancreas tumor (i) and resulting liver metastasis (j). RBFOX2 expression is decreased in the normal liver compared to normal pancreas. STO= stomach. Scale bar is 100um. Data are presented as mean values +/- SD. Source data are provided as a Source data file.
Fig. 6
Fig. 6. RBFOX2 depletion promotes exon skipping in actin regulators.
RBFOX2 splicing targets are significantly enriched for protein interactions through RAC1 (a, STRING PPI P < 7.48E-14). Levels of GTP-bound RAC1 in Panc1 cells replete and depleted for RBFOX2 were unchanged using a GTP pulldown assay (b). Data are representative of three independent experiments generated across three cell passages. RT-PCR analysis of RBFOX2 target exons in ABI1, DIAPH1, DIAPH2 and ECT2 shows a shift towards exon exclusion in the absence of RBFOX2 in MiaPaCa2, 4039 and Panc1 isogenic cell line pairs (c). PSI values (Percent spliced-in) calculated for each isogenic pair quantify the decrease in transcripts encoding the long isoform (LF) upon RBFOX2 depletion. Reconstitution of RBFOX2 in PATC148, 8902 and PL45 cells promotes exon inclusion of RBFOX2 target exons in ABI1, DIAPH2 and ECT2 (d). PSI values quantify the increase in transcripts encoding the long mRNA isoform (LF). Splicing assays are representative of three independent RT-PCR assays with PSI quantitation across multiple cell passages. Comparison of RBFOX2 target exon PSI values in normal pancreas and PDAC subtypes using CPTAC RNA-seq data revealed differences in the population mean and variance. The mean PSI for ABI1 exon 9 in classical PDAC is significantly lower than for normal pancreas (e, P = 0.0362) and basal PDAC (P < 0.0001). The mean PSI for DIAPH1 exon 2 in classical PDAC is significantly lower than for basal PDAC (f, P < 0.0001) but not significantly different from normal pancreas. The mean PSI for DIAPH2 exon 2 in classical PDAC is significantly lower than for normal pancreas (g, P = 0.0028) and basal PDAC (P < 0.0001). P-values for each panel were calculated using one-factor ANOVA with Tukey’s multiple comparisons test. Data in bar graphs are presented as mean values +/- SD. RBFOX2 target exon abundance (calculated as PSI) positively correlates with RBFOX2 expression (log2 TPM) in the CPTAC RNA-seq data set for ABI1 exon 9 (n = 140 XY pairs) (h, Pearson’s correlation, P < 0.0001; r = 0.4520, 95% confidence interval 0.3093 to 0.5748), DIAPH1 exon 2 (n = 140 XY pairs) (i, Pearson’s correlation, P < 0.0001; r = 0.5205, 95% confidence interval 0.3881 to 0.6318) and DIAPH2 exon 2 (n = 139 XY pairs) (j, Pearson’s correlation, P < 0.0001; r = 0.5393, 95% confidence interval 0.4096 to 0.6476). P-values are reported exactly as computed by PRISM. Source data are provided as a Source data file.
Fig. 7
Fig. 7. RBFOX2 loss promotes ABI1 cellular redistribution in PDAC cells.
MiaPaCa2 cells with CRISPR-mediated RBFOX2 depletion (panels ad) exhibit a redistribution of ABI1 (b) to the periphery of cells (see inset, white arrow) and coincident with F-actin (c, see inset, white arrow). The formation of actin into ring-like structures at the cell periphery was distinctive in RBFOX2 deficient cells (c; see inset, yellow arrow indicates actin ring). The merged image (d) shows overlap between ABI1 and F-actin at the cell periphery (inset, white arrow) and in actin rings (inset, yellow arrow). In contrast, RBFOX2-replete cells (panels eh) exhibit a uniform distribution of ABI1 throughout the cell (f) and filamentous F-actin (g). The merged image (h and inset) shows no overlap of ABI1 and F-actin at the cell periphery and the absence of actin ring-like structures. Nuclei were stained using Hoechst 33342 (a, b). g Quantification of the relative ABI1 signal at the cell periphery (I, arbitrary units (AU)) shows significantly increased ABI1 in RBFOX2 depleted (KO) cells (n = 10) compared to RBFOX2 replete (WT) cells (n = 10; P < 0.0001, t-test; t = 5.770, df=18). The number of phalloidin/ABI1 rings is significantly increased in RBFOX2 depleted (KO) cells (n = 19) compared to RBFOX2 replete (WT) cells (n = 20; j, P < 0.0001, t-test; t = 10.42, df=37). Data are presented as mean values +/- SD. Scale bar is 10um. P-values are reported exactly as computed by PRISM. Source data are provided as a Source data file.
Fig. 8
Fig. 8. ABI1 isoform-switching promotes migration in Panc1 cells.
Splice-switching antisense oligonucleotides (AONs) were designed to target ABI1 exon 9 in pre-mRNA transcripts to enrich for processed transcripts lacking the exon. Panc1 cells transfected with 50 nM ABI1 AON show a similar ∆PSI observed with RBFOX2 depletion (a). Panc1 cells treated with 50 nM ABI1 AON migrated significantly faster than cells with 50 nM control AON using a wound healing assay (b P < 0.0001, DF = 8, F = 8.575, two-way ANOVA) but showed significantly decreased cellular proliferation compared to cells transfected with a control AON (c P < 0.0001, t = 11.93, DF = 24 (48 hrs) and t = 40.49, DF = 24 (72 hrs), two-way ANOVA). Data in panel b is representative of three independent experiments generated across three cell passages, with 4–6 technical replicates plated per line per experiment. Data in panel c is representative of three independent experiments generated across three cell passages, with 6–8 technical replicates plated per line per experiment. Data are presented as mean values +/- SD. Statistical analysis was performed using PRISM and the P-values reported for the indicated statistical tests are shown. Source data are provided as a Source data file.

References

    1. Connor AA, et al. Integration of genomic and transcriptional features in pancreatic cancer reveals increased cell cycle progression in metastases. Cancer Cell. 2019;35:267–282 e7. doi: 10.1016/j.ccell.2018.12.010. - DOI - PMC - PubMed
    1. Makohon-Moore AP, et al. Limited heterogeneity of known driver gene mutations among the metastases of individual patients with pancreatic cancer. Nat. Genet. 2017;49:358–366. doi: 10.1038/ng.3764. - DOI - PMC - PubMed
    1. Kolbeinsson H, et al. Recurrence patterns and postrecurrence survival after curative intent resection for pancreatic ductal adenocarcinoma. Surgery. 2021;169:649–654. doi: 10.1016/j.surg.2020.06.042. - DOI - PubMed
    1. Sahin IH, et al. Pancreatic adenocarcinoma: insights into patterns of recurrence and disease behavior. BMC Cancer. 2018;18:769. doi: 10.1186/s12885-018-4679-9. - DOI - PMC - PubMed
    1. Van den Broeck A, et al. Patterns of recurrence after curative resection of pancreatic ductal adenocarcinoma. Eur. J. Surg. Oncol. 2009;35:600–604. doi: 10.1016/j.ejso.2008.12.006. - DOI - PubMed

Publication types

MeSH terms