

Allelic effects on uromodulin aggregates drive autosomal dominant tubulointerstitial kidney disease
- PMID: 37885358
- PMCID: PMC10701617
- DOI: 10.15252/emmm.202318242
Allelic effects on uromodulin aggregates drive autosomal dominant tubulointerstitial kidney disease
Abstract
Missense mutations in the uromodulin (UMOD) gene cause autosomal dominant tubulointerstitial kidney disease (ADTKD), one of the most common monogenic kidney diseases. The unknown impact of the allelic and gene dosage effects and fate of mutant uromodulin leaves open the gap between postulated gain-of-function mutations, end-organ damage and disease progression in ADTKD. Based on two prevalent missense UMOD mutations with divergent disease progression, we generated UmodC171Y and UmodR186S knock-in mice that showed strong allelic and gene dosage effects on uromodulin aggregates and activation of ER stress and unfolded protein and immune responses, leading to variable kidney damage. Deletion of the wild-type Umod allele in heterozygous UmodR186S mice increased the formation of uromodulin aggregates and ER stress. Studies in kidney tubular cells confirmed differences in uromodulin aggregates, with activation of mutation-specific quality control and clearance mechanisms. Enhancement of autophagy by starvation and mTORC1 inhibition decreased uromodulin aggregates. These studies substantiate the role of toxic aggregates as driving progression of ADTKD-UMOD, relevant for therapeutic strategies to improve clearance of mutant uromodulin.
Representative missense mutations in the UMOD gene causing ADTKD differentially drive the formation of mutant uromodulin aggregates, impacting on kidney damage and disease progression. Enhancement of autophagy decreased uromodulin aggregates, relevant for therapeutic strategies in ADTKD.
Two Umod KI models show strong allelic and gene dosage effects on uromodulin aggregates and activation of inflammation and fibrosis, leading to variable kidney damage.
The wild‐type Umod allele protects against the formation of uromodulin aggregates.
Studies in kidney tubular cells support mutation‐specific effects on uromodulin aggregates and activation of quality control and clearance mechanisms.
Enhancement of autophagy by mTORC1 inhibition decreased uromodulin aggregates.
Keywords: ADTKD-UMOD; aggregates; gain-of-function; kidney fibrosis; unfolded protein response.
© 2023 The Authors. Published under the terms of the CC BY 4.0 license.
Figures
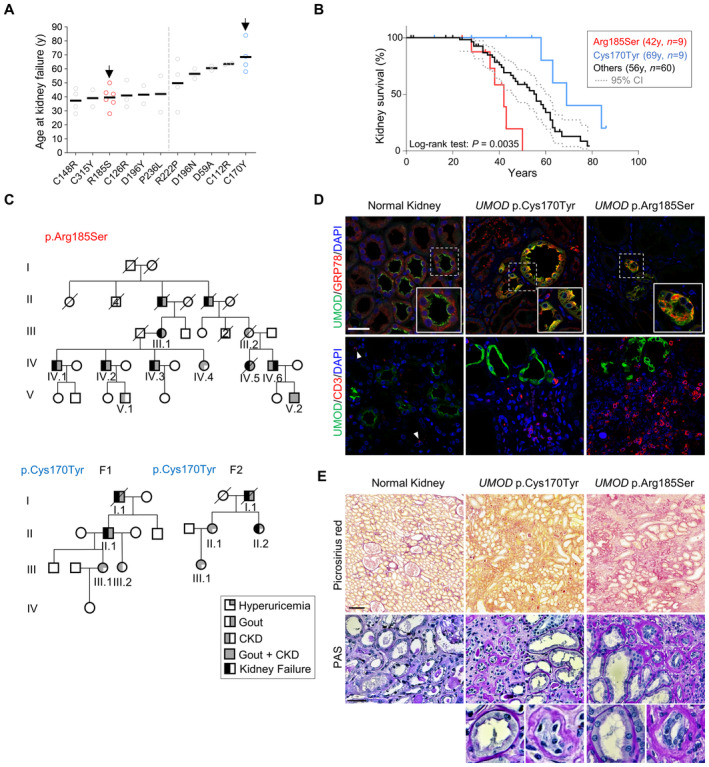
Age at onset of kidney failure for ADTKD‐UMOD patients with the indicated UMOD mutations. Only mutations with at least 2 individuals reaching kidney failure at documented age are represented here. Two clusters of UMOD mutations associated with earlier‐onset and later‐onset kidney failure with two cluster‐representative mutations (arrows, see Results text) are highlighted.
Kaplan–Meier curve of kidney survival in patients with the UMOD p.Arg185Ser mutation (n = 9, median age at kidney failure: 42 years), the UMOD p.Cys170Tyr mutation (n = 9, median age at kidney failure: 69 years) and 60 ADTKD‐UMOD patients from the Belgo‐Swiss registry (see Material & Methods) with 24 different UMOD mutations (median age at kidney failure: 56 years). A log‐rank test was used for comparison of survival curves. Dotted lines indicate 95% confidence interval.
Pedigrees of three multiplex families with ADTKD in which representative UMOD mutations p.Arg185Ser and p.Cys170Tyr have been identified. Females are represented by circles and males by squares, and phenotypes are denoted as indicated. Clinical features are detailed for each patient in Appendix Tables S1 and S2.
Representative confocal analysis of uromodulin (UMOD, green), GRP78/BiP or CD3 (red) of kidney nephrectomy samples from ADTKD‐UMOD patients (p.Cys170Tyr – F1, II.1; p.Arg185Ser – IV.5). Arrowheads indicate CD3+ cells. Nuclei were counterstained with DAPI (blue). Scale bar: 25 μm.
Picrosirius Red and periodic acid‐Schiff (PAS) stainings of kidney nephrectomy samples from ADTKD‐UMOD patients (p.Cys170Tyr – F1, II.1; p.Arg185Ser – IV.5). Squares indicate images shown at higher magnification. Scale bars: 100 μm for Picrosirius red; 50 μm for PAS.
- A
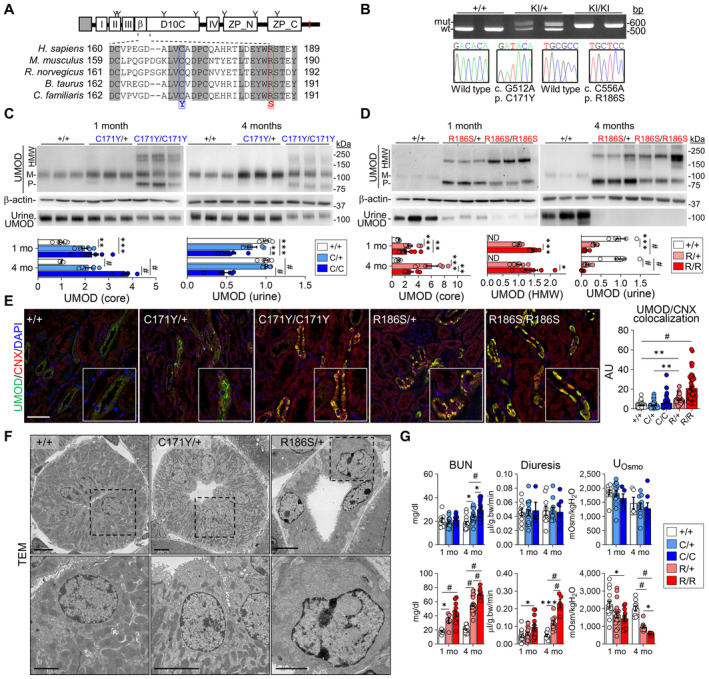
Uromodulin (UMOD) domain architecture including a signal peptide (gray box), four EGF‐like domains (I, II, III, IV), a beta‐hairpin (β), a cysteine‐rich domain (D10C) and a bipartite zona pellucida domain (ZP_N, ZP_C). The GPI‐anchoring site (red line) and glycosylation sites (Y) are indicated. Alignment of uromodulin amino acid sequences in different mammalian species is shown, with identity regions displayed as shadowed. Mutations of interest are indicated in red (p.R186S) and blue (p.C171Y).
- B
Genotyping and sequencing chromatogram of Umod KI mice, showing the regions surrounding the two mutations (c.C512, c.C556) in Umod.
- C, D
Immunoblot analysis of kidney and urine UMOD in 1‐ and 4‐month‐old Umod C171Y (C) and Umod R186S (D) mice. For kidney lysates, β‐actin was used as a loading control. Urine samples were normalized to creatinine concentration (n = 5–9 animals per group). Densitometry analysis is relative to Umod +/+ for core and to Umod R186S/+ for HMW aggregates. M: mature; P: precursor; HMW: high molecular weight. The mature and precursor UMOD are collectively referred to as the core. (C) UMOD (core), 1 mo: **P = 0.0034, ***P = 0.0003; UMOD (urine), 1 mo: **P = 0.0084, ***P = 0.0002; # P < 0.0001. (D) UMOD (core), 1 mo: ***P = 0.0002, **P = 0.0083; 4 mo: ***P = 0.0001, **P = 0.0038. UMOD (HMW), 1 mo: ***P = 0.0007; 4 mo: *P = 0.0158. UMOD (urine), 1 mo: ***P = 0.0001; # P < 0.0001.
- E
Representative immunofluorescence analysis of UMOD (green) and calnexin (CNX, red) in kidney sections from 4‐month‐old mice (n = 47–70 tubules per group). Nuclei are counterstained with DAPI (blue). Scale bar: 25 μm. **P(+/+ vs. R/+) = 0.0012, **P(C/+ vs. R/+) = 0.0011, # P < 0.0001.
- F
Transmission electron microscopy (TEM) of kidney sections from 3‐month‐old Umod mice, showing progressive ER expansion and hyperplasia. Squares indicate images shown at higher magnification. Scale bar: 5 μm for low magnification, 2 μm for high magnification.
- G
Main clinical parameters of Umod C171Y and Umod R186S mice at 1 and 4 months (n = 4–24 animals per group). C171Y‐BUN, 4 mo: *P(+/+ vs. C/+) = 0.0181, *P(C/+ vs. C/C) = 0.0367; R186S‐BUN, 1 mo: *P = 0.0373; Diuresis, 1 mo: *P = 0.0147; 4 mo: ***P = 0.0002. UOsmo, 1 mo: *P = 0.0153; 4 mo: *P = 0.03; # P < 0.0001.
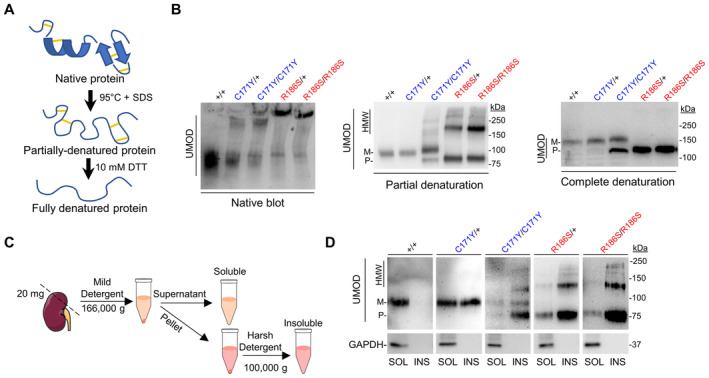
Schematic representation of the partial and total protein denaturation treatments.
Immunoblot analysis of kidney lysates from Umod KI mice in native (left), partially denatured (center) and completely denatured (right) conditions, showing the sample treatment‐dependent effect on uromodulin (UMOD) migration. Experiment performed in technical triplicate, with three biological replicates per genotype.
Schematic representation of the solubility assay protocol.
Solubility assay of UMOD in kidney lysates from 4‐month‐old Umod KI mice. GAPDH was used as a purity marker for the insoluble fraction.
- A
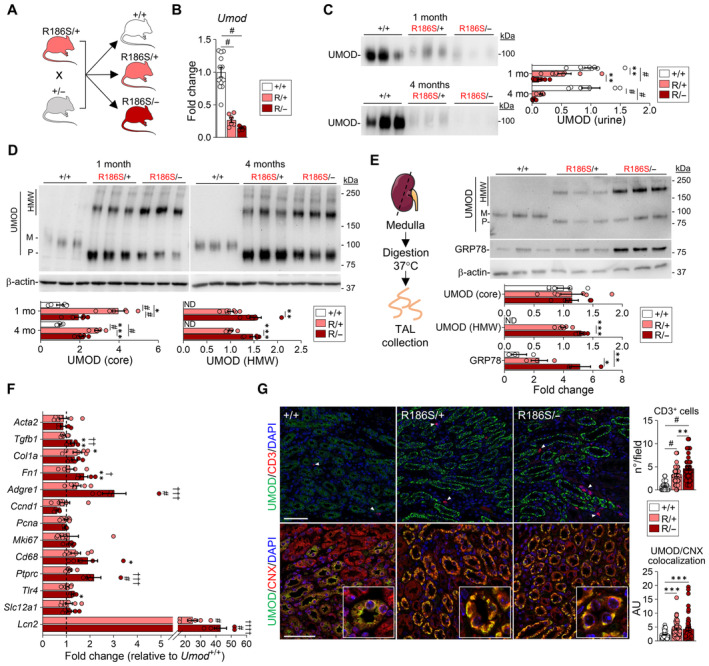
Strategy for the generation of Umod R186S/− mice.
- B
Umod transcript levels evaluated by RT–qPCR on total kidney extracts from 1‐month Umod R186S/+, Umod R186S/− , and Umod +/+ mice (n = 5–12 animals per group), # P < 0.0001.
- C
Immunoblot analysis of urine uromodulin (UMOD) in 1‐ and 4‐month Umod R186S/− mice. Urine was loaded according to creatinine concentration (n = 5–9 animals per group). 1 mo: **P(+/+ vs. R/+) = 0.0045, **P(R/+ vs. R/−) = 0.005; # P < 0.0001.
- D, E
Representative immunoblot analysis of UMOD in whole kidney at 1 month or 4 months (n = 5–6 animals per group) (D) or of UMOD and GRP78 in isolated TAL (n = 3–6 TAL fractions per group). (E). β‐actin was used as a loading control. Densitometry analysis is relative to Umod +/+ for core and to Umod R186S/+ for HMW aggregates. M: mature; P: precursor; HMW: high molecular weight. The mature and precursor UMOD are collectively referred to as the core. (D) UMOD (core), 1 mo: *P = 0.0323; 4 mo: ***P = 0.0001; UMOD (HMW), 1 mo: **P = 0.0031; 4 mo: ***P = 0.0002; # P < 0.0001. (E) UMOD (HMW): ***P = 0.0001. GRP78: *P = 0.0388, **P = 0.0065.
- F
Transcript levels of inflammation, proliferation, fibrotic markers and Slc12a1 as internal control assessed by RT–qPCR on total kidney extracts from mice at 1 month (n = 5–12 animals per group). Tgfb1: **P(+/+ vs. R/−) = 0.049, †† P(R/+ vs. R/−) = 0.001; Col1a1: *P(+/+ vs. R/+) = 0.0377; Fn1: **P(+/+ vs. R/−) = 0.0035, † P(R/+ vs. R/−) = 0.0398; Adgre1: ††† P(R/+ vs. R/−) = 0.0007; Cd68: *P(+/+ vs. R/−) = 0.0118; Ptprc: ††† P(R/+ vs. R/−) = 0.0002; Tlr4: *P(+/+ vs. R/+) = 0.0146; # P(vs. +/+) < 0.0001, †††† P(R/+ vs. R/−) < 0.0001.
- G
Representative immunofluorescence analysis of UMOD (green) and CD3 or calnexin (CNX, red) in kidney sections from 1‐month‐old mice. N = 40 fields from four kidneys per condition (up), n ≥ 57 tubules from three kidneys per condition (down). Arrowheads indicate CD3+ cells. Nuclei are stained with DAPI (blue). Scale bar: 50 μm. CD3+ cells: **P = 0.0034, # P < 0.0001; UMOD/CNX: ***P(+/+ vs. R/+) = 0.0007, ***P(+/+ vs. R/−) = 0.0008.
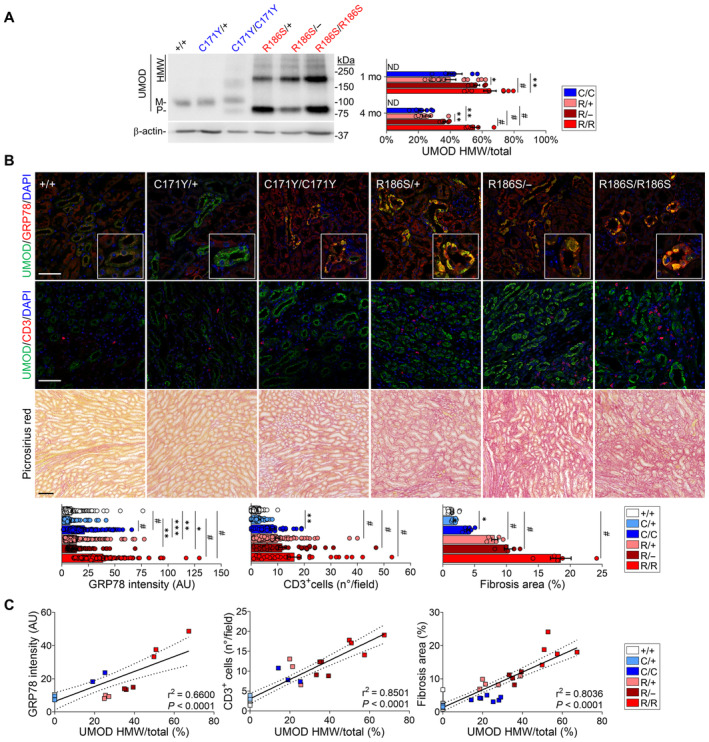
Representative immunoblots for uromodulin (UMOD) in kidneys from 1‐month wild‐type and mutant mice, showing distinct patterns for mature, precursor and HMW bands. β‐actin was used as a loading control (n = 6–15 animals per group). M: mature; P: precursor; HMW: high molecular weight. The mature and precursor UMOD are collectively referred to as the core. HMW aggregates are expressed as ratio over total UMOD (core + HMW). 1 mo: *P = 0.0252, **P = 0.0051; 4 mo: **P(C/C vs. R/−) = 0.001, **P(R/+ vs. R/−) = 0.0081; # P < 0.0001.
Immunofluorescence analysis of UMOD and GRP78 (top) or CD3 (middle) and picrosirius red staining on kidney sections from 4‐month‐old Umod KI mice (n = 3–11 animals per group). Scale bar: 25 μm for immunofluorescence, 50 μm for picrosirius red. GRP78: **P(+/+ vs. R/+) = 0.0024, **P(C/+ vs. R/−) = 0.0019, *P = 0.0223, ***P = 0.0002; CD3+: **P = 0.0051; Fibrosis: *P = 0.0154; # P < 0.0001.
Linear regression (black line) illustrating the correlation between UMOD aggregates and GRP78 intensity (left), CD3+ infiltrates (middle) and interstitial fibrosis (right) in 4‐month‐old Umod KI mice. The dotted lines show the 95% confidence intervals. Dots represent individual animals. The equations for the curves are y = 0.4501x + 6.350 (left), y = 0.2414x + 3.063 (middle), and y = 0.2668x + 1.342 (right).
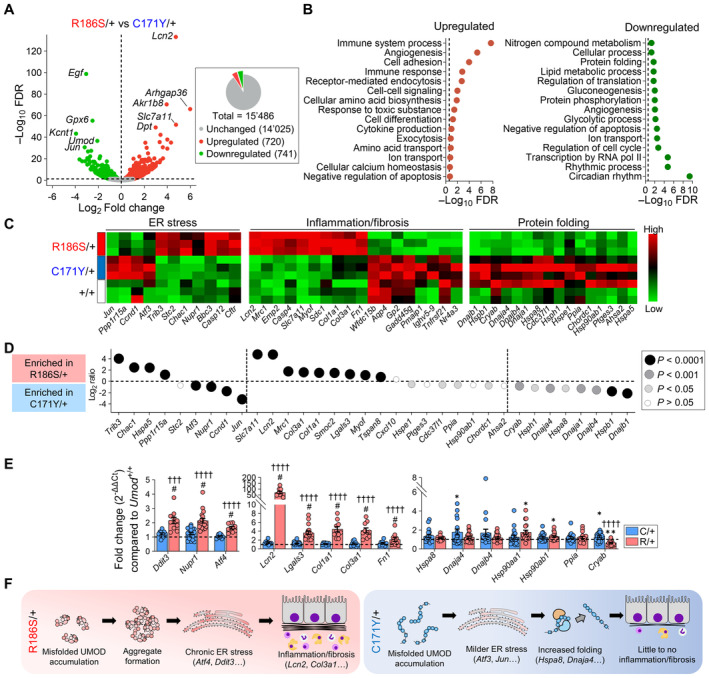
Volcano plot showing differentially expressed genes (DEGs) between Umod C171Y/+ and Umod R186S/+ kidneys at 4 months. Genes not significantly changed (FDR >0.05) are shown in gray, whereas genes that are up‐ or downregulated in Umod R186S/+ compared to Umod C171Y/+ are shown in red and green, respectively. The total numbers of unchanged, up‐ and downregulated genes are summarized in the pie chart.
Pathways of biological processes in gene ontology that are up‐ and downregulated in Umod R186S/+ compared to Umod C171Y/+.
Heat map of selected, divergent pathways involved in disease progression of Umod KI mice at 4 months.
Bubble plot of selected genes for key pathways, showing distinct signatures in the Umod C171Y/+ and Umod R186S/+ kidneys.
Validation of selected targets by RT–qPCR on 4‐month kidneys (n = 9–19 animals per group). Values are relative to Umod +/+ (black dotted line). Bars indicate the mean ± SEM. One‐way ANOVA with Tukey's post hoc test. Ddit3: ††† P(C/+ vs. R/+) = 0.001; Dnaja4: *P(vs. +/+) = 0.0437; Hsp90aa1: *P(vs. +/+) = 0.0214; Hsp90ab1: *P(vs. +/+) = 0.0494; Cryab: *P(vs. +/+) = 0.0490, **P(vs. +/+) = 0.0037; # P(vs. +/+) < 0.0001, †††† P(C/+ vs. R/+) < 0.0001.
Schematic representation of pathophysiological mechanisms in Umod R186S (left) and Umod C171Y kidneys (right).
- A
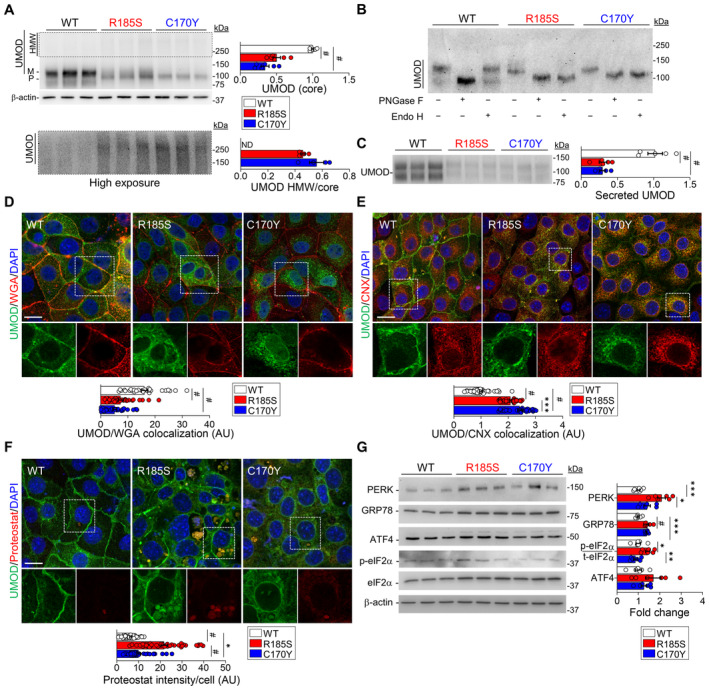
Immunoblot analysis of uromodulin (UMOD) in UMOD‐GFP cell lysates. β‐actin used as a loading control (n = 6 biological replicates). M: mature, P: precursor, HMW: high molecular weight. Bottom panel: longer exposure of HMW UMOD aggregates, # P < 0.0001.
- B
Immunoblot of UMOD from UMOD‐GFP cell lysates following PNGaseF or EndoH treatment.
- C
Representative immunoblot of UMOD in the apical medium of UMOD‐GFP cells (n = 5 biological replicates per group), # P < 0.0001.
- D–F
Representative immunofluorescence analysis of UMOD (green) and WGA (D), calnexin (CNX) (E) or PROTEOSTAT® (F) (red) in UMOD‐GFP cells (n = 29–39 cells per genotype). White squares indicate images shown at higher magnification. Scale bar: 30 μm (D, E), 15 μm (F). (E): ***P = 0.0005; (F): *P = 0.0375; # P < 0.0001.
- G
Immunoblot analysis of UPR markers in UMOD‐GFP cell lysates. β‐actin used as a loading control (n = 6–9 biological replicates per group). Quantification is relative to UMOD WT. PERK: ***P = 0.0002, *P = 0.0107; GRP78: ***P = 0.0001; p‐eIF2α/t‐eIF2α: *P = 0.02, **P = 0.0027; # P < 0.0001.
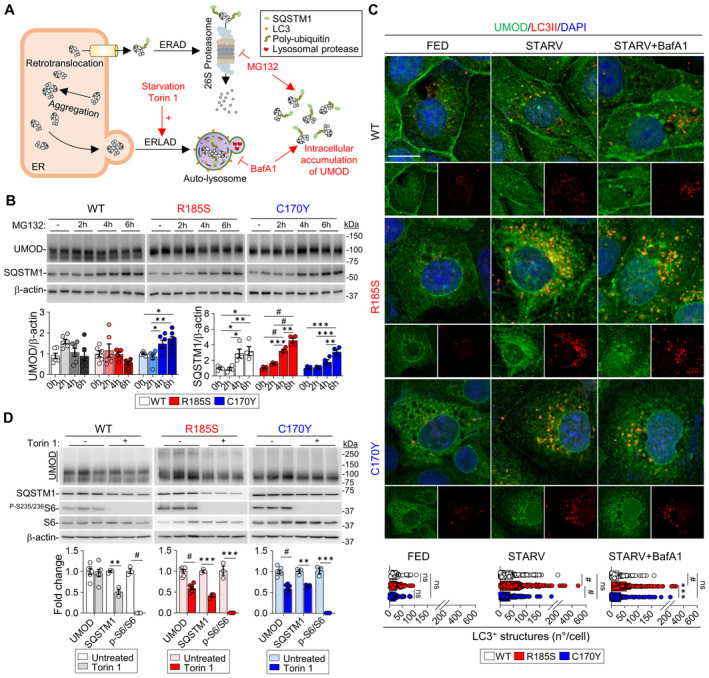
Diagram illustrating the degradation mechanisms of misfolded proteins and effect of different treatments. ERAD, ER‐associated degradation; ERLAD, ER‐to‐lysosome‐associated degradation.
Immunoblot analysis of uromodulin (UMOD) and SQSTM1 in UMOD‐GFP cells following MG132 treatment (n = 4–6 biological replicates per condition). UMOD, C170Y: *P(0 h vs. 6 h) = 0.0286, *P(2 h vs. 4 h) = 0.0323, **P = 0.0065; SQSTM1, WT: *P(0 h vs. 4 h) = 0.0312, *P(0 h vs. 6 h) = 0.0121, *P(2 h vs. 4 h) = 0.0234, **P = 0.0091; R185S: ***P = 0.0002, **P = 0.0011; C170Y: ***P(0 h vs. 6 h) = 0.001, ***P(2 h vs. 6 h) = 0.0002, **P(4 h vs. 6 h) = 0.0066; # P < 0.0001.
Immunofluorescence analysis of UMOD (green) and LC3 (red) in UMOD‐GFP cells following starvation and bafilomycin A1 treatment. Nuclei are counterstained with DAPI (blue). Scale bar: 10 μm (n = 41–59 cells per condition). Separate channels are shown below each panel. FED: ns P(WT vs. R185S) = 0.8672, ns P(WT vs. C170Y) = 0.4889, ns (R185S vs. C170Y)P = 0.7483; STARV: ns P = 0.1153; STARV+BafA1: ns P = 0.4738, ***P = 0.0002; # P < 0.0001.
Immunoblot analysis of UMOD, SQSTM1 and mTOR effectors following treatment with Torin 1 in UMOD‐GFP cells. β‐actin was used as a loading control. Densitometry analysis relative to untreated samples. WT, SQSTM1: **P = 0.0018; R185S, SQSTM1: ***P = 0.0001; p‐S6/S6: ***P = 0.0007; C170Y, SQSTM1: **P = 0.0027; p‐S6/S6: ***P = 0.0001; # P < 0.0001.
References
-
- Bates JM, Raffi HM, Prasadan K, Mascarenhas R, Laszik Z, Maeda N, Hultgren SJ, Kumar S (2004) Tamm‐Horsfall protein knockout mice are more prone to urinary tract infection. Kidney Int 65: 791–797 - PubMed
-
- Bernascone I, Vavassori S, Di Pentima A, Santambrogio S, Lamorte G, Amoroso A, Scolari F, Ghiggeri GM, Casari G, Polishchuk R et al (2006) Defective intracellular trafficking of uromodulin mutant isoforms. Traffic 7: 1567–1579 - PubMed
-
- Bernascone I, Janas S, Ikehata M, Trudu M, Corbelli A, Schaeffer C, Rastaldi MP, Devuyst O, Rampoldi L (2010) A transgenic mouse model for uromodulin‐associated kidney diseases shows specific tubulo‐interstitial damage, urinary concentrating defect and renal failure. Hum Mol Genet 19: 2998–3010 - PubMed
-
- Bleyer AJ, Kmoch S (2014) Autosomal dominant tubulointerstitial kidney disease: of names and genes. Kidney Int 86: 459–461 - PubMed
Publication types
MeSH terms
Substances
Associated data
- Actions
Grants and funding
LinkOut - more resources
Full Text Sources
Medical
Molecular Biology Databases
Miscellaneous
