

IFN-stimulated metabolite transporter ENT3 facilitates viral genome release
- PMID: 36652307
- PMCID: PMC9986816
- DOI: 10.15252/embr.202255286
IFN-stimulated metabolite transporter ENT3 facilitates viral genome release
Abstract
An increasing amount of evidence emphasizes the role of metabolic reprogramming in immune cells to fight infections. However, little is known about the regulation of metabolite transporters that facilitate and support metabolic demands. In this study, we found that the expression of equilibrative nucleoside transporter 3 (ENT3, encoded by solute carrier family 29 member 3, Slc29a3) is part of the innate immune response, which is rapidly upregulated upon pathogen invasion. The transcription of Slc29a3 is directly regulated by type I interferon-induced signaling, demonstrating that this metabolite transporter is an interferon-stimulated gene (ISG). Suprisingly, we unveil that several viruses, including SARS-CoV-2, require ENT3 to facilitate their entry into the cytoplasm. The removal or suppression of Slc29a3 expression is sufficient to significantly decrease viral replication in vitro and in vivo. Our study reveals that ENT3 is a pro-viral ISG co-opted by some viruses to gain a survival advantage.
Keywords: equilibrative nucleoside transporter; interferon-stimulated gene; macrophage; metabolite transporter; viral replication.
© 2023 The Authors. Published under the terms of the CC BY NC ND 4.0 license.
Figures

BMDMs were treated with E. coli (MOI = 100) for 30 min and further cultured for various length of time as indicated. The dynamic of ENT3 expression was determined by measuring Slc29a3 transcripts via RT‐qPCR.
Phagocytosis inhibitor, Cytochalasin D (CytoD), pretreated BMDMs were incubated with E. coli (MOI = 100) and subjected for Slc29a3 expression analysis via RT‐qPCR 6 h post‐infection.
The bacterial effector molecules generated from different treatments. Live, heat‐killed (HK), gentamicin‐killed (GK) E. coli, or metabolite‐containing supernatant (Meta), were prepared.
Different bacterial components were applied as stimulants to BMDMs. Slc29a3 expression was analyzed after 30 min of stimulation and a total of 6 h incubation.
BMDMs were treated with different doses of LPS for 30 min, harvested 6 h post‐stimulation, and subjected for RT‐qPCR analysis.

- A
The Schematic diagram of TLR4 signaling pathways.
- B
BMDMs from WT or MyD88−/− mice were treated with 10 ng/ml of LPS or live E. coli (MOI = 100) and subjected for Slc29a3 expression analysis.
- C, D
(C) WT or (D) MyD88−/− BMDMs were stimulated with 10 ng/ml LPS or live E. coli (MOI = 100) in the presence of 10 μM TBK inhibitor, MRT67307, and analyzed for Slc29a3 expression.
- E
The 10 ng/ml LPS‐treated BMDMs were examined for Ifnb1 expression after 30 min of stimulation and a total of 6 h incubation.
- F
BMDMs were treated with 100 U/ml of IFN‐β for various length of time and subjected for Slc29a3 expression.

BMDMs were treated with different MOIs of E. coli DH5α for 30 min and further cultured for various length of time as indicated. The dynamic of ENT3 expression was determined by measuring Slc29a3 transcripts via RT‐qPCR. Results from three biological replicates (n = 3) are shown.
The efficiency of phagocytosis inhibition by Cytochalasin D treatment in macrophages. BMDMs were incubated with pHrodo Red pre‐labeled GFP‐expressing E. coli BL21 (LiveEC) at MOI 100 in the presence or absence of phagocytosis inhibitor, Cytochalasin D (CytoD), for 30 min. Images were captured by Zeiss Axio Observer 7 40X lens after washing out the extracellular E. coli. Results were representative images from three biological replicates (n = 3). Scale bars represent 20 μm. Unpaired two‐tailed Student's t‐test was used for statistical analysis, **P < 0.01, ***P < 0.001, n.s. no significance. Data are shown as mean ± SEM.

- A
The brief schematic diagram of type I IFN downstream signaling cascades.
- B–E
BMDMs from WT, IFNAR1−/− (B), or STAT1−/− (C) mice were treated with 10 ng/ml LPS, live E. coli (MOI = 100), or 100 U/ml IFN‐β, harvested and examined for Slc29a3 induction. BMDMs from WT, IFNAR1−/− (D) or STAT1−/− (E) mice were treated with 100 U/ml IFN‐β, 50 μg/ml poly(I:C), or EMCV (MOI = 10), harvested and examined for Slc29a3 induction.
- F–H
The expression dynamic of Slc29a3 was profiled in BMDMs treated with two different doses of IFN‐α (F), IFN‐β (G), IFN‐γ (H) for various length of time as indicated.

- A
The induction fold change (treated/untreated) of Slc29a3 and selected ISG transcripts were curated from INTERFEROME database. Shown are data extracted from 250 IU/ml IFN‐β treated BMDMs.
- B
Potential STAT1 interacting sites on Slc29a3 were identified using the ChIP‐Atlas database. The red bars marked the STAT1‐binding sites while the height of the bars represented the frequency of STAT1 binding on the specified region.
- C
STAT1 binding to Irf1 GAS region was used as a positive control validating the quality of IFN‐β stimulation. BMDMs were stimulated with 100 U/ml of IFN‐β for 4 h and proceeded with qChIP.
- D–F
Primers targeting 3′ flanking region 2 (D), 3′ flanking region 1 (E), and promoter region (F) were used to quantify the STAT1 binding in BMDMs upon 100 U/ml IFN‐β after 4 h stimulation via qChIP assay.

- A–C
(A) BMDMs were infected with EMCV (MOI = 10) and harvested at indicated time points. (B) THP‐1 derived macrophages were challenged with EV71 (MOI = 5) and collected at different time points. (C) BMDMs were co‐cultured with 50 μg/ml poly(I:C) with various length of time and harvested. The mRNA expression of Slc29a3 or SLC29A3 was measured by RT‐qPCR. The expression level was calculated relative to Rpl19 or RPLP0 and normalized to untreated group at time 0 as 1. Results are combined from three biological replicates (n = 3).
- D, E
ENT3fl/fl and Cx3cr1cre/+ENT3fl/fl mice (n = 12) were challenged with EMCV (104 PFU, i.p.) and monitored for survival (D) and disease severity (E) for 2 weeks. Survival results were analyzed by log‐rank (Mantel‐Cox) test, *P < 0.05.
- F, G
ENT3fl/fl and Cx3cr1cre/+ENT3fl/fl mice were challenged with 107 PFU EMCV and measured the viral titer in the brain at post‐infection day 3 by plaque assay (n = 6). Shown are representative plaque assay images (F) and the quantification (G).
- H
ENT3fl/fl and Cx3cr1cre/+ENT3fl/fl mice were challenged with 107 PFU EMCV and measured the serum IFN‐β level at post‐infection day 1 and 3 (day 0, n = 3–4; post‐infection, n = 6–9).
- A
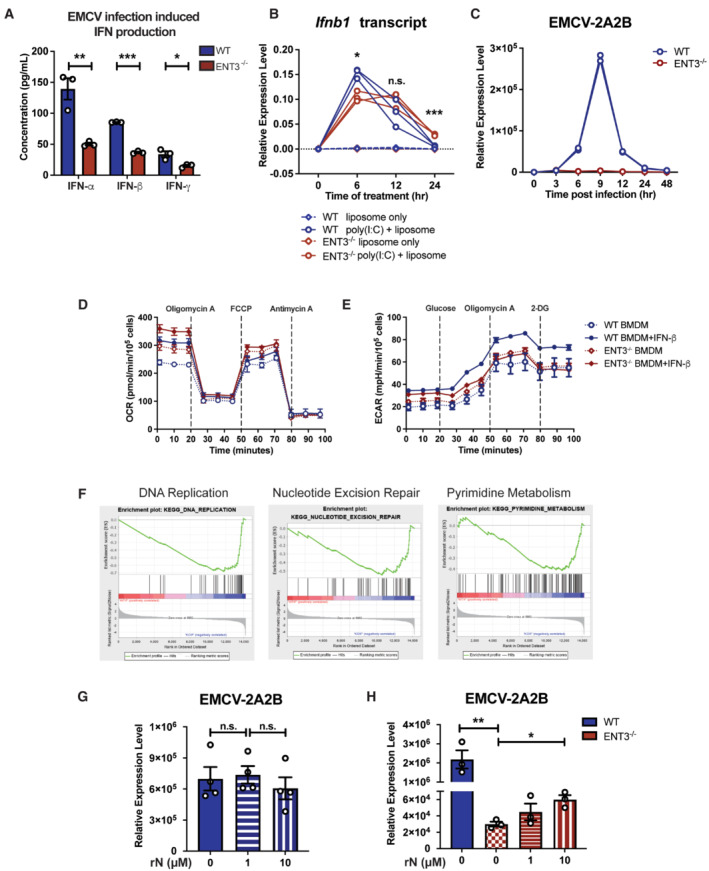
WT and ENT3−/− BMDMs were infected with EMCV (MOI = 10), and the culture supernatants were harvested 24 h post‐infection to measure the production of IFN‐α, IFN‐β, and IFN‐γ by ELISA. Shown are combined results from three biological replicates (n = 3).
- B
WT and ENT3−/− BMDMs were challenged with 2 μg/ml of liposome‐packed poly(I:C) for the length of time indicated and harvested to evaluate the Ifnb1 expression by RT‐qPCR. Shown are combined results from three biological replicates (n = 3).
- C
WT and ENT3−/− BMDMs were infected with EMCV (MOI = 10) for 2 h and allowed for viral replication for the various length of time as indicated. The expression level of EMCV‐2A2B was determined by RT‐qPCR. Representative data from three biological replicates (n = 3) are shown.
- D, E
The mitochondrial respiratory capacity (D) and glycolysis capacity (E) of WT and ENT3−/− BMDMs treated with 1,000 U/ml IFN‐β for 6 h were measured by extracellular flux analysis. Shown are the representative results of OCR and ECAR kinetics from six biological replicates (n = 6).
- F
GSEA of RNAseq results generated from WT and ENT3−/− BMDMs treated with 1,000 U/ml IFN‐β for 4 h. Shown are the significantly enriched pathways in ENT3−/− BMDMs.
- G, H
The replication of EMCV in WT (G) and ENT3−/− BMDMs (H) were evaluated in the presence of exogenous 1 or 10 μM of ribonucleosides (A, U, C, G) 9 h post‐infection (MOI = 10). The expression of EMCV‐2A2B was determined by RT‐qPCR. Shown are results from three to four biological replicates (n = 3–4).
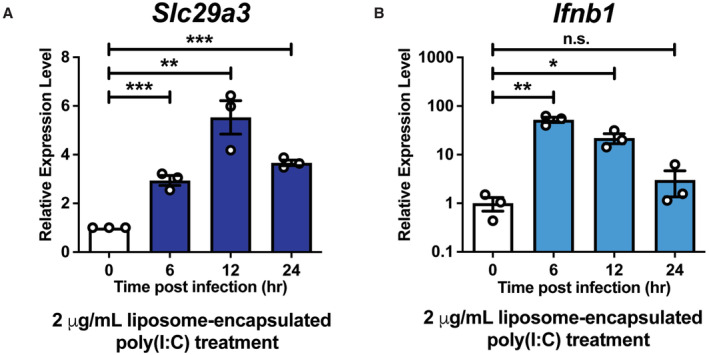
- A, B
BMDMs were treated with 2 μg/ml liposome‐encapsulated poly(I:C) and harvested at indicated time points. The expression profile of Slc29a3 or Ifnb1 was evaluated by RT‐qPCR. The expression level of Slc29a3 (A) and Ifnb1 (B) was calculated relative to Rpl19 and normalized to time point 0 as 1. Shown are results from three biological replicates (n = 3). Unpaired two‐tailed Student's t‐test was used for statistical analysis, *P < 0.05, **P < 0.01, ***P < 0.001, n.s. no significance. Data are shown as mean ± SEM.

- A
Illustration of strategy to track the viral uncoating upon infection.
- B–D
(B) WT and ENT3−/− BMDMs were infected with Syto82‐labeled EMCV (MOI = 1) and subjected to live imagining 30, 60, and 90 min post‐infection. The arrowheads indicated the Syto82+ virus puncta in the cell. Scale bars represent 10 μm. (C) Quantification of Syto82 signal in BMDMs after 60 min was performed by enumerating Syto82+ cells (%) and (D) the mean fluorescent intensity (MFI) per Syto82+ cell (D). Results were generated from images of three biological replicates (n = 3), each with four fields analyzed.
- E
WT and ENT3−/− BMDMs were infected with Syto82‐labeled EMCV (MOI = 1) and co‐stained with 100 nM Lysotracker Green, subjected to live imagining 60 min post‐infection. Data were the representative images of two biological replicates (n = 2). Scale bars represent 5 μm.
- F
WT and ENT3−/− BMDMs were infected with EMCV (MOI = 10) for 2 h and then enriched the endosomes and lysosomes. EMCV particles in endosome‐ or lysosome‐enriched fractions were quantified by plaque assay. Shown are combined results from three biological replicates (n = 3).
- G–K
(G) Calu‐3 cells were infected with SARS‐CoV‐2 original strain or delta variant at MOI = 0.1 for 48 h, harvested, and examined for SLC29A3 induction. (H) ENT3 knockdown in Calu‐3 cells was performed by lentiviral shRNA system. The knockdown efficiency was confirmed by RT‐qPCR. ENT3 knockdown Calu‐3 cells were infected with SARS‐CoV‐2 delta variant and subjected for the viral replication analysis 24 h post‐infection. The virus released out of cells was measured by plaque assay (I), and the viral titer in the cells was measured by RT‐qPCR (J). (K) The replication of SARS‐CoV‐2 delta variant in scramble and ENT3 knockdown Calu‐3 cells was evaluated in the presence of exogenous 1 or 10 μM of ribonucleosides (A, U, C, G) 24 h post‐infection (MOI = 0.1). The SLC29A3 expression level was calculated relative to RPLP0 and normalized to control as 1. The SARS‐CoV‐2 E gene expression level was calculated relative to RPLP0 to normalize the cell number. Shown are combined results from three biological replicates (n = 3).

- A, B
Heat map showing the comparison of housekeeping genes (A) and ISGs (B) in WT and ENT3−/− BMDMs. Data extrapolated from RNAseq results were generated with three biological repeats (n = 3).
- C
WT and ENT3−/− BMDMs were treated with 1,000 U/ml IFN‐β for 6 h and subjected for EU labeling. Representative results were derived from four biological replicates (n = 4), each with 5 fields analyzed. Unpaired two‐tailed Student's t‐test was used for statistical analysis, n.s. no significance. Data are shown as mean ± SEM.
- D
WT and ENT3−/− BMDMs were treated with exogenous 10 μM of ribonucleosides (A, U, C, G) for 4 h. The RNA Ct value of housekeeping genes was evaluated by RT‐qPCR. Shown are results from three biological replicates (n = 3). Data are shown as mean ± SEM.

The knockdown efficiency of ENT3 in human macrophages was measured by RT‐qPCR. The SLC29A3 expression level was calculated relative to RPLP0 and normalized to scramble as 1. Shown are results from three biological replicates (n = 3). Unpaired two‐tailed Student's t‐test was used for statistical analysis, **P < 0.01, data are shown as mean ± SEM.
The ENT3 knockdown human macrophages were infected with EV71 at MOI = 10 and subjected for viral replication 9 h post‐infection. The EV71‐3D expression level was performed by RT‐qPCR and calculated relative to RPLP0 and normalized to untreated group at time 0 as 1. Shown are combined results from five biological replicates (n = 5). Unpaired two‐tailed Student's t‐test was used for statistical analysis, ***P < 0.001. Data are shown as mean ± SEM.

- A
Calu‐3 cells were infected with SARS‐CoV‐2 original strain or delta variant at MOI = 0.1 and subjected for the viral titer analysis 24 h post‐infection by plaque assay. Results were generated from four biological replicates (n = 4). Unpaired two‐tailed Student's t‐test was used for statistical analysis, n.s., no significance. Data are shown as mean ± SEM.
- B
ENT3 knockdown Calu‐3 cells were infected with SARS‐CoV‐2 original strain and subjected for the viral replication analysis 24 h post‐infection. The level of SARS‐CoV‐2 E gene was measured by RT‐qPCR. The expression level was calculated relative to RPLP0 to normalize the cell number. Results were generated from three biological replicates (n = 3). Unpaired two‐tailed Student's t‐test was used for statistical analysis, *P < 0.05. Data are shown as mean ± SEM.
- C
The replication of SARS‐CoV‐2 in scramble and ENT3 knockdown Calu‐3 cells in the presence of exogenous 1 or 10 μM of ribonucleosides (A, U, C, G) 24 h post‐infection (MOI = 0.1) was evaluated. SARS‐CoV‐2 E gene transcripts were quantified by RT‐qPCR. The expression level was calculated relative to RPLP0 to normalize the cell number. Results were generated from four biological replicates (n = 4). Unpaired two‐tailed Student's t‐test was used for statistical analysis, *P < 0.05, n.s., no significance. Data are shown as mean ± SEM.
- D, E
The viral replication of SARS‐CoV‐2 (D) and delta strain (E) in the presence of ribonucleosides 24 h post‐infection (MOI = 0.1) was determined by plaque assay. Shown are results from four biological replicates (n = 4). Unpaired two‐tailed Student's t‐test was used for statistical analysis, n.s., no significance. Data are shown as mean ± SEM.
References
-
- Baldwin SA, Yao SYM, Hyde RJ, Ng AML, Foppolo S, Barnes K, Ritzel MWL, Cass CE, Young JD (2005) Functional characterization of novel human and mouse equilibrative nucleoside transporters (hENT3 and mENT3) located in intracellular membranes. J Biol Chem 280: 15880–15887 - PubMed
Publication types
MeSH terms
Substances
Associated data
- Actions
LinkOut - more resources
Full Text Sources
Medical
Molecular Biology Databases
Miscellaneous
