. 2014 Dec 23;11(12):e1001770.
doi: 10.1371/journal.pmed.1001770. eCollection 2014 Dec.

Genomic predictors for recurrence patterns of hepatocellular carcinoma: model derivation and validation

Affiliations

Genomic predictors for recurrence patterns of hepatocellular carcinoma: model derivation and validation

Ji Hoon Kim et al. PLoS Med. .

Abstract

Background: Typically observed at 2 y after surgical resection, late recurrence is a major challenge in the management of hepatocellular carcinoma (HCC). We aimed to develop a genomic predictor that can identify patients at high risk for late recurrence and assess its clinical implications.

Methods and findings: Systematic analysis of gene expression data from human liver undergoing hepatic injury and regeneration revealed a 233-gene signature that was significantly associated with late recurrence of HCC. Using this signature, we developed a prognostic predictor that can identify patients at high risk of late recurrence, and tested and validated the robustness of the predictor in patients (n = 396) who underwent surgery between 1990 and 2011 at four centers (210 recurrences during a median of 3.7 y of follow-up). In multivariate analysis, this signature was the strongest risk factor for late recurrence (hazard ratio, 2.2; 95% confidence interval, 1.3-3.7; p = 0.002). In contrast, our previously developed tumor-derived 65-gene risk score was significantly associated with early recurrence (p = 0.005) but not with late recurrence (p = 0.7). In multivariate analysis, the 65-gene risk score was the strongest risk factor for very early recurrence (<1 y after surgical resection) (hazard ratio, 1.7; 95% confidence interval, 1.1-2.6; p = 0.01). The potential significance of STAT3 activation in late recurrence was predicted by gene network analysis and validated later. We also developed and validated 4- and 20-gene predictors from the full 233-gene predictor. The main limitation of the study is that most of the patients in our study were hepatitis B virus-positive. Further investigations are needed to test our prediction models in patients with different etiologies of HCC, such as hepatitis C virus.

Conclusions: Two independently developed predictors reflected well the differences between early and late recurrence of HCC at the molecular level and provided new biomarkers for risk stratification. Please see later in the article for the Editors' Summary.


Conflict of interest statement

The authors have declared that no competing interests exist.

Figures
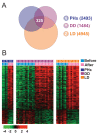
Figure 1
Figure 1. Hepatic injury and regeneration gene expression signature from human liver.
(A) Venn diagram of human genes whose expression levels are significantly different before and after liver transplantation or partial hepatectomy. Three gene lists (X, Y, and Z) represent differentially expressed genes from three datasets (partial hepatectomy [PHx], deceased-donor transplantation [DD], and living-donor transplantation [LD]). A p-value of <0.005 was required for a gene to be retained. (B) Expression patterns of the 325 probes representing 233 unique genes shared by the three patient groups. The data are presented in matrix format, in which rows represent individual genes, and columns represent each tissue sample. Each cell in the matrix represents the expression level of a gene feature in an individual tissue sample. The colors red and green in cells reflect relatively high and low expression levels, respectively, as indicated in the scale bar (log2 transformed scale). Colored bars at the top of the heat map represent samples as indicated.
Figure 2
Figure 2. Construction of prediction models in test cohorts.
(A) A schematic overview of the strategy used for constructing prediction models and evaluating predicted outcomes based on the 325-gene HIR signature. (B–D) Kaplan–Meier plots of the HIR and QT subgroups predicted by the Bayesian compound covariate predictor in cohorts 1 (B), 2 (C), and 3 (D). p-Values were obtained by log-rank test. The vertical lines indicate censored data. BCCP, Bayesian compound covariate predictor; LOOCV, leave-one-out cross-validation; RFS, recurrence-free survival.
Figure 3
Figure 3. Kaplan–Meier survival plots of recurrence free survival of patients from pooled cohorts.
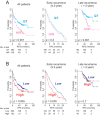
Patients were stratified by the HIR signature (A) or the 65-gene risk score (B). All patients (n = 396) are plotted in the left panel, patients with ≤2 y of follow-up (early recurrence) in the middle panel, and patients with more than 2 y of follow-up (late recurrence) in the right panel. p-Values were obtained from the log-rank test. The vertical lines denote observations that were censored owing to loss to follow-up or on the date of the last contact. RFS, recurrence-free survival.
Figure 4
Figure 4. Kaplan–Meier survival plots of recurrence free survival of patients with HCC stratified by the Broad signature.
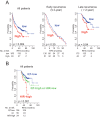
(A) All patients (n = 396) are plotted in the left panel, those with early recurrence (≤2 y) in the middle panel, and those with late recurrence (>2 y) in the right panel. (B) Patients were stratified into three groups by integrating outcomes from two prognostic models (HIR and Broad signatures); (1) HIR subgroup and Broad high-risk group (HIR-high; red), (2) QT subgroup and Broad low-risk group (QT-low; blue), and (3) QT subgroup and Broad high-risk group or HIR subgroup and Broad low-risk group (QT-high or HIR-low; int; green). p-Values were obtained from the log-rank test. Vertical lines denote observations that were censored owing to loss to follow-up or on the date of the last contact.
Figure 5
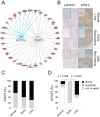
Figure 5. STAT3 and NOTCH1 networks in the hepatic injury and regeneration signature.
(A) Ingenuity transcription factor analysis revealed that networks of genes considerably associated with STAT3 and NOTCH1 in the HIR signature. Upregulated and downregulated genes in the HIR signature are indicated by red and green, respectively. Lines and arrows represent functional and physical interactions and the direction of regulation as indicated from the literature. (B) Representative immunohistochemical staining of pSTAT3 (left panel) and STAT3 (right panel) in normal liver, surrounding non-tumor tissue of HCC with early recurrence, and surrounding non-tumor tissue of HCC with late recurrence. (C and D) Expression and phosphorylation (Y705) levels of STAT3 were compared among normal liver, surrounding non-tumor tissue of HCC with early recurrence, and surrounding non-tumor tissue of HCC with late recurrence. p-Values were obtained by Fisher's exact test.
Figure 6
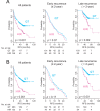
Figure 6. Concordance of HIR20 and HIR4 models with original HIR model.
Patients were stratified by HIR20 model (A) or HIR4 model (B). All patients (n = 396) are plotted in the left panel, those with early recurrence (≤2 y) in the middle panel, and those with late recurrence (>2 y) in the right panel. p-Values were obtained from the log-rank test. Vertical lines denote observations that were censored owing to loss to follow-up or on the date of the last contact.

References

    1. International Agency for Research on Cancer (2013) GLOBOCAN 2012: estimated cancer incidence, mortality and prevalence worldwide in 2012. Lyon (France): International Agency for Research on Cancer.
    1. Davila JA, Morgan RO, Shaib Y, McGlynn KA, El Serag HB (2004) Hepatitis C infection and the increasing incidence of hepatocellular carcinoma: a population-based study. Gastroenterology 127: 1372–1380. - PubMed
    1. El Serag HB, Mason AC (1999) Rising incidence of hepatocellular carcinoma in the United States. N Engl J Med 340: 745–750. - PubMed
    1. El Serag HB (2004) Hepatocellular carcinoma: recent trends in the United States. Gastroenterology 127: S27–S34. - PubMed
    1. Bruix J, Llovet JM (2002) Prognostic prediction and treatment strategy in hepatocellular carcinoma. Hepatology 35: 519–524. - PubMed

Publication types

Substances

Associated data