. 2024 Nov 30;15(1):10422.
doi: 10.1038/s41467-024-54920-9.

The dysadherin/MMP9 axis modifies the extracellular matrix to accelerate colorectal cancer progression

Affiliations

The dysadherin/MMP9 axis modifies the extracellular matrix to accelerate colorectal cancer progression

Choong-Jae Lee et al. Nat Commun. .

Abstract

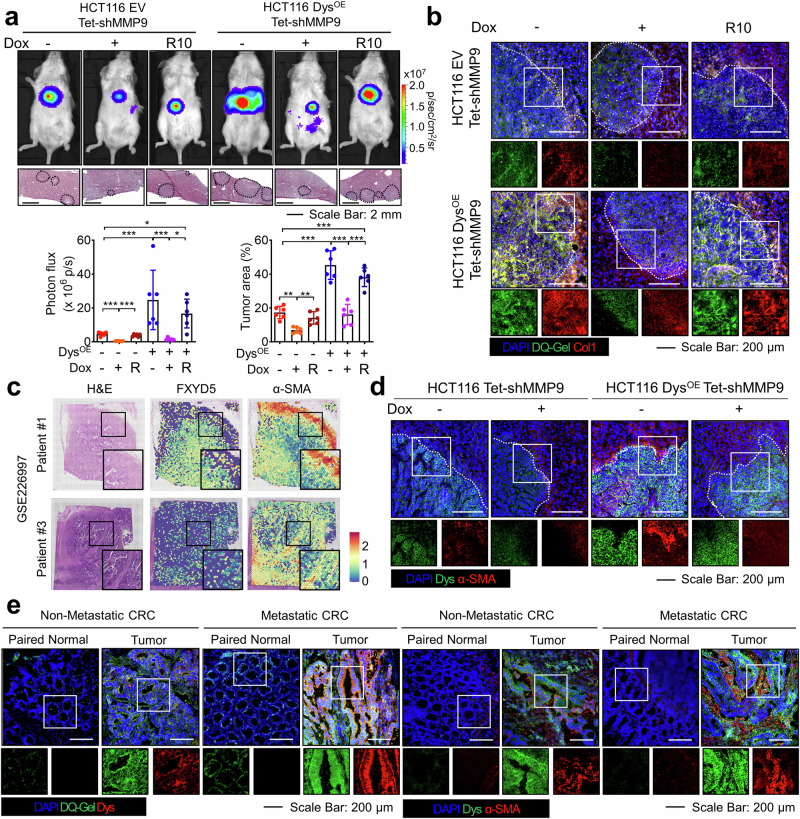
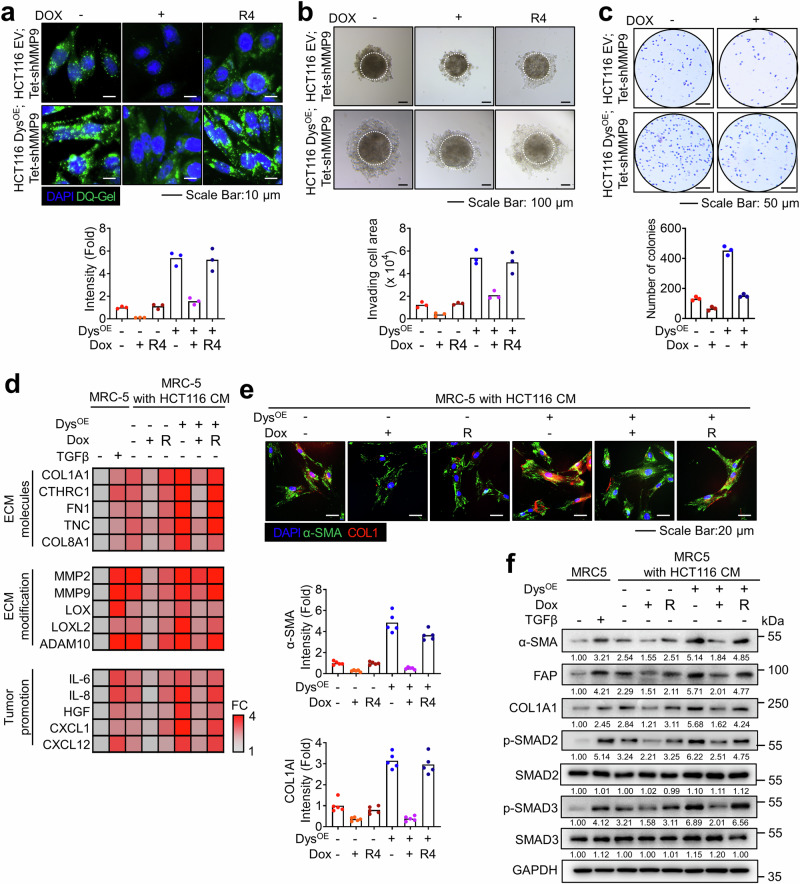
The dynamic alteration of the tumor microenvironment (TME) serves as a driving force behind the progression and metastasis of colorectal cancer (CRC). Within the intricate TME, a pivotal player is the extracellular matrix (ECM), where modifications in components, degradation, and stiffness are considered critical factors in tumor development. In this study, we find that the membrane glycoprotein dysadherin directly targets matrix metalloprotease 9 (MMP9), initiating ECM remodeling within the TME and amplifying cancer progression. Mechanistically, the dysadherin/MMP9 axis not only enhances CRC cell invasiveness and ECM proteolytic activity but also activates cancer-associated fibroblasts, orchestrating the restructuring of the ECM through the synthesis of its components in human CRC cells, patient samples, and mouse models. Notably, disruption of ECM reorganization by dysadherin knockout results in a discernible reduction in the immunosuppressive and proangiogenic milieu in a humanized mouse model. Intriguingly, these effects are reversed upon the overexpression of MMP9, highlighting the intricate and pivotal role of the dysadherin/MMP9 axis in shaping the development of a malignant TME. Therefore, our findings not only highlight that dysadherin contributes to CRC progression by influencing the TME through ECM remodeling but also suggest that dysadherin may be a potential therapeutic target for CRC.


Conflict of interest statement

Competing interests: The authors declare no competing interests.

Figures

Fig. 1
Fig. 1. Dysadherin expression is associated with ECM remodeling in CRC.
a The list of DEGs in tumor tissue (n = 52) compared to normal tissue (n = 25) obtained from the Gene Expression Omnibus (GEO) database (GSE21510) was obtained through R2 analyses with the GEO platform (p < 0.001) and used for GSEA to determine the associated gene signatures. BioRender software (https://www.biorender.com/) was used to create the figure under an academic license. b UMAP plot of the epithelial cell cluster of CRC patients from GSE144735 and GSEA of genes differentially expressed between tumors (n = 2212) and normal (n = 1144) cells. c In situ zymography analysis and IF analysis of ECM components and dysadherin expression in CRC patient tissue (n = 50). d Left: Dysadherin expression in patients with CRC. mRNA expression data from patient tumors were obtained from the GEO database (GSE21510), and patients were divided into two groups according to the median dysadherin expression level (dysadherinhigh, n = 52; dysadherinlow, n = 52). Right: GSEA of DEGs between the dysadherinhigh and dysadherinlow cohorts. e Left: UMAP plot of the tumor cell cluster of CRC patients from GSE225857, colored according to dysadherin (FXYD5) expression (FXYD5Pos, n = 1535; FXYD5Neg, n = 6486). Right: GSEA of genes differentially expressed between dysadherin-expressing cells and dysadherin-nonexpressing cells. f In situ zymography and IF of the intestines of 24-week-old ApcMin/+ mice with or without dysadherin (Fxyd5) knockout labeled for DQ-collagen I, dysadherin, and collagen I (n = 5 mice per group). g In situ zymography analysis of mouse intestinal tumor organoids (n = 10/group). IF intensity data are presented as means ± SEMs. *** indicates p < 0.001. Statistical significance was determined by unpaired two-tailed Student’s t tests for comparisons between two groups. Source data are provided as a Source Data file. Dys dysadherin, Col1 collagen I, FN1 fibronectin, LAM laminin, DQ-Col1 DQCollagen I, NES normalized enrichment score, FDR false discovery rate, HE hematoxylin and eosin staining.
Fig. 2
Fig. 2. Dysadherin enhances MMP9 expression via the FAK/c-JUN axis.
a GSEA was performed using the mRNA-sequencing profiles of dysadherin KO and WT SW480 cells, which was performed in previous study. b Three candidate genes related to three gene signatures were identified. Heatmap indicated FC and p-value (unpaired two-tailed Student’s t tests) from mRNA-sequencing data. c Downstream analysis indicating the potential link between dysadherin/FAK pathway and MMP9, leading to ECM remodeling, malignancy, and metastasis. d Kaplan-Meier analysis of CRC patients by dividing into three groups according to dysadherin and MMP9 expression. Statistical significance was determined by log-rank tests. e Immunoblotting for dysadherin, E-cadherin, and MMP9 expression and gel zymography in human CRC and normal colon cell lines. f Immunoblotting for dysadherin and MMP9 and gel zymography in dysadherin KO or OE CRC cells. g Venn diagram showing overlapping transcription factors that are positively correlated with MMP9 expression. h Immunoblotting for p-FAK, total FAK, p-c-JUN, total c-JUN, and MMP9 in EV and dysadherin OE HCT116 cells treated with or without 1 µM PND-1186 or 20 µM T-5224. i Promoter activity of MMP9 was tested via luciferase reporter assay. MMP9 promoter region-containing vector was transfected into EV and dysadherin OE HCT116 cells, and cells were treated with or without PND-1186 or T-5224. Total transcription was normalized to β-galactosidase transcription and is presented as fold change with respect to nontreated HCT116 cells. j Binding affinity of c-JUN on MMP9 promoter with or without PND-1186 or T-5224 in SW480 cells was tested via ChIP assay. i, j n = 3 biological replicates, representative of three independent experiments with similar results. Immunoblot assays were independently repeated three times with similar results. The data are presented as the means ± SEMs. *, **, and *** indicate p < 0.05, p < 0.01 and p < 0.001, respectively. Statistical significance was determined by one-way ANOVA with Dunnett’s multiple comparison test for comparisons among three groups. Source data are provided as a Source Data file. FC fold change, P paired normal, T tumor, WT wild-type, KO knockout, EV empty vector, OE overexpression, Ct threshold of cycle, dCt delta Ct, difference of Ct value between target and housekeeping gene.
Fig. 3
Fig. 3. The dysadherin/MMP9 axis enhances the metastatic potential via CAF activation.
a Top: Representative in vivo bioluminescence images of mice (n = 6/group) injected with luciferase-labeled HCT116 cells transfected with EV or dysadherin OE vectors along with Tet-shMMP9. Bottom: the corresponding graph shows the results of the quantitative analysis of the region of interest. Middle: Representative hematoxylin and eosin-stained livers with metastasis. R means ‘rescued following doxycycline withdrawal’ b IF analysis of collagen I and in situ zymography analysis of mouse livers with metastatic tumors (n = 6/group). c Spatial plots showing the spatial expression pattern of α-SMA, a CAF marker, and dysadherin (FXYD5) using GSE226997 dataset. d IF analysis of dysadherin and α-SMA in mouse livers with metastatic tumors (n = 6/group). e In situ zymography analysis and IF analysis of dysadherin and α-SMA expression in CRC patient tissue (Non-metastatic CRC, n = 36; Metastatic CRC, n = 14). The data in a are presented as means ± SEMs. *, **, and *** indicate p < 0.05, p < 0.01 and p < 0.001, respectively. Statistical significance was determined by one-way ANOVA with Dunnett’s multiple comparison test for comparisons among more than three groups. Source data are provided as a Source Data file.
Fig. 4
Fig. 4. The dysadherin/MMP9 axis increases proteolytic activity, invasive potential and CAF activation in the ECM.
In situ zymography analysis (a), 3D invasion assay (b), and anchorage-independent growth assay (c) of Tet-pLKO-shMMP9 transfected EV and dysadherin OE HCT116 cells with or without doxycycline (n = 3 biological replicates, representative of three independent experiments with similar results). d Heatmap comparing the relative expression of factors related to collagens, ECM modification, and tumor promotion in MRC-5 cells cultured with culture medium (CM) from control or dysadherin OE HCT116 cells transfected with Tet-shMMP9 (n = 3 biological replicates). e IF analysis of α-SMA and collagen I expression in MRC-5 cells cultured with CM. The corresponding quantitation of 5 replicates is shown below (n = 5 biological replicates, representative of three independent experiments with similar results). f Immunoblot analyses of the expression of the α-SMA and fibroblast activation protein (FAP) as CAF markers, collagen I, p-SMAD2/3 and total SMAD2/3 in MRC-5 cells cultured with CM. Immunoblot assay was independently repeated three times with similar results. The data are presented as means ± SEMs. *, **, and *** indicate p < 0.05, p < 0.01 and p < 0.001, respectively. Statistical significance was determined by one-way ANOVA with Dunnett’s multiple comparison test for comparisons among six or four groups. Source data are provided as a Source Data file.
Fig. 5
Fig. 5. The dysadherin/MMP9 axis facilitates metastasis potential by shaping the protumor microenvironment.
a Representative in vivo bioluminescence images of mice injected with luciferase-labeled wild-type or dysadherin KO SW480 cells with/without MMP9 OE, accompanied by a corresponding graph showing the quantitative analysis of the region of interest. Middle: Representative hematoxylin and eosin-stained livers with metastasis (n = 5/group). b In situ zymography analysis and IF analysis of dysadherin, α-SMA, and collagen I expression in mouse liver tissue from metastatic tumors. c Heatmap comparing the relative expression of ECM deposition factors in metastatic tumors in the mouse liver (n = 5/group). d Heatmap comparing the relative expression of macrophage polarization and T-cell related markers in metastatic tumors in the mouse liver (n = 5/group). e Levels of IL-4 and IFN-γ in metastatic tumors, from ELISA data (n = 3/group). f Quantitative analysis of CD8 IF data from mouse livers with metastatic tumors (n = 5/group). g Heatmap comparing the relative expression of angiogenesis-related factors in metastatic tumors in the mouse liver (n = 5/group). h Quantitative analysis of CD31 IF data from mouse livers with metastatic tumors (n = 5/group). i Schematic summary of the study findings indicating the potential role of dysadherin in cancer cells in promoting ECM remodeling and CAF activation, which contributes to the formation of a malignant TME. BioRender software was used to create the figure under an academic license. The data are presented as means ± SEMs. *, **, and *** indicate p < 0.05, p < 0.01 and p < 0.001, respectively. Statistical significance was determined by one-way ANOVA with Dunnett’s multiple comparison test for comparisons among four groups. Source data are provided as a Source Data file.

References

    1. Rahimi Pordanjani, S., Baeradeh, N., Lotfi, M. H. & Pourmohammadi, B. Epidemiology of colorectal cancer: incidence, mortality, survival rates and risk factors. Razi J. Med. Sci.23, 41–50 (2016).
    1. Sung, H. et al. Global cancer statistics 2020: GLOBOCAN estimates of incidence and mortality worldwide for 36 cancers in 185 countries. CA: Cancer J. Clinicians71, 209–249 (2021). - PubMed
    1. Vatandoust, S., Price, T. J. & Karapetis, C. S. Colorectal cancer: Metastases to a single organ. World J. Gastroenterol.21, 11767 (2015). - PMC - PubMed
    1. Baghban, R. et al. Tumor microenvironment complexity and therapeutic implications at a glance. Cell Commun. Signal.18, 1–19 (2020). - PMC - PubMed
    1. Jahanban-Esfahlan, R. et al. RGD delivery of truncated coagulase to tumor vasculature affords local thrombotic activity to induce infarction of tumors in mice. Sci. Rep.7, 8126 (2017). - PMC - PubMed

Publication types

MeSH terms

Associated data