. 2010 Sep 1;24(17):1951-60.
doi: 10.1101/gad.1953310. Epub 2010 Aug 16.

Canonical and alternate functions of the microRNA biogenesis machinery

Affiliations

Canonical and alternate functions of the microRNA biogenesis machinery

Mark M W Chong et al. Genes Dev. .

Erratum in

  • Genes Dev. 2010 Oct 1;24(19):2228

Abstract

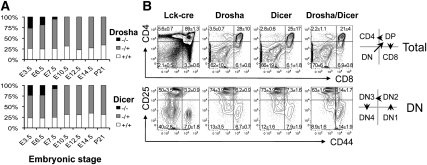
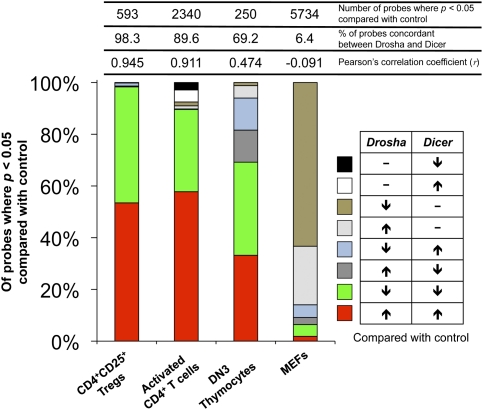
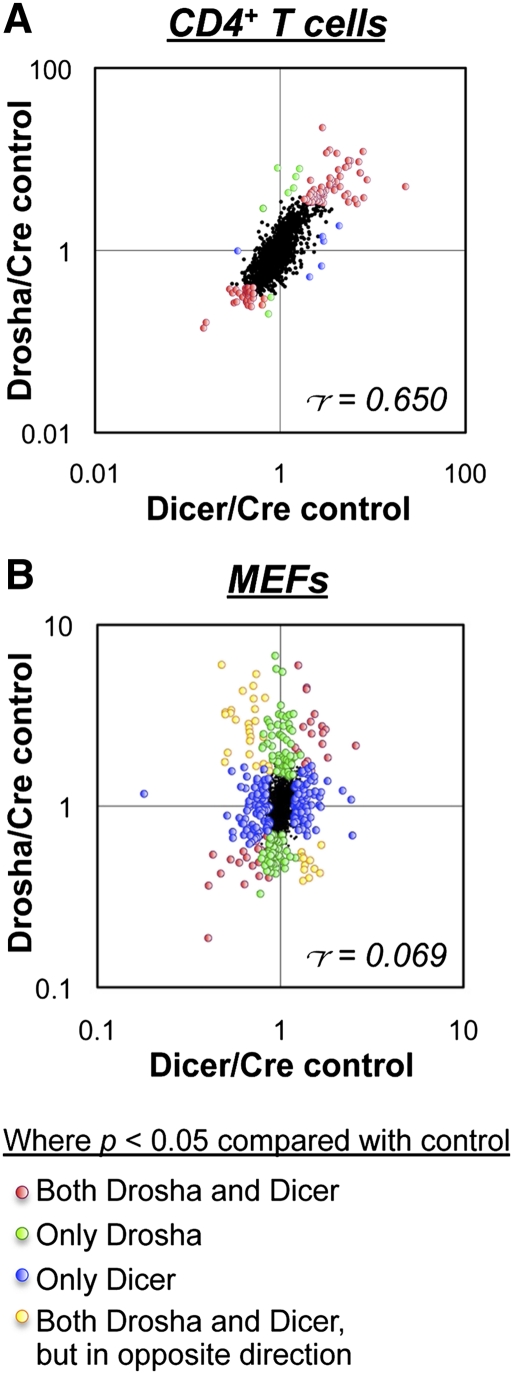
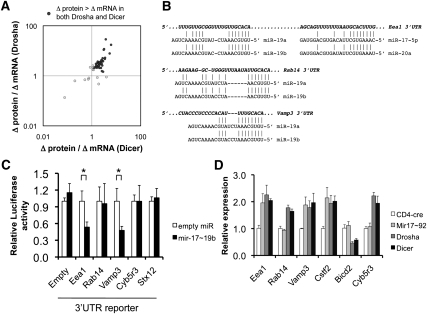
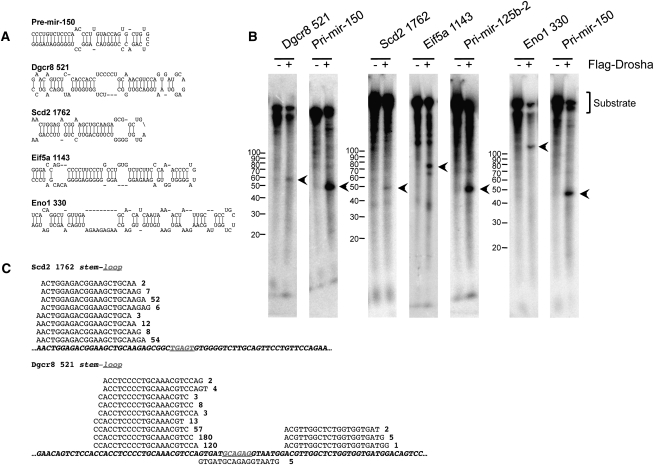
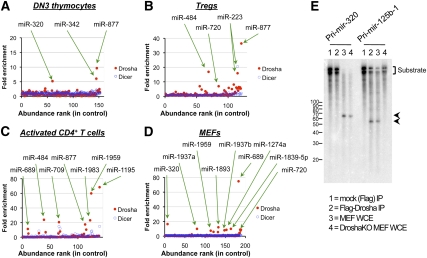
The canonical microRNA (miRNA) biogenesis pathway requires two RNaseIII enzymes: Drosha and Dicer. To understand their functions in mammals in vivo, we engineered mice with germline or tissue-specific inactivation of the genes encoding these two proteins. Changes in proteomic and transcriptional profiles that were shared in Dicer- and Drosha-deficient mice confirmed the requirement for both enzymes in canonical miRNA biogenesis. However, deficiency in Drosha or Dicer did not always result in identical phenotypes, suggesting additional functions. We found that, in early-stage thymocytes, Drosha recognizes and directly cleaves many protein-coding messenger RNAs (mRNAs) with secondary stem-loop structures. In addition, we identified a subset of miRNAs generated by a Dicer-dependent but Drosha-independent mechanism. These were distinct from previously described mirtrons. Thus, in mammalian cells, Dicer is required for the biogenesis of multiple classes of miRNAs. Together, these findings extend the range of function of RNaseIII enzymes beyond canonical miRNA biogenesis, and help explain the nonoverlapping phenotypes caused by Drosha and Dicer deficiency.


Figures

Figure 1.
Figure 1.
Overlapping and nonoverlapping phenotypes caused by Drosha and Dicer deficiency. (A) Embryonic lethality in germline Drosha- and Dicer-deficient mice. Shown is the frequency of the indicated genotypes at each stage in embryogenesis. Between 12 and 38 embryos were genotyped at each developmental stage. (B) Conditional deletion of the genes encoding Drosha and Dicer with Lck-cre early in thymocyte development causes a block at the DN3 stage. Shown are flow cytometric plots of CD4 versus CD8 expression on CD90+ total thymocytes (top row), and CD44 versus CD25 on CD4CD8TCRCD90+ “double-negative” thymocyes (bottom row). The quadrant values represent the mean ± SD of three sets of mice analyzed at 6 wk of age.
Figure 2.
Figure 2.
Impact of Drosha and Dicer deficiencies on gene expression profiles. Shown is a summary of microarray gene profiles of Drosha- and Dicer-deficient CD4+CD25+ Tregs, in vitro activated CD4+ T cells, DN3 thymocytes, and MEFs compared with the appropriate control cells expressing only Cre. In Tregs and CD4+ T cells, deletion was achieved with CD4-cre; in DN3 thymocytes, deletion was achieved with Lck-cre; and in MEFs, deletion was achieved with Gt(Rosa)26SorCreER. For each genotype, cell populations to be analyzed were sorted or prepared from two (CD4 and MEFs) or three individual mice (DN3 and Treg). The data represent only those probes that were significantly different (P < 0.05 by ANOVA) in Drosha- and/or Dicer-deficient cells compared with controls. Listed above the bars are the actual numbers of probes that were significantly different in either Drosha- or Dicer-deficient cells compared with controls, the percentage of these probes that were up in both Drosha- and Dicer-deficient cells or down in both, and the Pearson's correlation coefficient calculated for the changes measured in Drosha-deficient cells compared with the changes measured in Dicer-deficient cells.
Figure 3.
Figure 3.
Impact of Drosha and Dicer deficiencies on the proteome. Shown are ratios of individual protein expression levels in in vitro activated CD4+ T cells (A) and MEFs (B) as determined by SILAC analysis. Drosha-deficient cells were cultured in L-Lys/L-Arg-deficient medium supplemented with the light isotopes L-Lys 12C614N2 and L-Arg 12C614N4, Dicer-deficient cells were cultured in medium supplemented with the intermediate isotopes L-Lys 4,4,5,5-D4 and L-Arg 13C614N4, and control cells were cultured in medium supplemented with the heavy isotopes L-Lys 13C615N2 and L-Arg 13C615N4. The labels were then inverted for repeat experiments. Labeling was performed for at least five cell divisions to label all proteins before analysis by quantitative mass spectrometry. In CD4+ T cells, deletion was achieved with CD4-cre, and in MEFs, deletion was achieved with Gt(Rosa)26SorCreER. Only data for proteins that were quantified in all three genotypes are shown. Indicated are the proteins that were found to be significantly different (P < 0.05 by ANOVA) in Drosha- and/or Dicer-deficient cells compared with controls. r = Pearson's correlation coefficient.
Figure 4.
Figure 4.
Prediction of miRNA targets by measuring protein versus mRNA derepression in the absence of miRNAs. (A) Proteins that were up-regulated in both Drosha- and Dicer-deficient activated CD4+ T cells (from Fig. 3A) were analyzed for the magnitude of protein derepression versus mRNA derepression. The 3′UTRs of these genes were then analyzed for sites potentially targeted by miRNAs normally expressed in control cells. (B) Shown are predicted mir-17∼92a target sites in the 3′UTRs of Eea1, Rab14, and Vamp3, which were derepressed more at the protein than the mRNA level. (C) The entire 3′UTRs of Eea1, Rab14, and Vamp3 were inserted into a Firefly luciferase reporter and analyzed for reporter knockdown in the presence of overexpressed mir-17∼19b. (Mir-92a was left out of the expression construct because it was poorly processed.) Cyb5r3 and Stx12 3′UTRs were used as negative controls. The data represent the mean ± SEM of four experiments, normalized to Renilla luciferase as a transfection control. (*) P < 0.05 by t-test. (D) Confirmation of predicted mir-17∼92a targets in CD4+ T cells by specific deletion of the Mir17∼92a cluster. In vitro activated CD4+ T cells deficient in mir-17∼92a, Drosha, or Dicer were analyzed for expression levels of the predicted mir-17∼92a targets Eea1, Rab14, Vamp3, and Cstf2 by qRT–PCR. Analyses of Bicd2 and Cyb5r3 were included as negative controls. Bicd2, although a predicted mir-17∼92 target, was not derepressed in Drosha- or Dicer-deficient cells. The data represent the mean ± SEM of four experiments.
Figure 5.
Figure 5.
A subset of mRNAs can be directly cleaved by Drosha. (A) Shown are the stem–loop structures found in some of the mRNAs up-regulated in Drosha- but not Dicer-deficient DN3 thymocytes. As a comparison, the stem–loop structure of pre-mir-150 is shown. (B) mRNA-embedded stem–loop structures can be cleaved by Drosha in vitro. The indicated stem–loop structures ±150 nt were in vitro transcribed with T7 RNA polymerase in the presence of α-32PUTP. These were then incubated with immunoprecipitated Flag-Drosha. As positive controls, pri-mir-150 and pri-mir-125b-2 were also cleaved. Expected cleavage products are indicated by the arrows. (C) mRNA-embedded stem–loop structures can be fully processed into small RNAs in vivo. Small RNA (with 5′ phosphate and 3′ hydroxyl termini) libraries were constructed from DN3 thymocytes, and were analyzed by deep sequencing. Shown are the small RNAs that mapped to the stem–loop structures of Scd2 1762 and Dgcr8 521. Also indicated is the number of times each RNA was sequenced.
Figure 6.
Figure 6.
Drosha-independent miRNAs. Small RNA libraries (with 5′ phosphate and 3′ hydroxyl termini) were constructed from Drosha-deficient, Dicer-deficient, and control DN3 thymocytes (A), CD4+CD25+ Tregs (B), activated CD4+ T cells (C), and MEFs (D); then deep sequencing was performed. Libraries were normalized to an equivalent number of reads that mapped to the mouse genome. On the X-axis is a ranking of miRNAs based on expression level in control cells, from highest to lowest. On the Y-axis is the sequencing frequency in Drosha- or Dicer-deficient cells divided by control cells. Only miRNAs expressed at >100 copies per million in control cells are shown. (E) Pri-mir-320 (Drosha-independent) and pri-mir-125b-1 (Drosha-dependent) were in vitro transcribed with T7 RNA polymerase in the presence of α-32PUTP. These were incubated with immunoprecipitated Flag-Drosha or whole-cell extracts (WCE) from control or Drosha-deficient MEFs. Whole-cell extracts were obtained from untreated RnasenF/F Gt(Rosa)26SorCreER MEFs or those that had been pulsed with 4-OH tamoxifen for 1 d, followed by culture without tamoxifen for a further 3 d. Expected cleavage products are indicated by the arrows.

References

    1. Ashburner M, Ball CA, Blake JA, Botstein D, Butler H, Cherry JM, Davis AP, Dolinski K, Dwight SS, Eppig JT, et al. 2000. Gene Ontology: Tool for the unification of biology. The Gene Ontology Consortium. Nat Genet 25: 25–29 - PMC - PubMed
    1. Baek D, Villen J, Shin C, Camargo FD, Gygi SP, Bartel DP 2008. The impact of microRNAs on protein output. Nature 455: 64–71 - PMC - PubMed
    1. Bernstein E, Kim SY, Carmell MA, Murchison EP, Alcorn H, Li MZ, Mills AA, Elledge SJ, Anderson KV, Hannon GJ 2003. Dicer is essential for mouse development. Nat Genet 35: 215–217 - PubMed
    1. Calabrese JM, Seila AC, Yeo GW, Sharp PA 2007. RNA sequence analysis defines Dicer's role in mouse embryonic stem cells. Proc Natl Acad Sci 104: 18097–18102 - PMC - PubMed
    1. Cheloufi S, Dos Santos CO, Chong MM, Hannon GJ 2010. A dicer-independent miRNA biogenesis pathway that requires Ago catalysis. Nature 465: 584–589 - PMC - PubMed

Publication types

MeSH terms

Associated data