. 2024 Jun 21;22(1):342.
doi: 10.1186/s12964-024-01684-w.

Short-term response of primary human meniscus cells to simulated microgravity

Affiliations

Short-term response of primary human meniscus cells to simulated microgravity

Zhiyao Ma et al. Cell Commun Signal. .

Abstract

Background: Mechanical unloading of the knee articular cartilage results in cartilage matrix atrophy, signifying the osteoarthritic-inductive potential of mechanical unloading. In contrast, mechanical loading stimulates cartilage matrix production. However, little is known about the response of meniscal fibrocartilage, a major mechanical load-bearing tissue of the knee joint, and its functional matrix-forming fibrochondrocytes to mechanical unloading events.

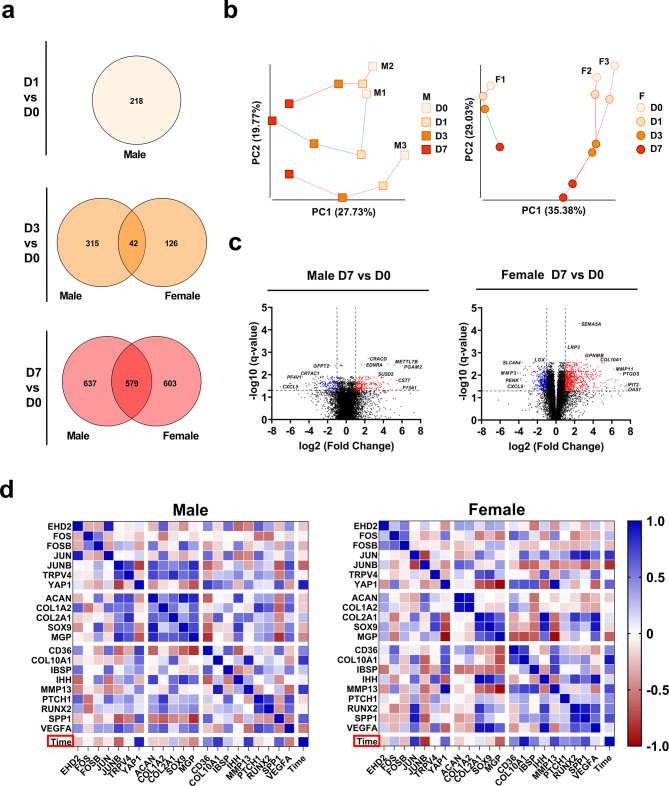
Methods: In this study, primary meniscus fibrochondrocytes isolated from the inner avascular region of human menisci from both male and female donors were seeded into porous collagen scaffolds to generate 3D meniscus models. These models were subjected to both normal gravity and mechanical unloading via simulated microgravity (SMG) for 7 days, with samples collected at various time points during the culture.

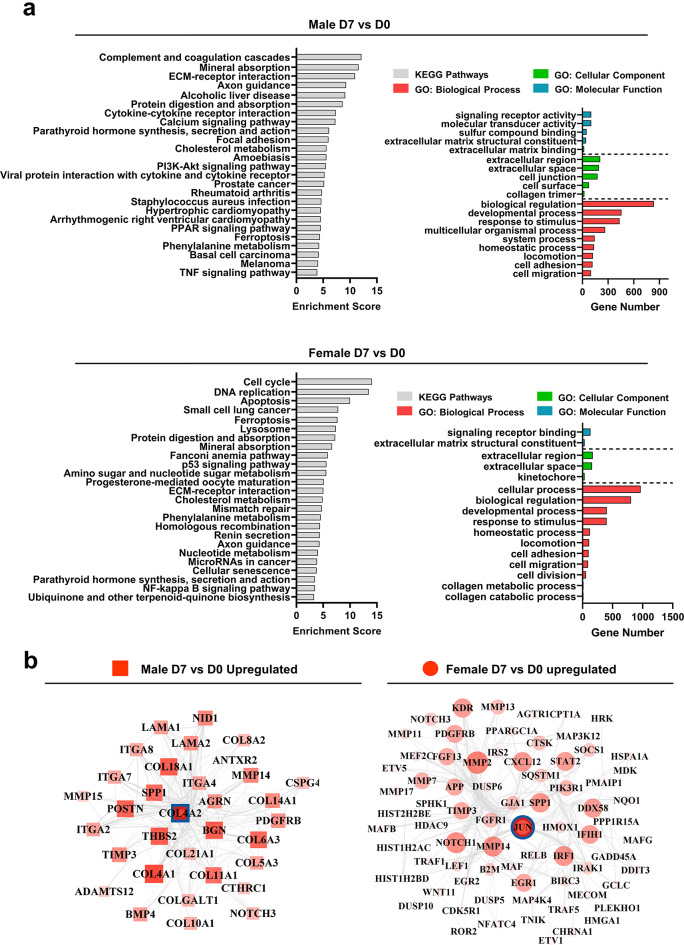
Results: RNA sequencing unveiled significant transcriptome changes during the 7-day SMG culture, including the notable upregulation of key osteoarthritis markers such as COL10A1, MMP13, and SPP1, along with pathways related to inflammation and calcification. Crucially, sex-specific variations in transcriptional responses were observed. Meniscus models derived from female donors exhibited heightened cell proliferation activities, with the JUN protein involved in several potentially osteoarthritis-related signaling pathways. In contrast, meniscus models from male donors primarily regulated extracellular matrix components and matrix remodeling enzymes.

Conclusion: These findings advance our understanding of sex disparities in knee osteoarthritis by developing a novel in vitro model using cell-seeded meniscus constructs and simulated microgravity, revealing significant sex-specific molecular mechanisms and therapeutic targets.

Keywords: Knee osteoarthritis; Primary cells; RNA-seq; Sex characteristics; Tissue engineering; Weightlessness simulation.


Conflict of interest statement

The authors declare no competing interests.

Figures

Fig. 1
Fig. 1
RNA sequencing and RT-qPCR-based transcriptome across all donors. a Schematic for analyzing temporal trajectories of cell-seeded meniscus constructs, initiated from a static control. Samples were collected on day 0 under static control, as well as on day 1, 3, and 7 under SMG condition for RNA-seq analysis. For RT-qPCR analysis, samples were collected on day 0 under static control and on day 1, 3, and 7 for both SMG and static conditions. b. Principal component analysis (PCA) of temporal transcriptome trajectory for all donors (n = 6). The first two principal components (PC1 and PC2) were plotted, with male and female donors represented by different shapes (square for male and circle for female), and different time points represented by different colors. c. Volcano plot of the whole transcriptome on day 1, 3, and 7 compared to day 0 for all donors. Upregulated DEGs (fold change ≥ 2, q-value ≤ 0.05) were labelled with red color and downregulated DEGs (fold change ≤ -2, q-value ≤ 0.05) were labelled with blue color. d. Characterization of the temporal expression trajectory of genes significantly correlated with SMG culture time (absolute partial correlation coefficient ≥ 0.8, q-value ≤ 0.05). To assess the temporal correlation, the expression level of each gene in the SMG group was compared at each time point with the expression level of the same gene on day 1 in the static group (fold change). The fold change in expression level was then compared to the trend of culture time to determine the temporal correlation of each gene. Top: positively correlated genes. Bottom: negatively correlated genes. Shaded area: Standard Deviation (SD) e. Characterization of the temporal expression trajectory of selected chondrogenic/OA-related signature genes. Data for females, males, and all donors combined were presented as mean values along with their corresponding standard deviations. Shaded area: Standard Deviation (SD).** p ≤ 0.005 compared to day 1
Fig. 2
Fig. 2
Functional enrichment of altered transcriptome induced by SMG across all donors. (a) Venn diagram of the comparison between all DEGs, upregulated DEGs, and downregulated DEGs in all donors (n = 6) across three time points. Each circle represents a distinct time point with the number of uniquely regulated genes indicated in the non-overlapping areas, while overlapping areas show the number of genes that are commonly regulated across multiple time points. (b) Top non-redundant Gene Ontology (GO) terms and KEGG pathways enriched by all DEGs on day 7
Fig. 3
Fig. 3
RNA sequencing based transcriptome profiling and trajectory analysis for male and female donors. (a) Venn diagram of the comparison between all DEGs regulated in male (n = 3) and female (n = 3) donors across three time points. (b) Principal component analysis (PCA) of temporal transcriptome trajectory for male and female donors. The first two principal components (PC1 and PC2) were plotted. (c) Volcano plot of the whole transcriptome on day 1, 3, and 7 compared to day 0 for male and female donors. Upregulated DEGs (fold change ≥ 2, q-value ≤ 0.05) were labelled with red color and downregulated DEGs (old change ≤ -2, q-value ≤ 0.05) were labelled with blue color. (d) Pearson correlation heatmap of select markers and culture time for male and female donors. Heatmap was generated by calculating the pairwise Pearson correlation coefficient, with the color of each cell representing the corresponding coefficient value
Fig. 4
Fig. 4
Functional enrichment of altered transcriptome induced by SMG for male and female donors. (a) Top non-redundant Gene Ontology (GO) terms and KEGG pathways enriched by all DEGs in male and female donors on day 7. (b) Hub protein networks for upregulated DEGs on day 7 in male and female donors. Hub protein was defined as the protein with the highest connectivity. A network was generated by including the hub protein and its direct connections with all other proteins. The size and density of color of each protein in the network reflected its level of connectivity, with larger and denser colors indicating higher connectivity. The hub protein in the net work was highlighted with a blue circle. The hub protein for male donors was identified as COL4A2, and for female donors was JUN

References

    1. Boyan BD, et al. Addressing the gaps: sex differences in osteoarthritis of the knee. Biol Sex Differ. 2013;4:4. doi: 10.1186/2042-6410-4-4. - DOI - PMC - PubMed
    1. Seitz AM, et al. Osteoarthritis-related degeneration alters the Biomechanical properties of Human Menisci before the articular cartilage. Front Bioeng Biotechnol. 2021;9:659989. doi: 10.3389/fbioe.2021.659989. - DOI - PMC - PubMed
    1. Englund M, Guermazi A, Lohmander SL. The role of the meniscus in knee osteoarthritis: a cause or consequence? Radiol Clin North Am. 2009;47:703–12. doi: 10.1016/j.rcl.2009.03.003. - DOI - PubMed
    1. Ozeki N, Koga H, Sekiya I. Degenerative Meniscus in knee osteoarthritis: from Pathology to Treatment. Life (Basel). 2022;12. 10.3390/life12040603. - PMC - PubMed
    1. Lange AK, et al. Degenerative meniscus tears and mobility impairment in women with knee osteoarthritis. Osteoarthritis Cartilage. 2007;15:701–8. doi: 10.1016/j.joca.2006.11.004. - DOI - PubMed

Publication types

Associated data